| Param | Original file | Final file |
|---|---|---|
| Filename | modeM0/AS1A10_073T07_9000004254_29539cztM0_level2.evt | modeM0/AS1A10_073T07_9000004254_29539cztM0_level2_quad_clean.evt |
| Size (bytes) | 661,343,040 | 90,950,400 |
| Size | 630.7 MB | 86.7 MB |
| Events in quadrant A | 3,241,236 | 585,575 |
| Events in quadrant B | 3,335,284 | 602,525 |
| Events in quadrant C | 3,498,487 | 573,665 |
| Events in quadrant D | 9,506,996 | 531,184 |
| Mode SS | |||
|---|---|---|---|
| Quadrant | BADHDUFLAG | Total packets | Discarded packets |
| A | 0 | 134 | 0 |
| B | 0 | 134 | 0 |
| C | 0 | 134 | 0 |
| D | 0 | 134 | 0 |
| Mode M9 | |||
|---|---|---|---|
| Quadrant | BADHDUFLAG | Total packets | Discarded packets |
| A | 0 | 12 | 0 |
| B | 0 | 13 | 0 |
| C | 0 | 13 | 0 |
| D | 0 | 13 | 0 |
| Mode M0 | |||
|---|---|---|---|
| Quadrant | BADHDUFLAG | Total packets | Discarded packets |
| A | 0 | 13915 | 3 |
| B | 0 | 14160 | 2 |
| C | 0 | 14444 | 2 |
| D | 0 | 32897 | 2 |
| Quadrant | Total seconds | Saturated seconds | Saturation percentage |
|---|---|---|---|
| A | 6614 | 42 | 0.635017% |
| B | 6614 | 48 | 0.725733% |
| C | 6614 | 260 | 3.931055% |
| D | 6614 | 1097 | 16.586030% |
Noise dominated data is calculated using 1-second bins in cleaned event files. If a bin has >2000 counts, and if more than 50% of those come from <1% of pixels, then it is considered to be noise-dominated and hence unusable.
| Quadrant | # 1 sec bins | Bins with >0 counts | Bins with >2000 counts | High rate bins dominated by noise | Noise dominated (total time) | Noise dominated (detector-on time) | Marked lightcurve |
|---|---|---|---|---|---|---|---|
| A | 7689 | 6615 | 0 | 0 | 0.00% | 0.00% | 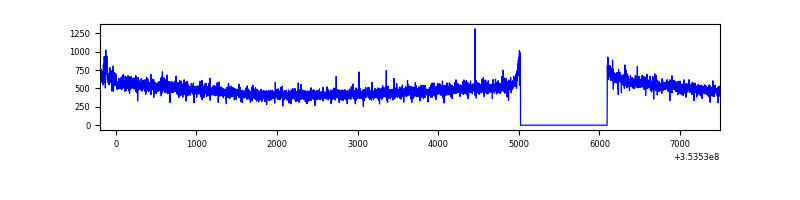 |
| B | 7689 | 6615 | 1 | 1 | 0.01% | 0.02% | 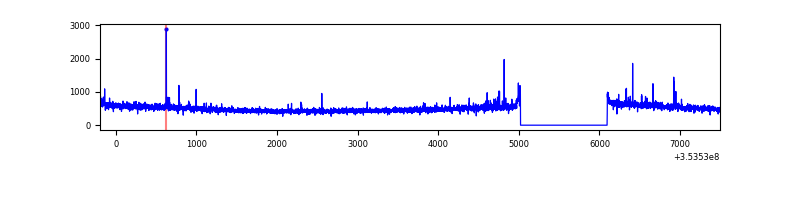 |
| C | 7689 | 6615 | 0 | 0 | 0.00% | 0.00% | 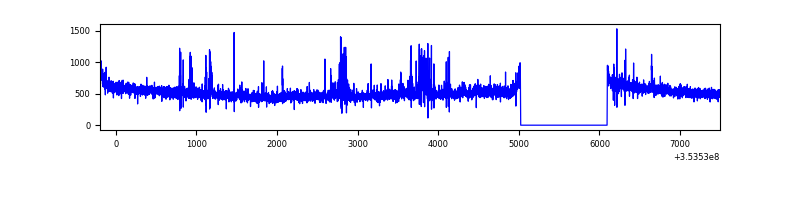 |
| D | 7689 | 6615 | 1053 | 1053 | 13.69% | 15.92% | 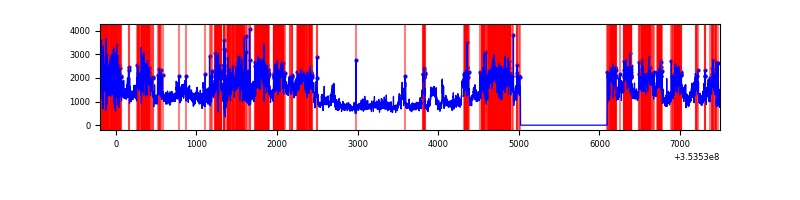 |
Top three noisy pixels from each quadrant. If the there are fewer than three noisy pixels in the level2.evt file, extra rows are filled as -1
| Pixel properties | Quadrant properties | ||||||
|---|---|---|---|---|---|---|---|
| Quadrant | DetID | PixID | Counts | Sigma | Mean | Median | Sigma |
| A | 11 | 29 | 15948 | 89.46 | 834 | 817 | 169.1 |
| A | 13 | 254 | 13049 | 72.32 | 834 | 817 | 169.1 |
| A | 3 | 137 | 8352 | 44.55 | 834 | 817 | 169.1 |
| B | 0 | 190 | 35084 | 213.64 | 835 | 815 | 160.4 |
| B | 12 | 111 | 19706 | 117.77 | 835 | 815 | 160.4 |
| B | 11 | 111 | 17673 | 105.1 | 835 | 815 | 160.4 |
| C | 14 | 238 | 210254 | 1116.87 | 800 | 805 | 187.5 |
| C | 14 | 254 | 111980 | 592.83 | 800 | 805 | 187.5 |
| C | 3 | 233 | 39539 | 206.55 | 800 | 805 | 187.5 |
| D | 8 | 195 | 5734269 | 31420.75 | 772 | 752 | 182.5 |
| D | 13 | 153 | 428448 | 2343.85 | 772 | 752 | 182.5 |
| D | 7 | 238 | 247593 | 1352.73 | 772 | 752 | 182.5 |
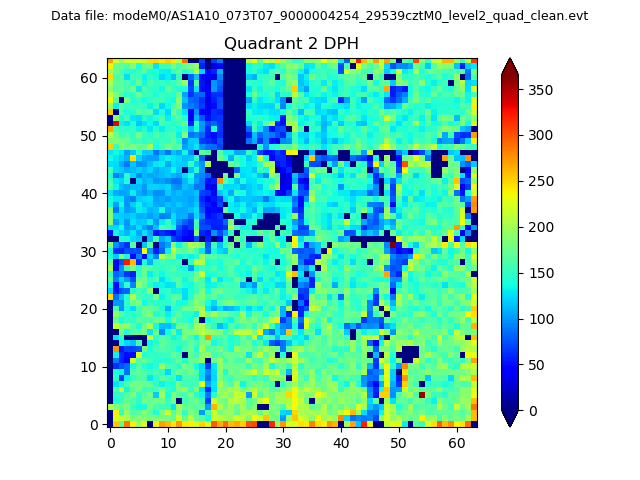
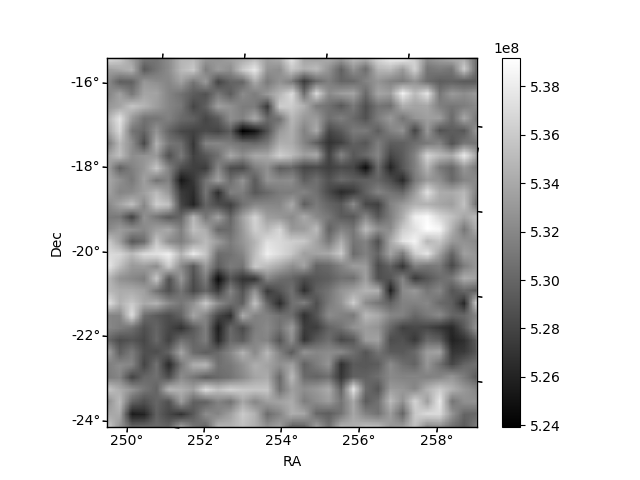
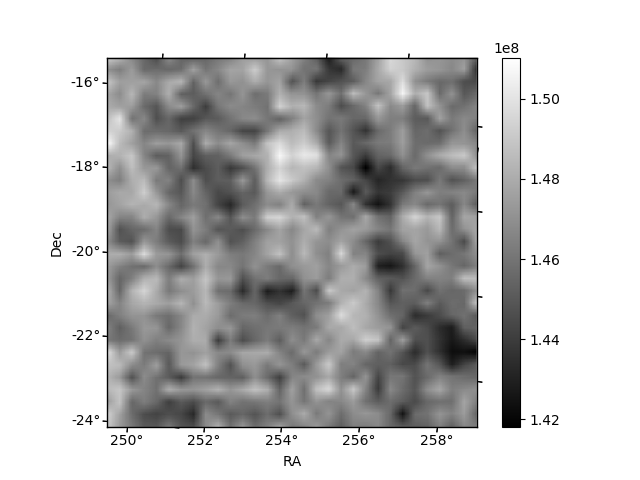
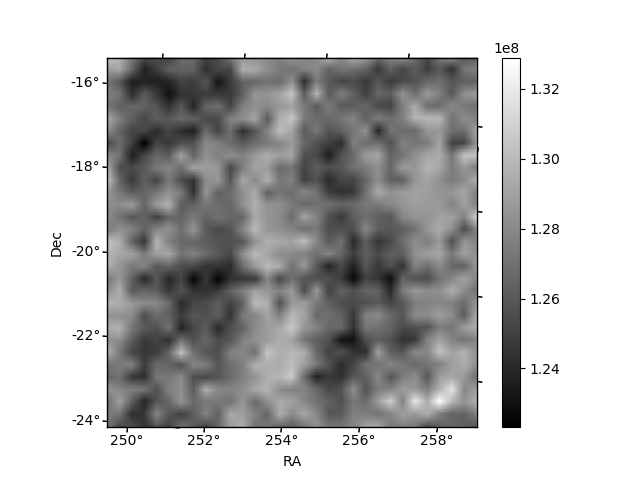
Histogram calculated using DETX and DETY for each event in the final _common_clean file
| Quadrant A | 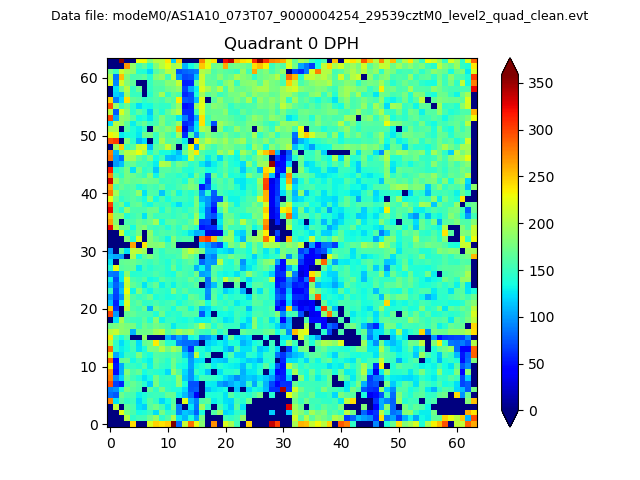 |
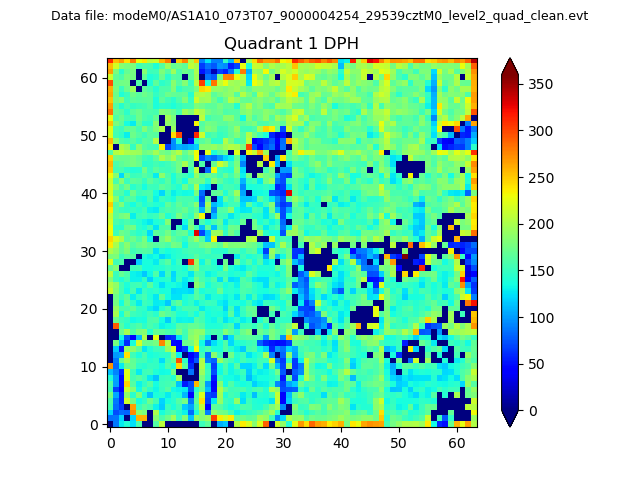 |
Quadrant B |
|---|---|---|---|
| Quadrant D | 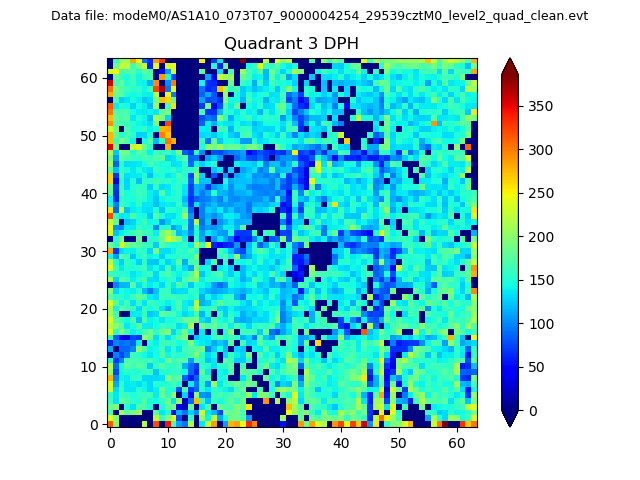 |
 |
Quadrant C |
| Plot type | Count rate plots | Images |
|---|---|---|
| Comparison with Poisson distribution Blue bars denote a histogram of data divided into 1 sec bins. Red curve is a Poisson curve with rate = median count rate of data. |
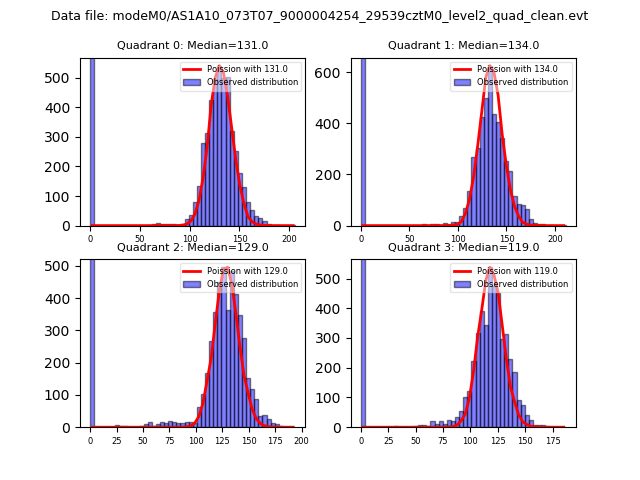 |
 |
| Quadrant-wise count rates Data is divided into 100 sec bins |
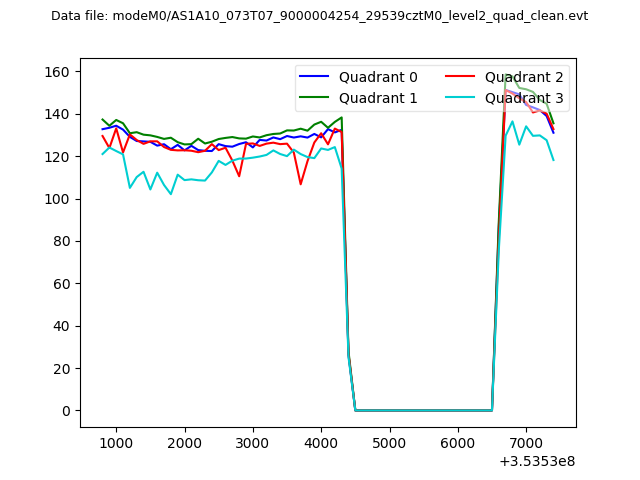 |
|
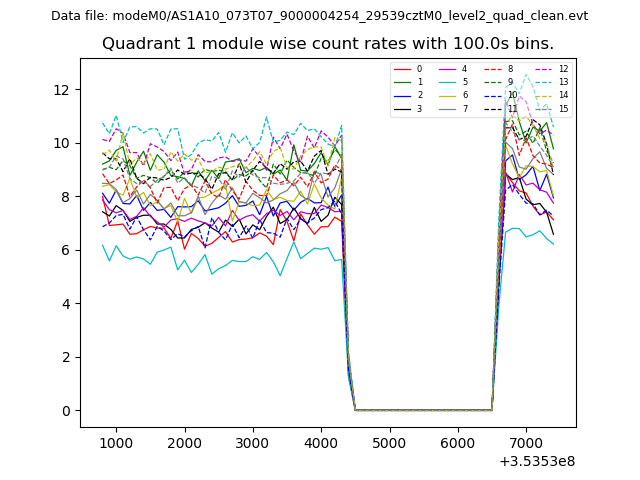
| Module-wise count rates for Quadrant A Data is divided into 100 sec bins |
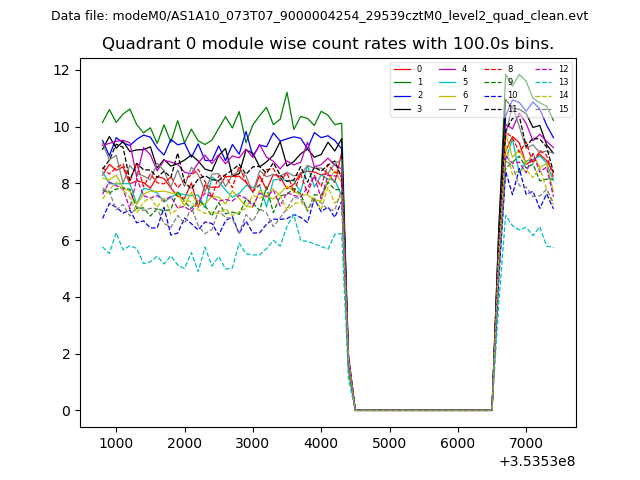 |
 |
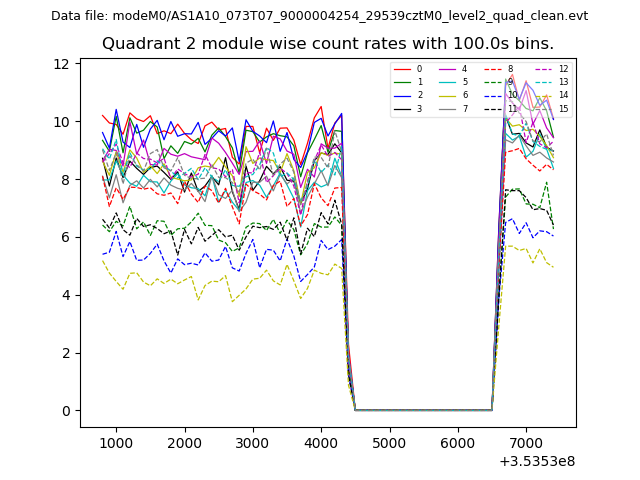
| Module-wise count rates for Quadrant B Data is divided into 100 sec bins |
 |
 |
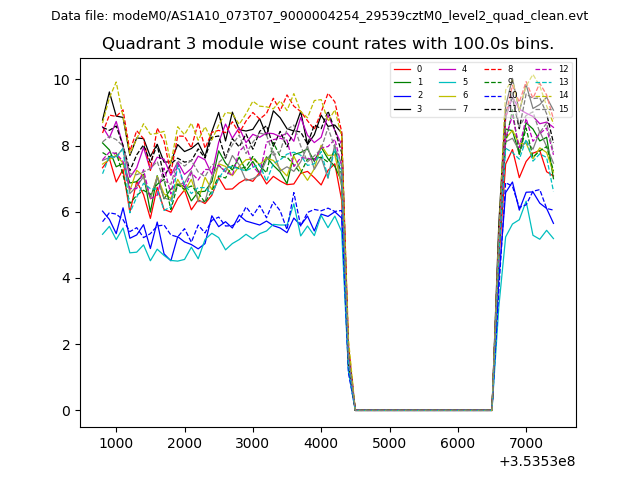
| Module-wise count rates for Quadrant C Data is divided into 100 sec bins |
 |
 |
| Module-wise count rates for Quadrant D Data is divided into 100 sec bins |
 |
 |
| Parameter | Plot |
|---|---|
| CZT HV Monitor | 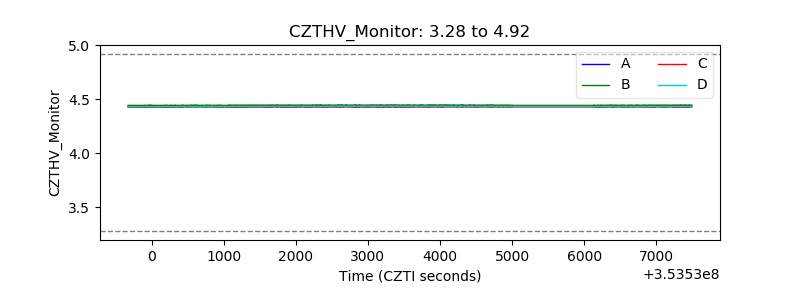 |
| D_VDD | 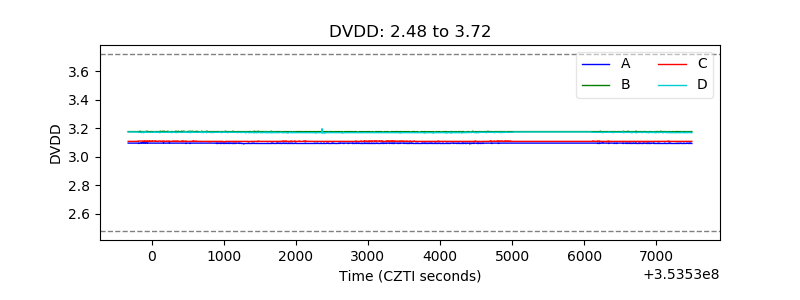 |
| Temperature 1 | 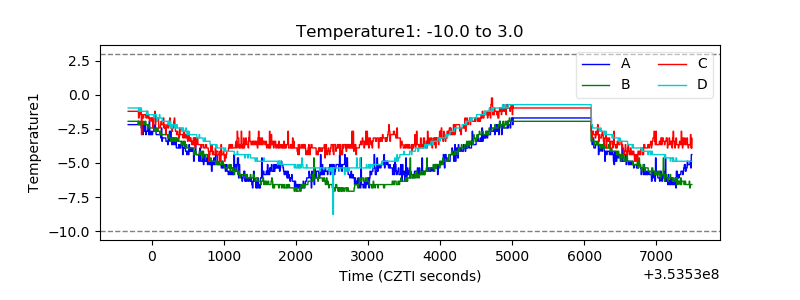 |
| Veto HV Monitor | 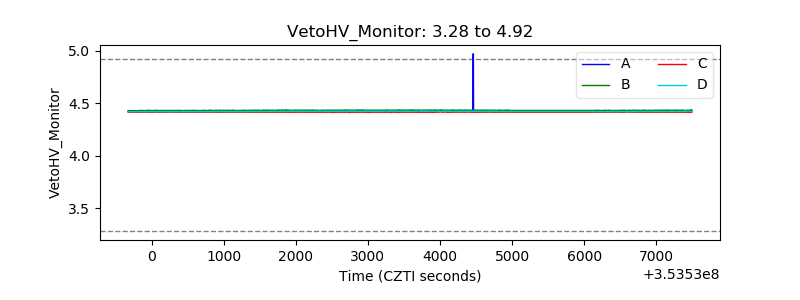 |
| Veto LLD | 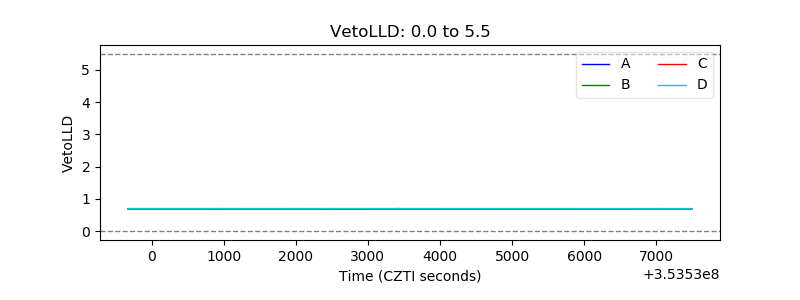 |
| Alpha Counter | 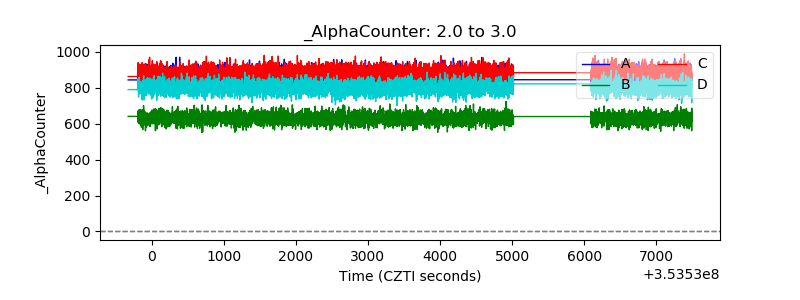 |
| _CPM_Rate | 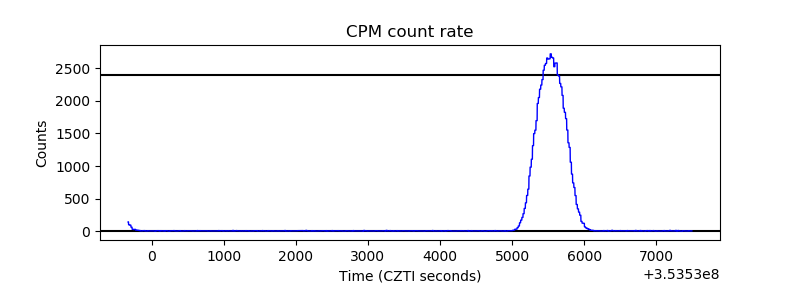 |
| CZT Counter | 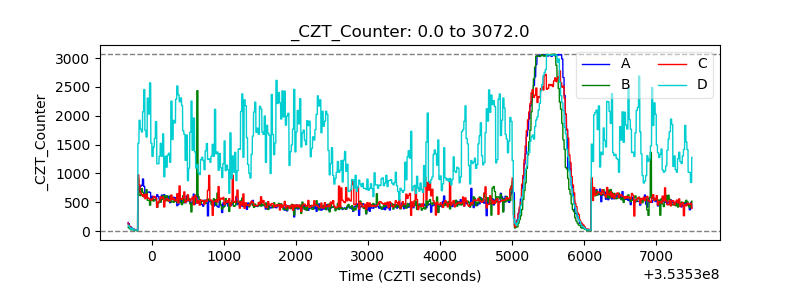 |
| +2.5 Volts monitor |  |
| +5 Volts monitor |  |
| _ROLL_ROT | 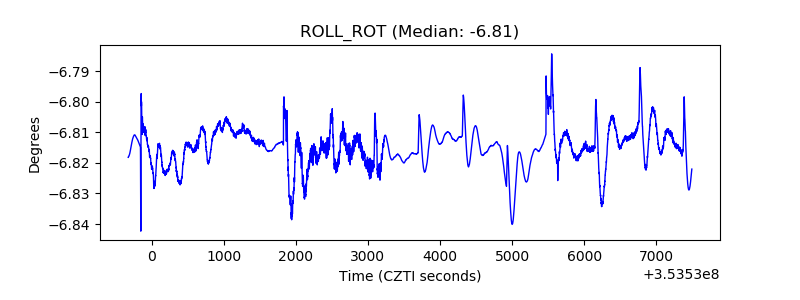 |
| _Roll_DEC | 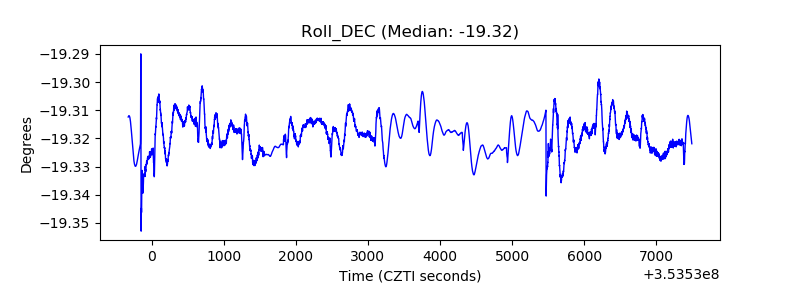 |
| _Roll_RA | 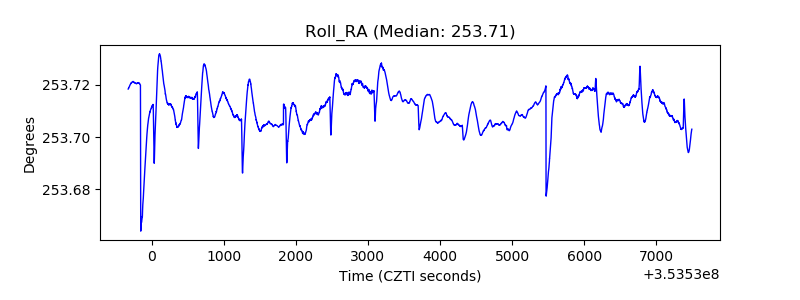 |
| Veto Counter | 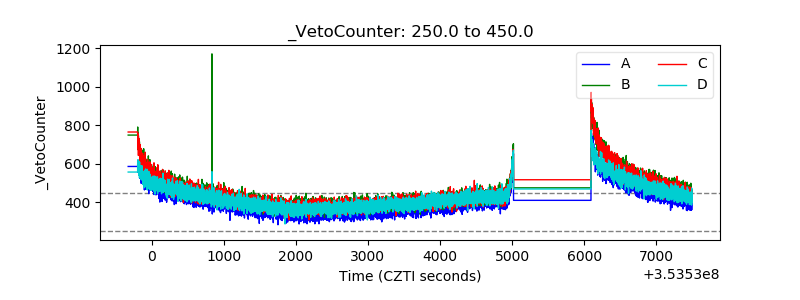 |