| Param | Original file | Final file |
|---|---|---|
| Filename | modeM0/AS1A10_073T07_9000004254_29541cztM0_level2.evt | modeM0/AS1A10_073T07_9000004254_29541cztM0_level2_quad_clean.evt |
| Size (bytes) | 673,488,000 | 103,728,960 |
| Size | 642.3 MB | 98.9 MB |
| Events in quadrant A | 3,349,746 | 682,674 |
| Events in quadrant B | 3,463,945 | 713,964 |
| Events in quadrant C | 3,786,258 | 677,940 |
| Events in quadrant D | 9,349,668 | 605,390 |
| Mode SS | |||
|---|---|---|---|
| Quadrant | BADHDUFLAG | Total packets | Discarded packets |
| A | 0 | 136 | 0 |
| B | 0 | 136 | 0 |
| C | 0 | 136 | 0 |
| D | 0 | 136 | 0 |
| Mode M9 | |||
|---|---|---|---|
| Quadrant | BADHDUFLAG | Total packets | Discarded packets |
| A | 0 | 23 | 0 |
| B | 0 | 23 | 0 |
| C | 0 | 23 | 0 |
| D | 0 | 23 | 0 |
| Mode M0 | |||
|---|---|---|---|
| Quadrant | BADHDUFLAG | Total packets | Discarded packets |
| A | 0 | 14167 | 2 |
| B | 0 | 14542 | 2 |
| C | 0 | 15608 | 2 |
| D | 0 | 32460 | 3 |
| Quadrant | Total seconds | Saturated seconds | Saturation percentage |
|---|---|---|---|
| A | 6616 | 52 | 0.785973% |
| B | 6616 | 65 | 0.982467% |
| C | 6616 | 366 | 5.532044% |
| D | 6616 | 1259 | 19.029625% |
Noise dominated data is calculated using 1-second bins in cleaned event files. If a bin has >2000 counts, and if more than 50% of those come from <1% of pixels, then it is considered to be noise-dominated and hence unusable.
| Quadrant | # 1 sec bins | Bins with >0 counts | Bins with >2000 counts | High rate bins dominated by noise | Noise dominated (total time) | Noise dominated (detector-on time) | Marked lightcurve |
|---|---|---|---|---|---|---|---|
| A | 8891 | 6618 | 0 | 0 | 0.00% | 0.00% |  |
| B | 8891 | 6618 | 0 | 0 | 0.00% | 0.00% | 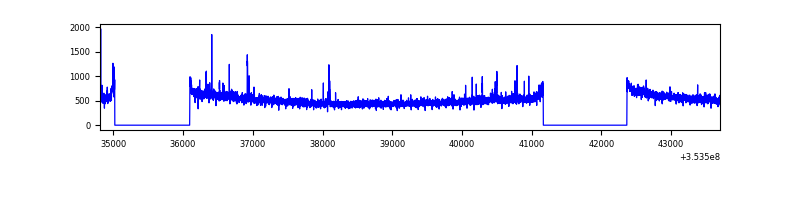 |
| C | 8891 | 6618 | 0 | 0 | 0.00% | 0.00% | 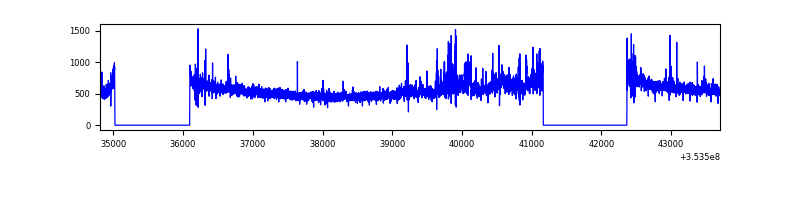 |
| D | 8891 | 6618 | 1082 | 1082 | 12.17% | 16.35% | 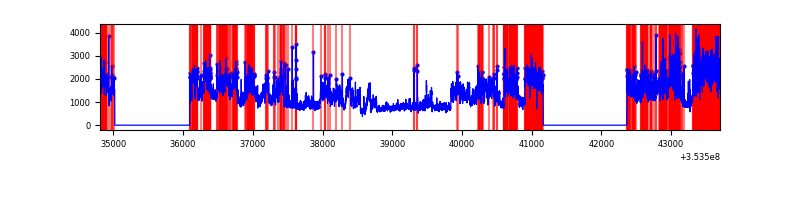 |
Top three noisy pixels from each quadrant. If the there are fewer than three noisy pixels in the level2.evt file, extra rows are filled as -1
| Pixel properties | Quadrant properties | ||||||
|---|---|---|---|---|---|---|---|
| Quadrant | DetID | PixID | Counts | Sigma | Mean | Median | Sigma |
| A | 13 | 254 | 13319 | 71.6 | 865 | 846 | 174.2 |
| A | 0 | 13 | 9860 | 51.75 | 865 | 846 | 174.2 |
| A | 3 | 137 | 8364 | 43.16 | 865 | 846 | 174.2 |
| B | 0 | 190 | 33154 | 195.86 | 869 | 848 | 164.9 |
| B | 12 | 111 | 19956 | 115.84 | 869 | 848 | 164.9 |
| B | 11 | 111 | 18216 | 105.29 | 869 | 848 | 164.9 |
| C | 3 | 233 | 225827 | 1172.8 | 824 | 833 | 191.8 |
| C | 14 | 238 | 214486 | 1113.68 | 824 | 833 | 191.8 |
| C | 14 | 254 | 114811 | 594.12 | 824 | 833 | 191.8 |
| D | 8 | 195 | 4936208 | 26104.32 | 794 | 774 | 189.1 |
| D | 7 | 69 | 863282 | 4561.95 | 794 | 774 | 189.1 |
| D | 7 | 238 | 208224 | 1097.24 | 794 | 774 | 189.1 |
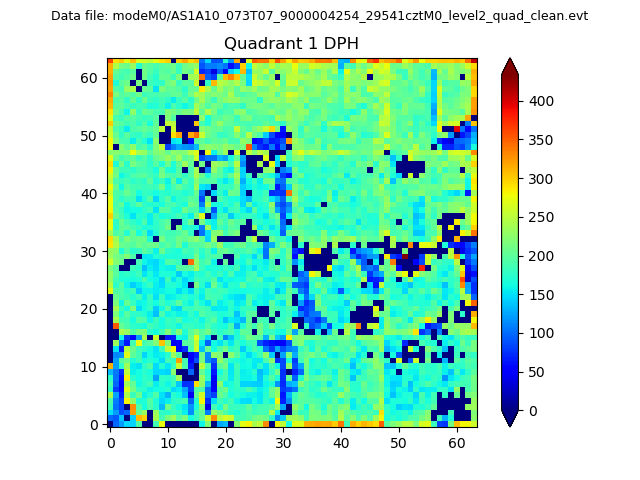
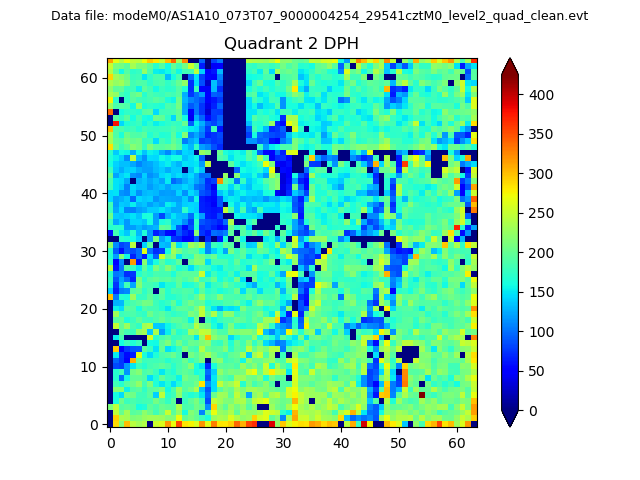
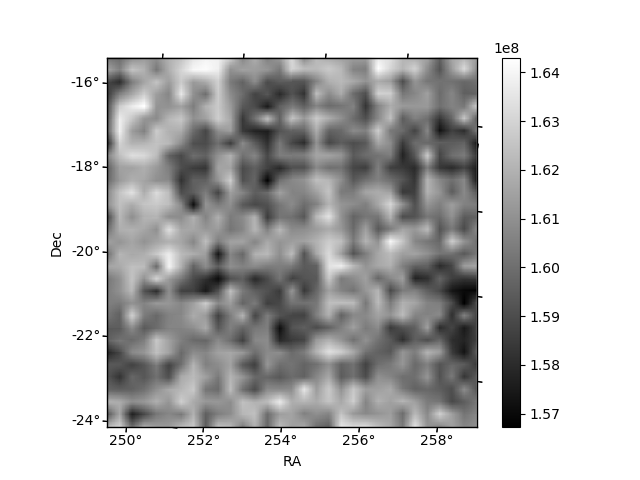
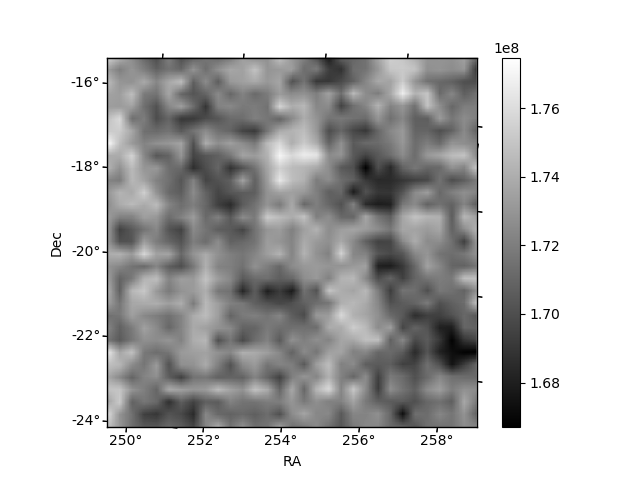
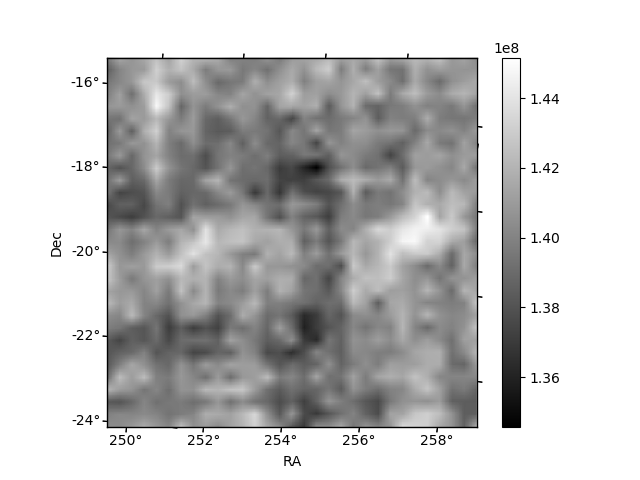
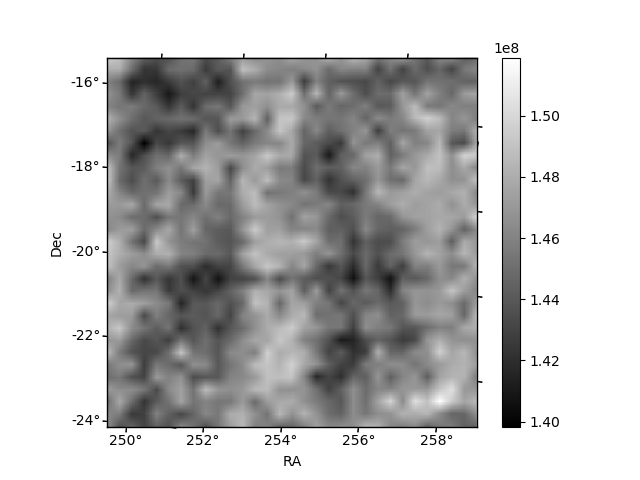
Histogram calculated using DETX and DETY for each event in the final _common_clean file
| Quadrant A | 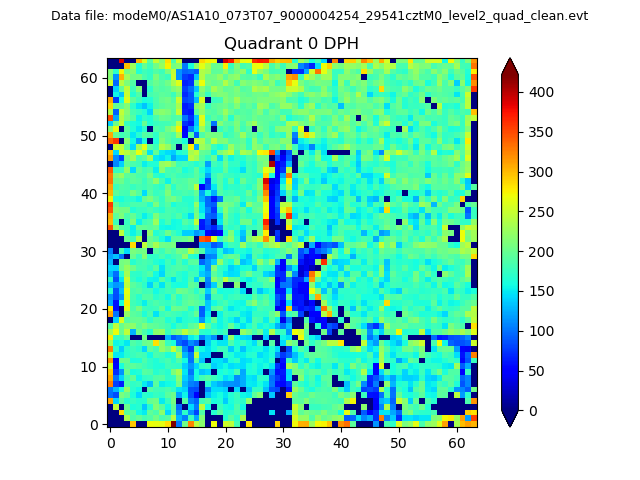 |
 |
Quadrant B |
|---|---|---|---|
| Quadrant D | 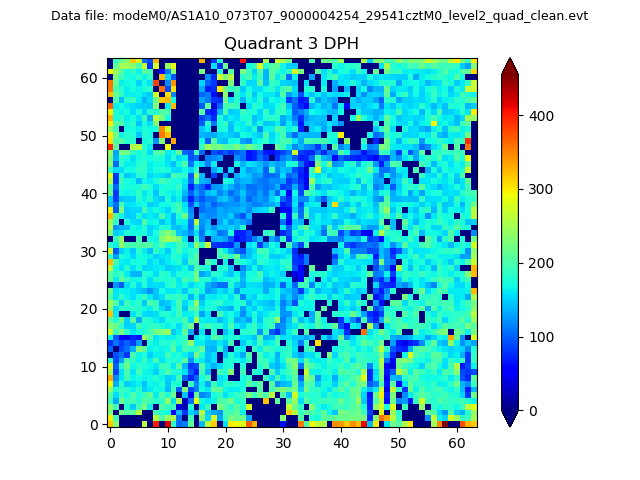 |
 |
Quadrant C |
| Plot type | Count rate plots | Images |
|---|---|---|
| Comparison with Poisson distribution Blue bars denote a histogram of data divided into 1 sec bins. Red curve is a Poisson curve with rate = median count rate of data. |
 |
 |
| Quadrant-wise count rates Data is divided into 100 sec bins |
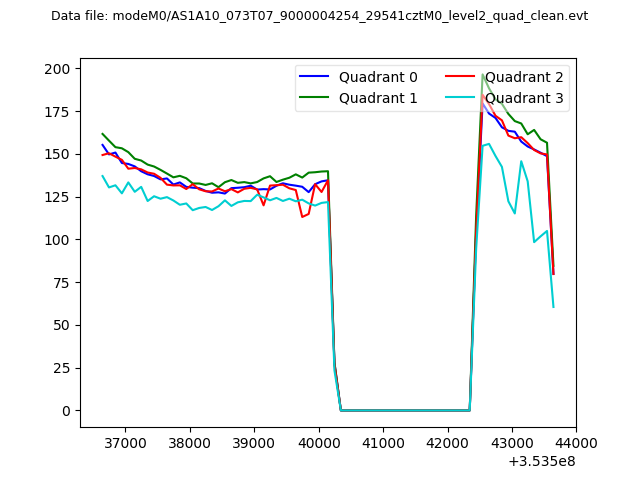 |
|
| Module-wise count rates for Quadrant A Data is divided into 100 sec bins |
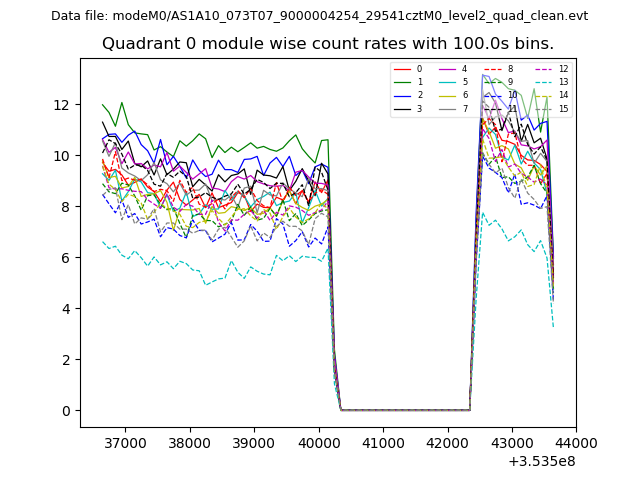 |
 |
| Module-wise count rates for Quadrant B Data is divided into 100 sec bins |
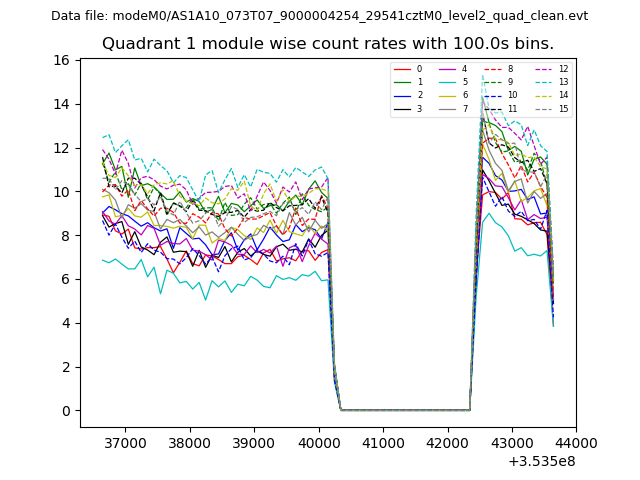 |
 |
| Module-wise count rates for Quadrant C Data is divided into 100 sec bins |
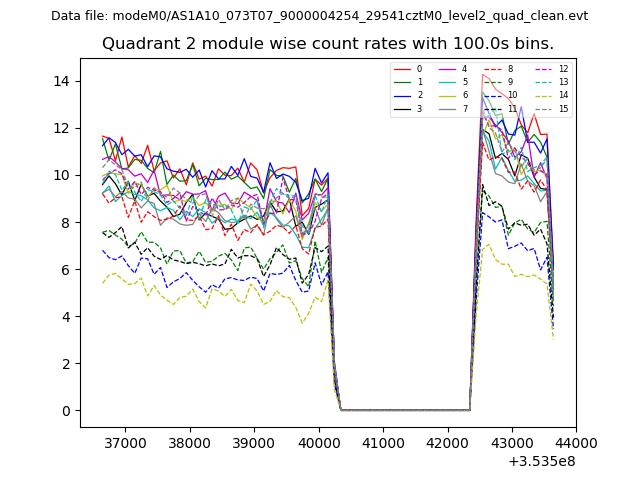 |
 |
| Module-wise count rates for Quadrant D Data is divided into 100 sec bins |
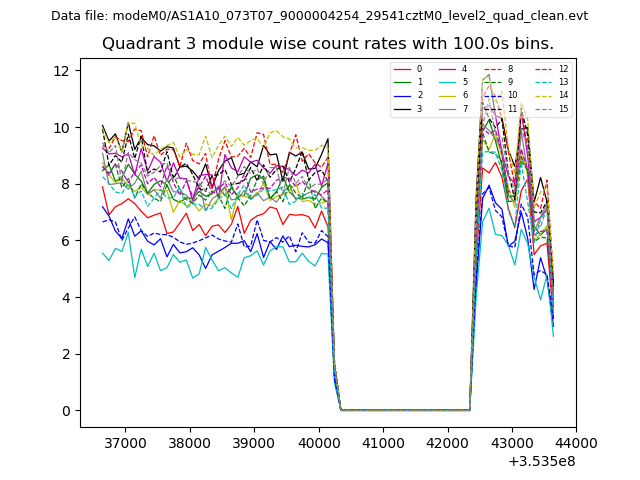 |
 |
| Parameter | Plot |
|---|---|
| CZT HV Monitor | 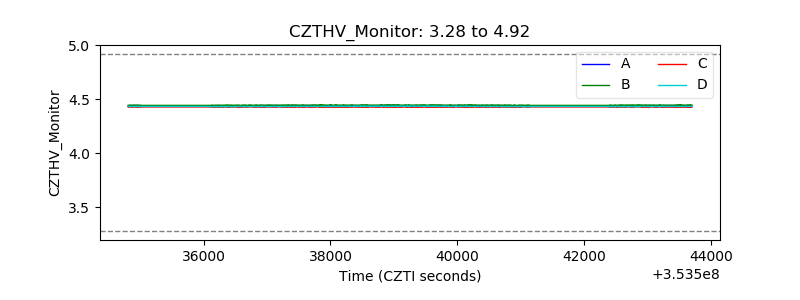 |
| D_VDD |  |
| Temperature 1 | 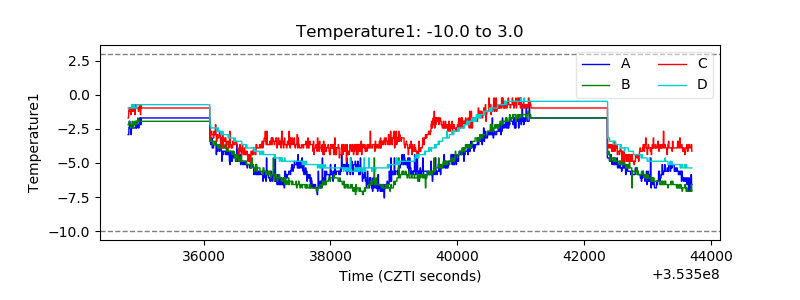 |
| Veto HV Monitor |  |
| Veto LLD | 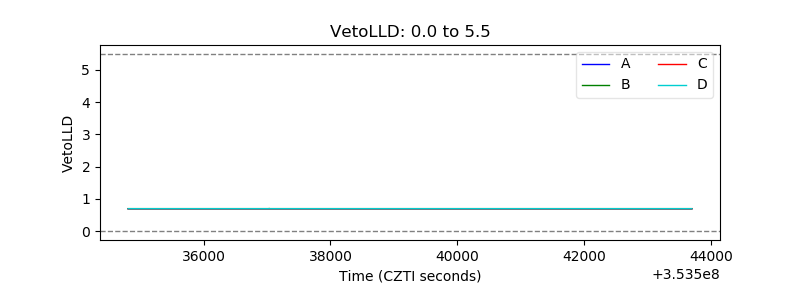 |
| Alpha Counter | 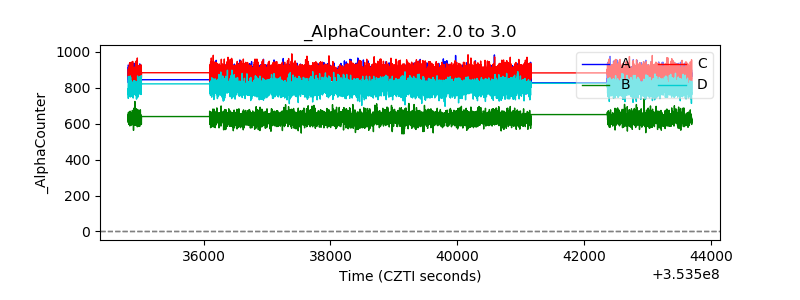 |
| _CPM_Rate | 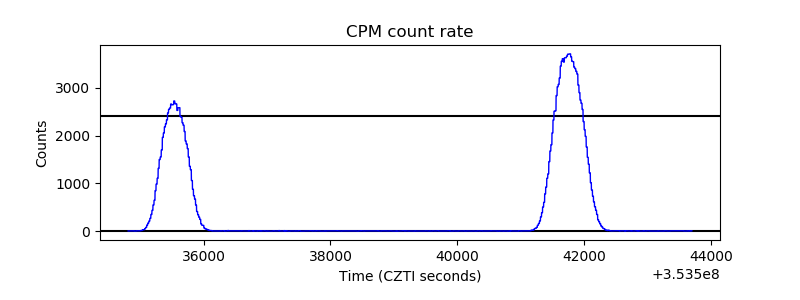 |
| CZT Counter |  |
| +2.5 Volts monitor |  |
| +5 Volts monitor |  |
| _ROLL_ROT | 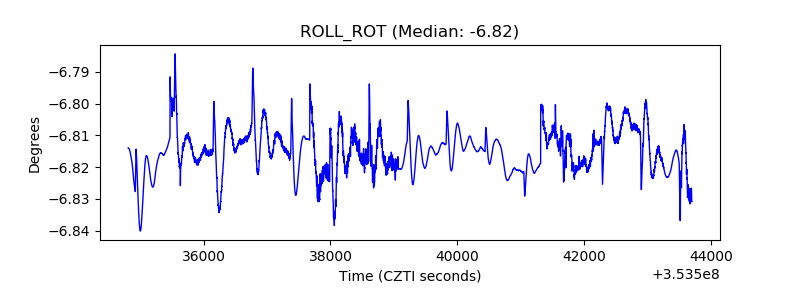 |
| _Roll_DEC | 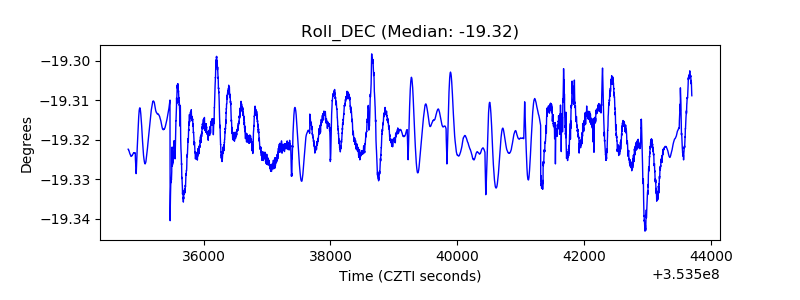 |
| _Roll_RA |  |
| Veto Counter | 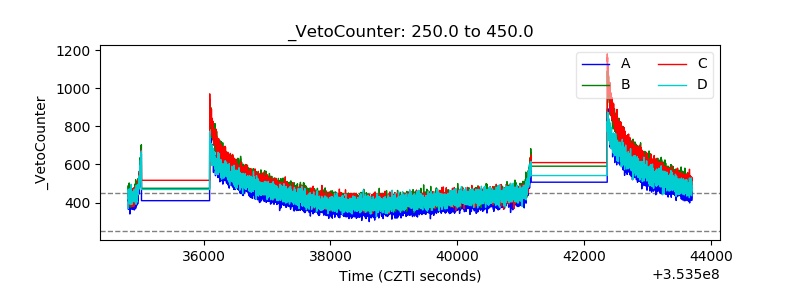 |