| Param | Original file | Final file |
|---|---|---|
| Filename | modeM0/AS1A10_073T07_9000004254_29542cztM0_level2.evt | modeM0/AS1A10_073T07_9000004254_29542cztM0_level2_quad_clean.evt |
| Size (bytes) | 668,177,280 | 112,144,320 |
| Size | 637.2 MB | 106.9 MB |
| Events in quadrant A | 3,271,456 | 751,941 |
| Events in quadrant B | 3,408,137 | 795,314 |
| Events in quadrant C | 3,620,017 | 754,695 |
| Events in quadrant D | 9,512,551 | 656,226 |
| Mode SS | |||
|---|---|---|---|
| Quadrant | BADHDUFLAG | Total packets | Discarded packets |
| A | 0 | 128 | 0 |
| B | 0 | 128 | 0 |
| C | 0 | 128 | 0 |
| D | 0 | 128 | 0 |
| Mode M9 | |||
|---|---|---|---|
| Quadrant | BADHDUFLAG | Total packets | Discarded packets |
| A | 0 | 14 | 0 |
| B | 0 | 15 | 0 |
| C | 0 | 15 | 0 |
| D | 0 | 15 | 0 |
| Mode M0 | |||
|---|---|---|---|
| Quadrant | BADHDUFLAG | Total packets | Discarded packets |
| A | 0 | 13621 | 2 |
| B | 0 | 14088 | 2 |
| C | 0 | 14773 | 3 |
| D | 0 | 32632 | 2 |
| Quadrant | Total seconds | Saturated seconds | Saturation percentage |
|---|---|---|---|
| A | 6275 | 49 | 0.780876% |
| B | 6275 | 62 | 0.988048% |
| C | 6274 | 260 | 4.144087% |
| D | 6274 | 1132 | 18.042716% |
Noise dominated data is calculated using 1-second bins in cleaned event files. If a bin has >2000 counts, and if more than 50% of those come from <1% of pixels, then it is considered to be noise-dominated and hence unusable.
| Quadrant | # 1 sec bins | Bins with >0 counts | Bins with >2000 counts | High rate bins dominated by noise | Noise dominated (total time) | Noise dominated (detector-on time) | Marked lightcurve |
|---|---|---|---|---|---|---|---|
| A | 7565 | 6276 | 5 | 5 | 0.07% | 0.08% | 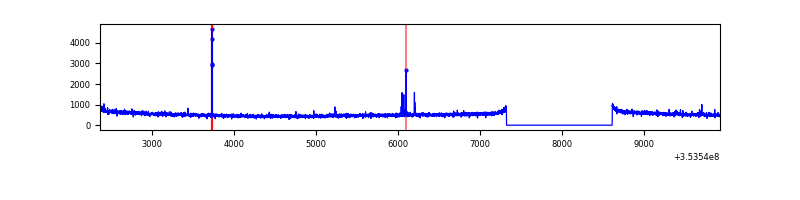 |
| B | 7565 | 6276 | 8 | 8 | 0.11% | 0.13% | 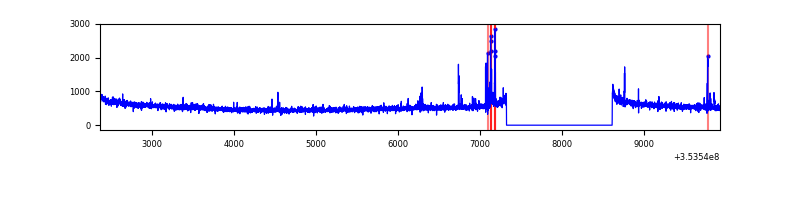 |
| C | 7564 | 6275 | 0 | 0 | 0.00% | 0.00% | 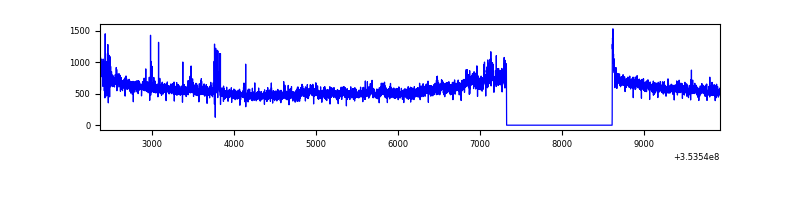 |
| D | 7564 | 6274 | 1088 | 1088 | 14.38% | 17.34% | 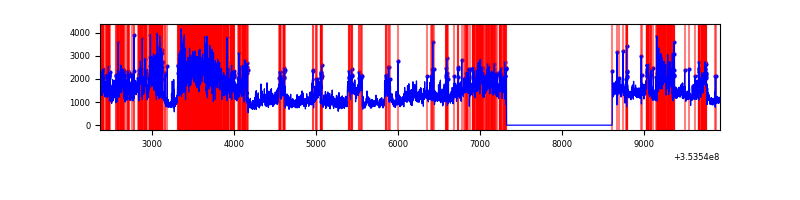 |
Top three noisy pixels from each quadrant. If the there are fewer than three noisy pixels in the level2.evt file, extra rows are filled as -1
| Pixel properties | Quadrant properties | ||||||
|---|---|---|---|---|---|---|---|
| Quadrant | DetID | PixID | Counts | Sigma | Mean | Median | Sigma |
| A | 0 | 13 | 33962 | 198.23 | 836 | 820 | 167.2 |
| A | 13 | 254 | 12452 | 69.58 | 836 | 820 | 167.2 |
| A | 3 | 137 | 7857 | 42.09 | 836 | 820 | 167.2 |
| B | 5 | 255 | 44313 | 275.17 | 848 | 829 | 158.0 |
| B | 12 | 111 | 18749 | 113.4 | 848 | 829 | 158.0 |
| B | 0 | 230 | 17700 | 106.76 | 848 | 829 | 158.0 |
| C | 3 | 233 | 217166 | 1150.69 | 808 | 816 | 188.0 |
| C | 14 | 238 | 174615 | 924.38 | 808 | 816 | 188.0 |
| C | 14 | 254 | 67293 | 353.57 | 808 | 816 | 188.0 |
| D | 8 | 195 | 3867204 | 20849.21 | 775 | 755 | 185.4 |
| D | 7 | 69 | 2065341 | 11132.95 | 775 | 755 | 185.4 |
| D | 7 | 238 | 277820 | 1494.03 | 775 | 755 | 185.4 |
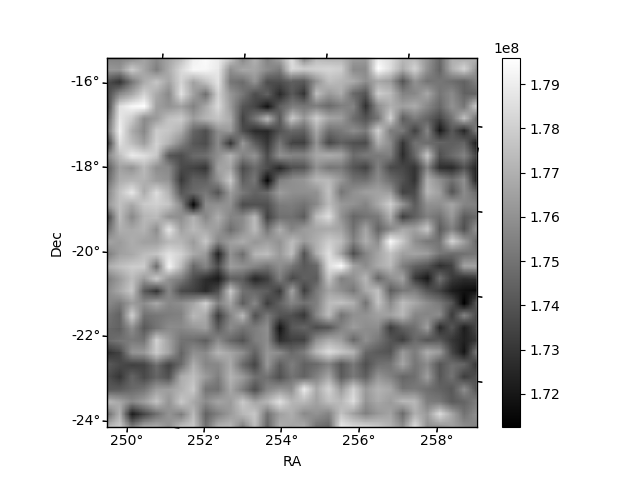
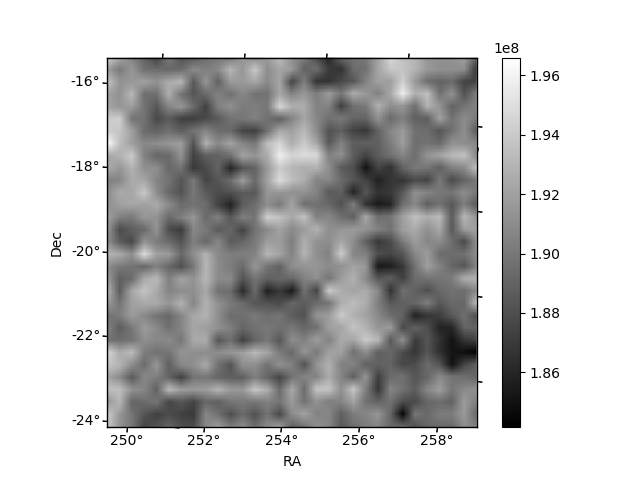
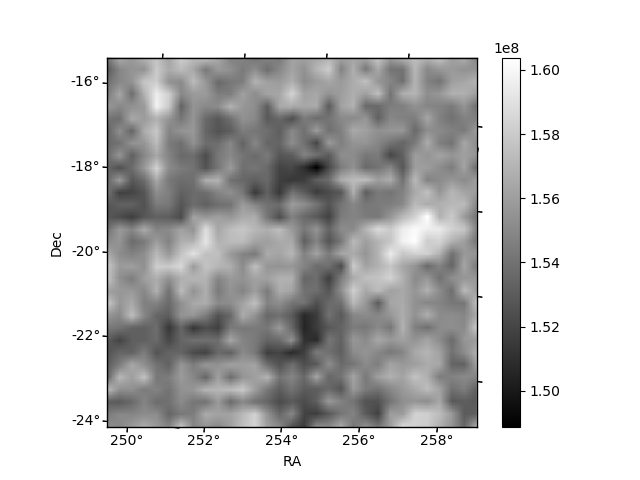
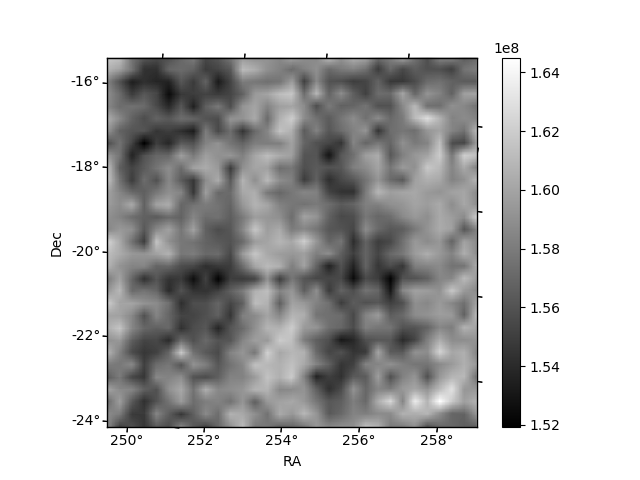
Histogram calculated using DETX and DETY for each event in the final _common_clean file
| Quadrant A | 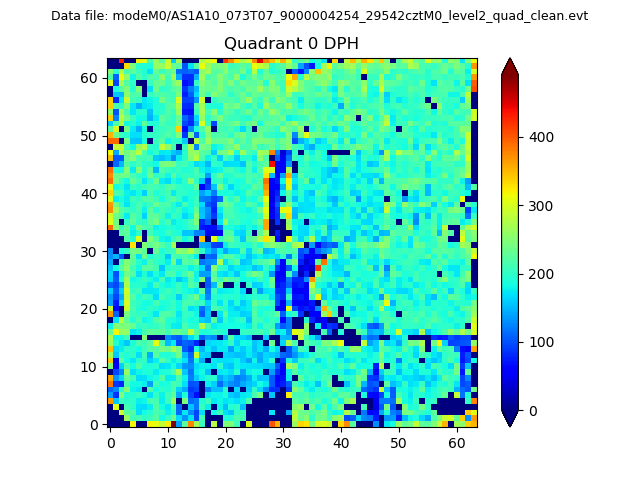 |
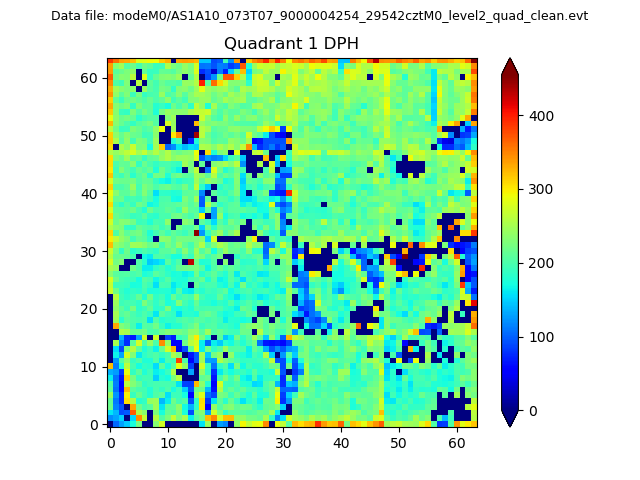 |
Quadrant B |
|---|---|---|---|
| Quadrant D | 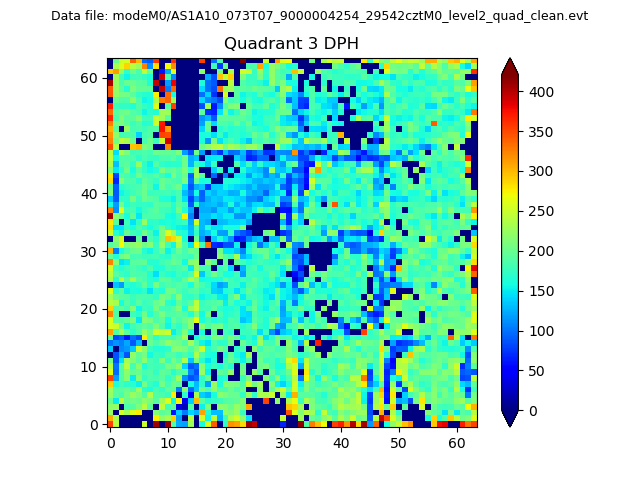 |
 |
Quadrant C |
| Plot type | Count rate plots | Images |
|---|---|---|
| Comparison with Poisson distribution Blue bars denote a histogram of data divided into 1 sec bins. Red curve is a Poisson curve with rate = median count rate of data. |
 |
 |
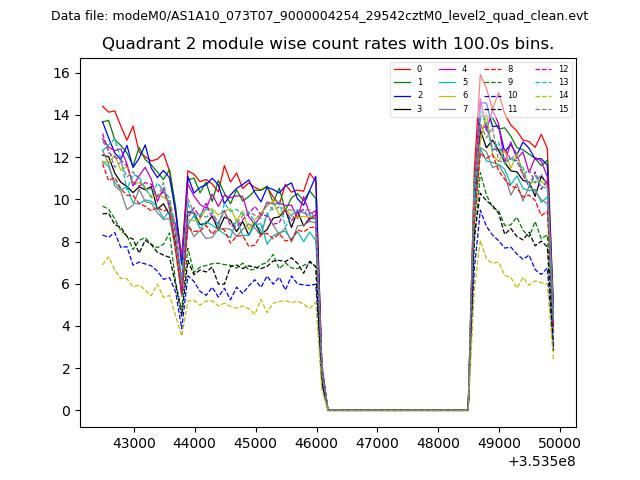
| Quadrant-wise count rates Data is divided into 100 sec bins |
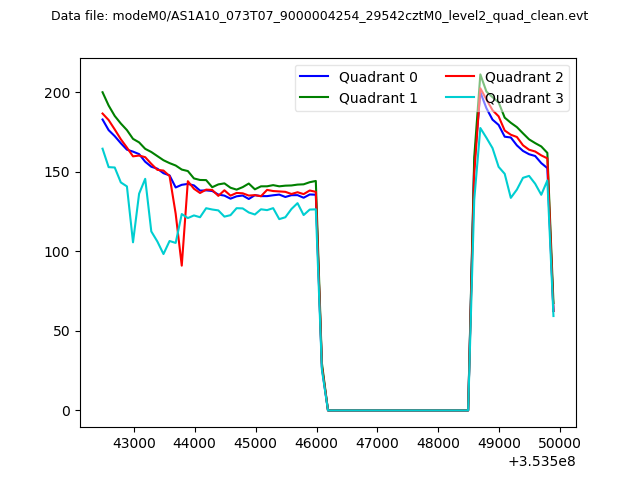 |
|
| Module-wise count rates for Quadrant A Data is divided into 100 sec bins |
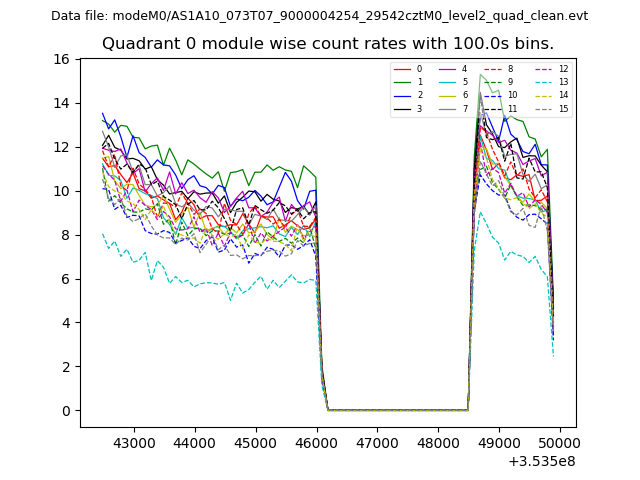 |
 |
| Module-wise count rates for Quadrant B Data is divided into 100 sec bins |
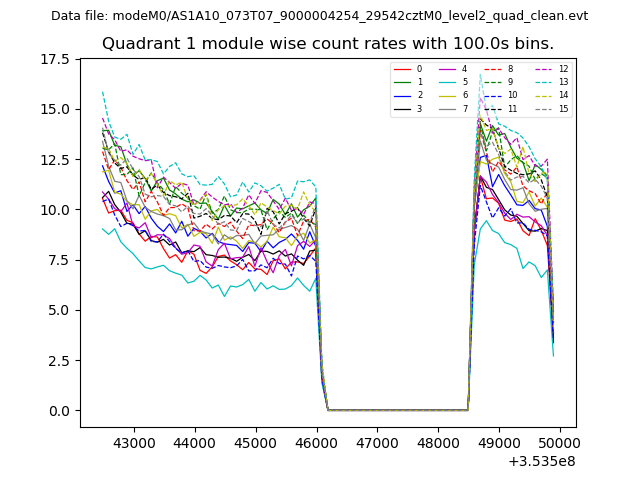 |
 |
| Module-wise count rates for Quadrant C Data is divided into 100 sec bins |
 |
 |
| Module-wise count rates for Quadrant D Data is divided into 100 sec bins |
 |
 |
| Parameter | Plot |
|---|---|
| CZT HV Monitor | 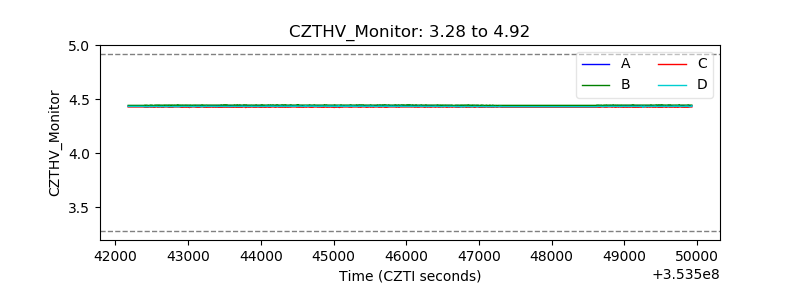 |
| D_VDD | 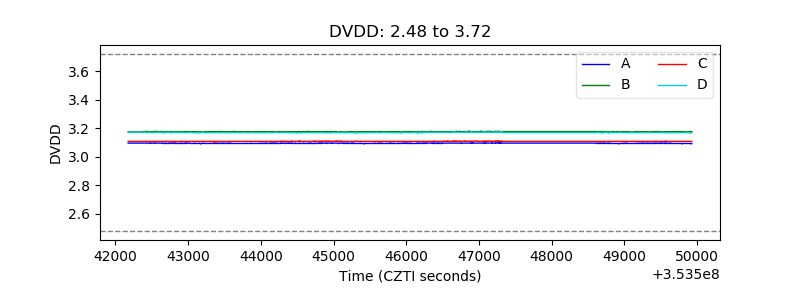 |
| Temperature 1 | 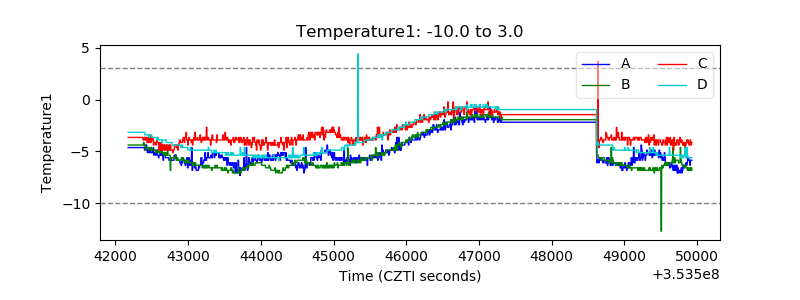 |
| Veto HV Monitor |  |
| Veto LLD | 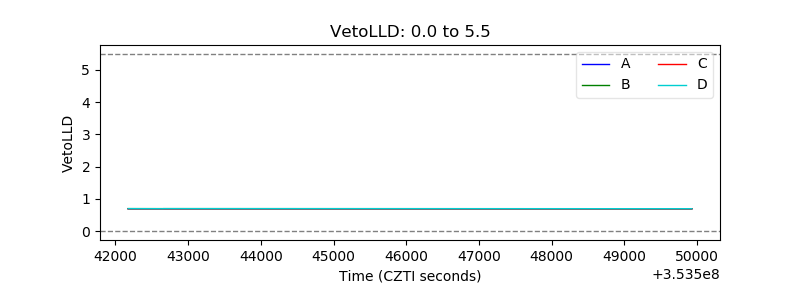 |
| Alpha Counter | 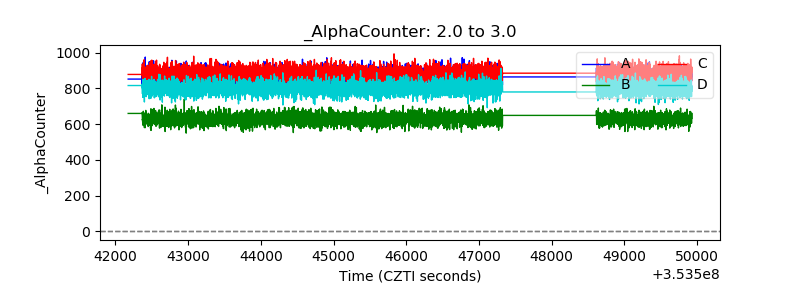 |
| _CPM_Rate | 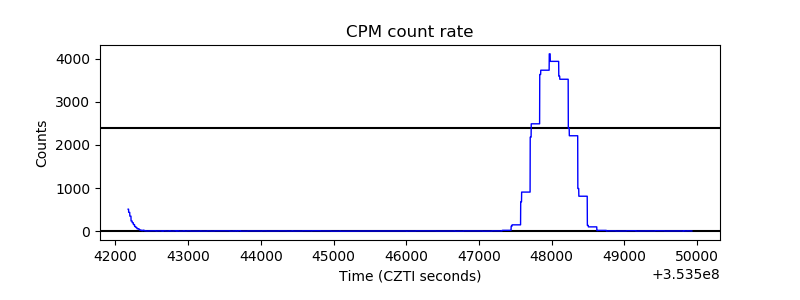 |
| CZT Counter | 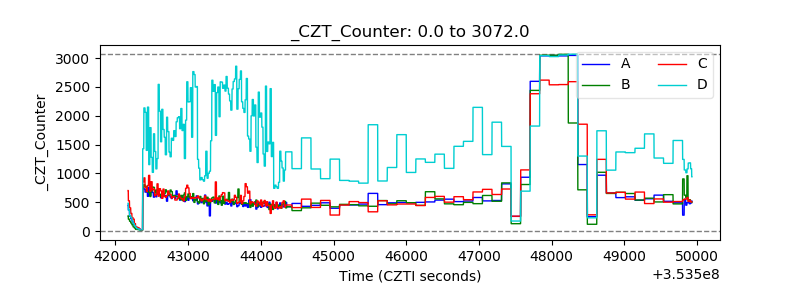 |
| +2.5 Volts monitor | 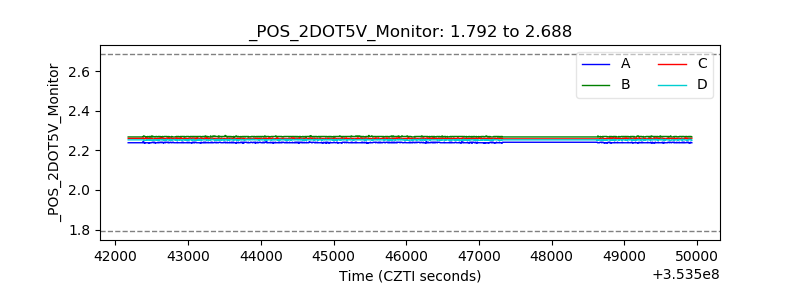 |
| +5 Volts monitor |  |
| _ROLL_ROT | 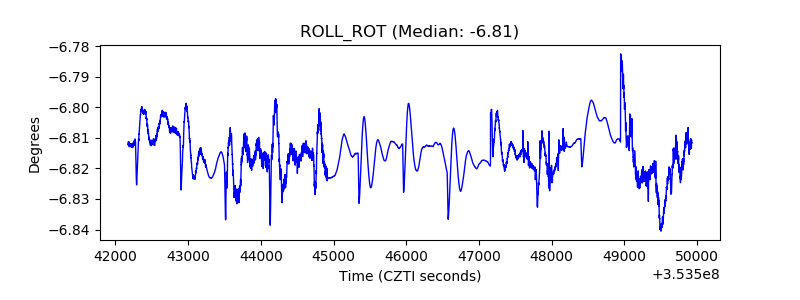 |
| _Roll_DEC | 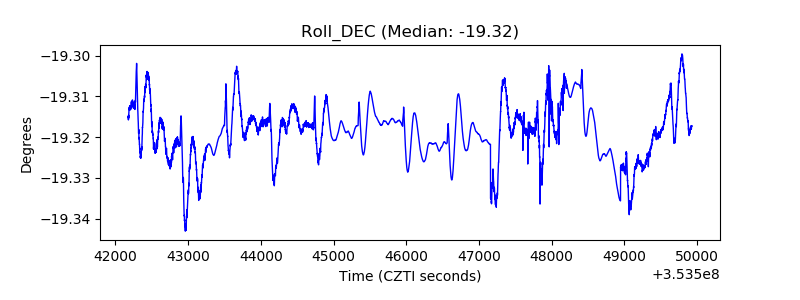 |
| _Roll_RA | 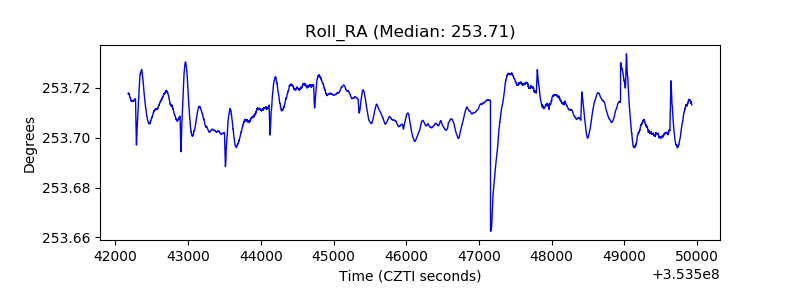 |
| Veto Counter | 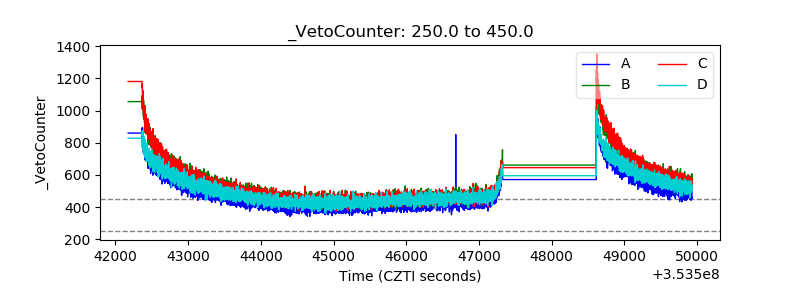 |