| Param | Original file | Final file |
|---|---|---|
| Filename | modeM0/AS1A10_073T07_9000004254_29549cztM0_level2.evt | modeM0/AS1A10_073T07_9000004254_29549cztM0_level2_quad_clean.evt |
| Size (bytes) | 380,321,280 | 34,384,320 |
| Size | 362.7 MB | 32.8 MB |
| Events in quadrant A | 1,793,175 | 197,649 |
| Events in quadrant B | 1,834,703 | 204,576 |
| Events in quadrant C | 2,007,285 | 191,272 |
| Events in quadrant D | 5,624,945 | 178,899 |
| Mode SS | |||
|---|---|---|---|
| Quadrant | BADHDUFLAG | Total packets | Discarded packets |
| A | 0 | 76 | 0 |
| B | 0 | 76 | 0 |
| C | 0 | 76 | 0 |
| D | 0 | 76 | 0 |
| Mode M0 | |||
|---|---|---|---|
| Quadrant | BADHDUFLAG | Total packets | Discarded packets |
| A | 0 | 7749 | 0 |
| B | 0 | 7869 | 0 |
| C | 0 | 8275 | 0 |
| D | 0 | 19353 | 0 |
| Quadrant | Total seconds | Saturated seconds | Saturation percentage |
|---|---|---|---|
| A | 3792 | 4 | 0.105485% |
| B | 3793 | 13 | 0.342737% |
| C | 3793 | 270 | 7.118376% |
| D | 3793 | 603 | 15.897706% |
Noise dominated data is calculated using 1-second bins in cleaned event files. If a bin has >2000 counts, and if more than 50% of those come from <1% of pixels, then it is considered to be noise-dominated and hence unusable.
| Quadrant | # 1 sec bins | Bins with >0 counts | Bins with >2000 counts | High rate bins dominated by noise | Noise dominated (total time) | Noise dominated (detector-on time) | Marked lightcurve |
|---|---|---|---|---|---|---|---|
| A | 3792 | 3792 | 0 | 0 | 0.00% | 0.00% |  |
| B | 3793 | 3793 | 9 | 9 | 0.24% | 0.24% |  |
| C | 3793 | 3793 | 0 | 0 | 0.00% | 0.00% | 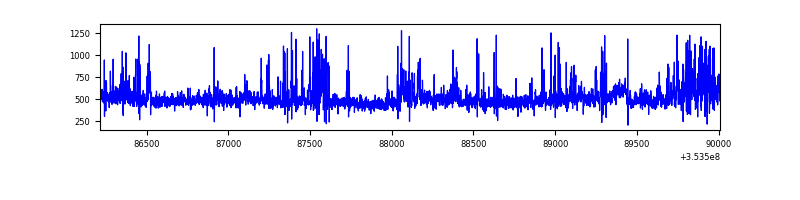 |
| D | 3793 | 3793 | 629 | 629 | 16.58% | 16.58% |  |
Top three noisy pixels from each quadrant. If the there are fewer than three noisy pixels in the level2.evt file, extra rows are filled as -1
| Pixel properties | Quadrant properties | ||||||
|---|---|---|---|---|---|---|---|
| Quadrant | DetID | PixID | Counts | Sigma | Mean | Median | Sigma |
| A | 0 | 13 | 66516 | 712.11 | 447 | 437 | 92.8 |
| A | 13 | 254 | 7597 | 77.16 | 447 | 437 | 92.8 |
| A | 3 | 137 | 4531 | 44.12 | 447 | 437 | 92.8 |
| B | 5 | 255 | 60172 | 692.03 | 440 | 429 | 86.3 |
| B | 0 | 156 | 24292 | 276.42 | 440 | 429 | 86.3 |
| B | 0 | 190 | 17654 | 199.53 | 440 | 429 | 86.3 |
| C | 14 | 238 | 158776 | 1594.06 | 419 | 422 | 99.3 |
| C | 14 | 254 | 130387 | 1308.28 | 419 | 422 | 99.3 |
| C | 7 | 247 | 57681 | 576.39 | 419 | 422 | 99.3 |
| D | 8 | 195 | 3344272 | 33251.26 | 416 | 405 | 100.6 |
| D | 7 | 80 | 322065 | 3198.57 | 416 | 405 | 100.6 |
| D | 7 | 69 | 150669 | 1494.22 | 416 | 405 | 100.6 |
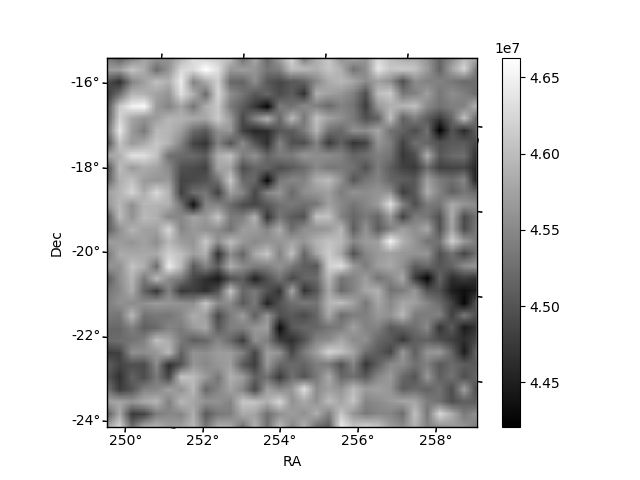
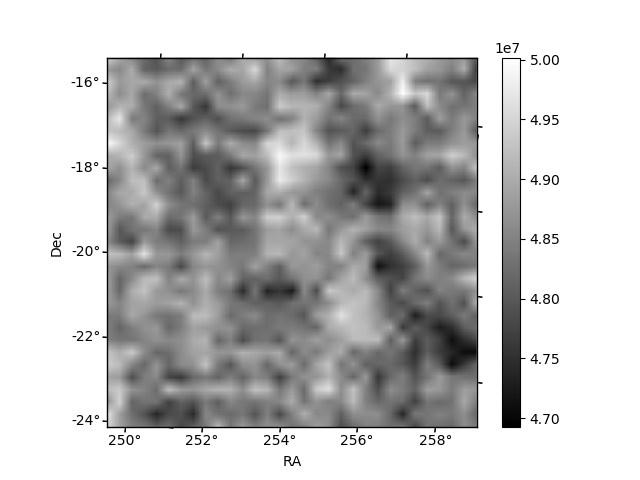
Histogram calculated using DETX and DETY for each event in the final _common_clean file
| Quadrant A | 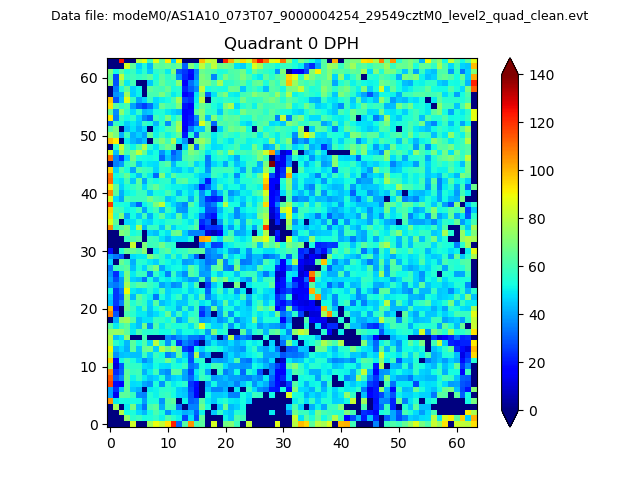 |
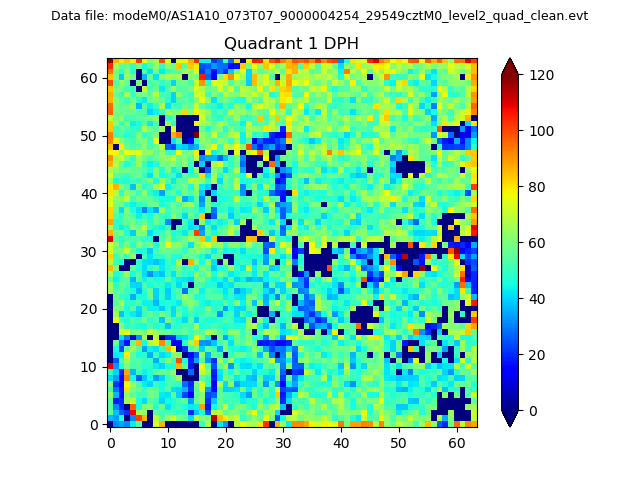 |
Quadrant B |
|---|---|---|---|
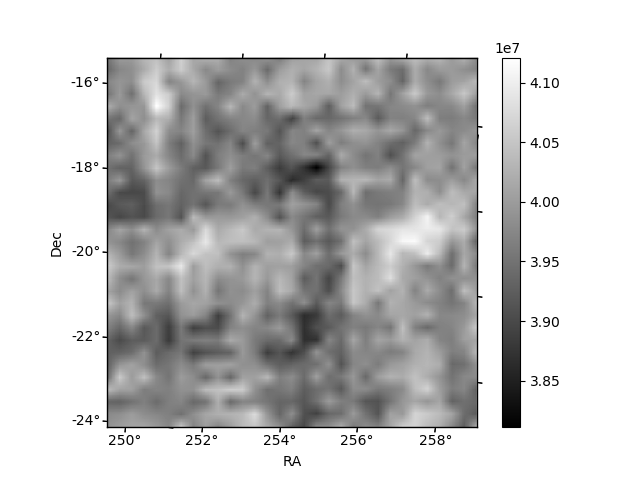
| Quadrant D | 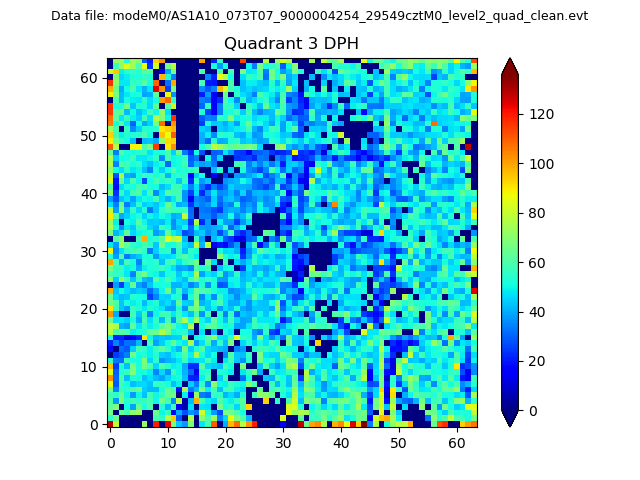 |
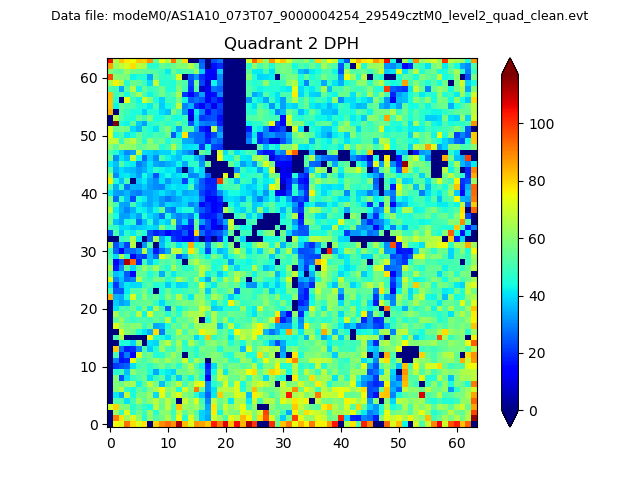 |
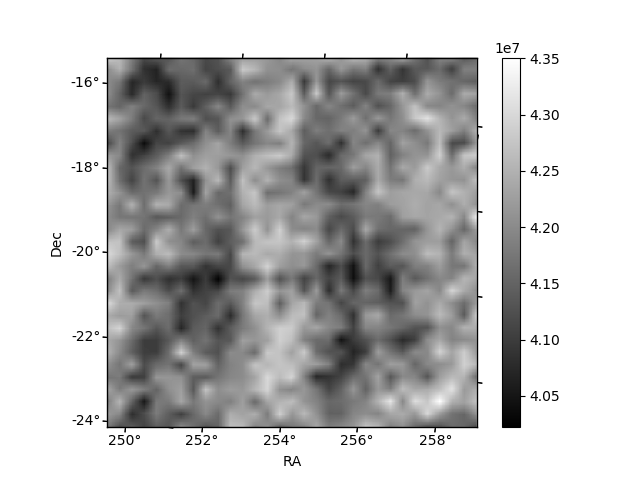
Quadrant C |
| Plot type | Count rate plots | Images |
|---|---|---|
| Comparison with Poisson distribution Blue bars denote a histogram of data divided into 1 sec bins. Red curve is a Poisson curve with rate = median count rate of data. |
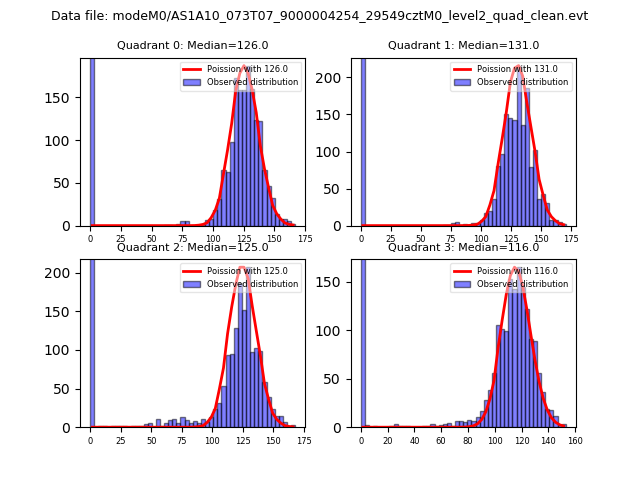 |
 |
| Quadrant-wise count rates Data is divided into 100 sec bins |
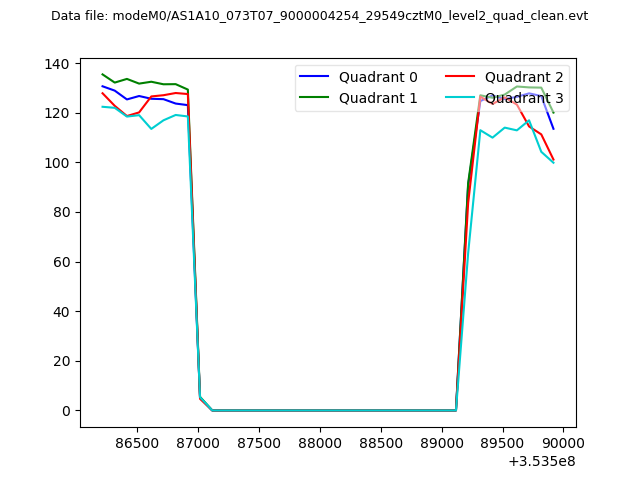 |
|
| Module-wise count rates for Quadrant A Data is divided into 100 sec bins |
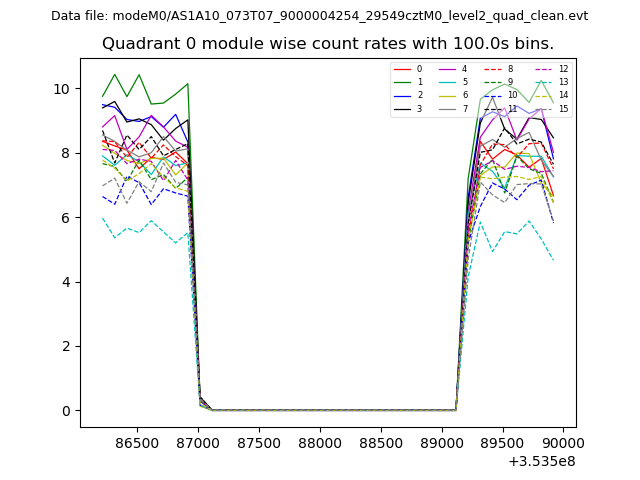 |
 |
| Module-wise count rates for Quadrant B Data is divided into 100 sec bins |
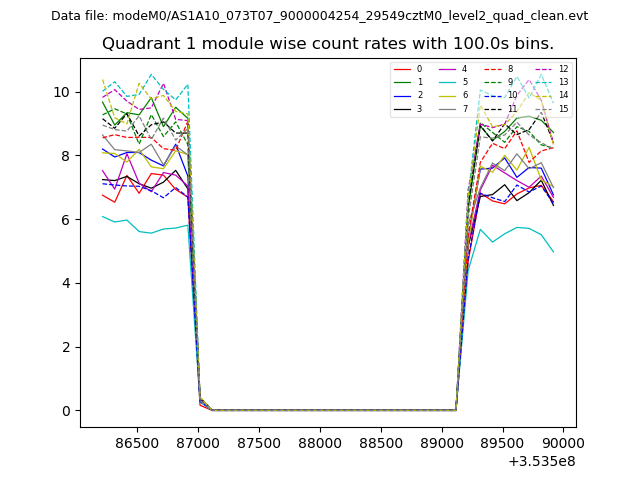 |
 |
| Module-wise count rates for Quadrant C Data is divided into 100 sec bins |
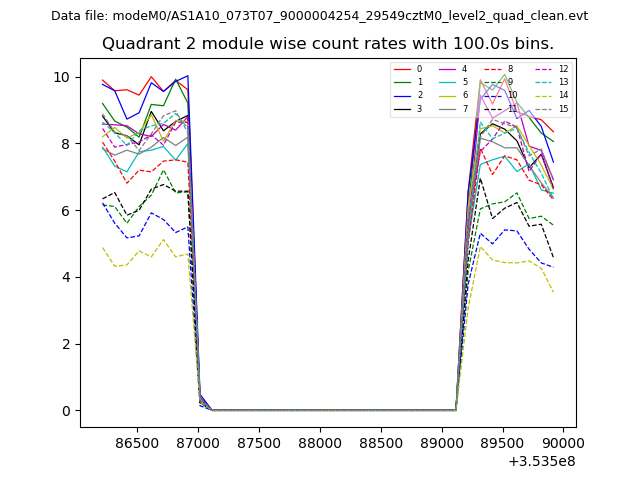 |
 |
| Module-wise count rates for Quadrant D Data is divided into 100 sec bins |
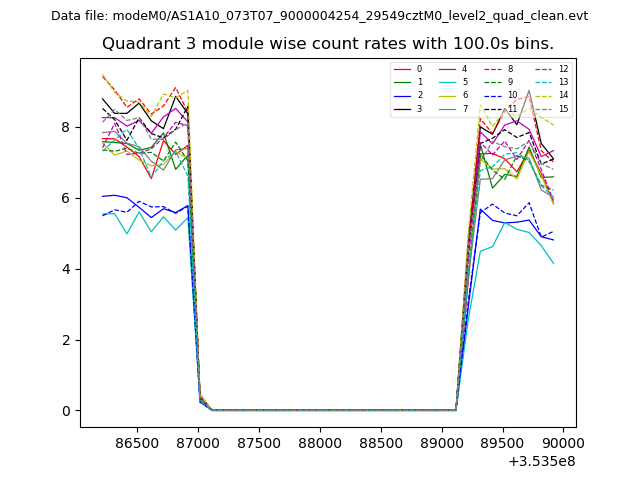 |
 |
| Parameter | Plot |
|---|---|
| CZT HV Monitor | 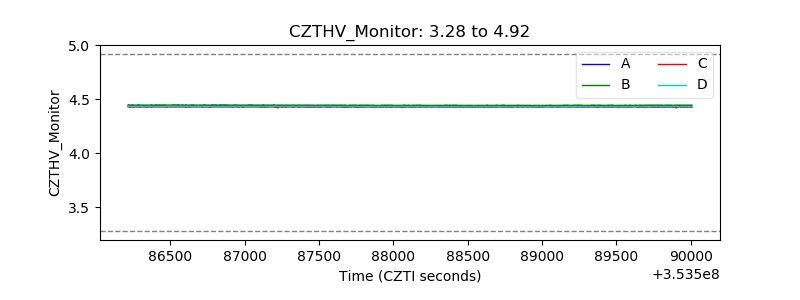 |
| D_VDD | 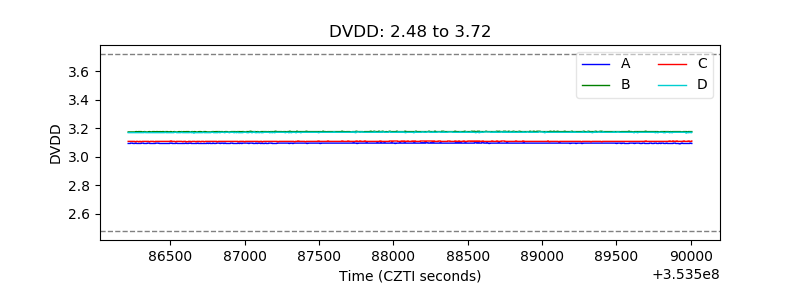 |
| Temperature 1 | 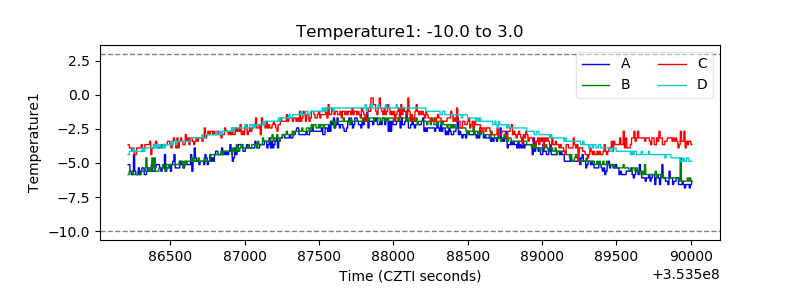 |
| Veto HV Monitor | 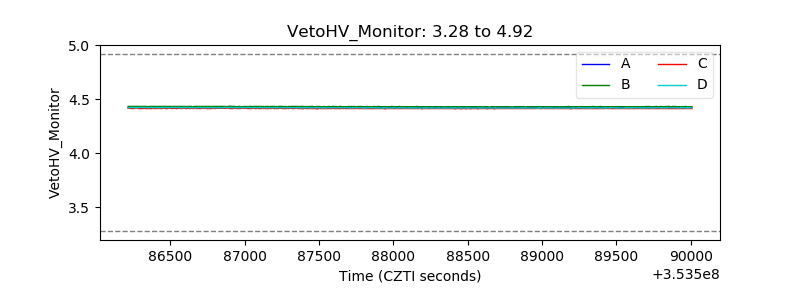 |
| Veto LLD | 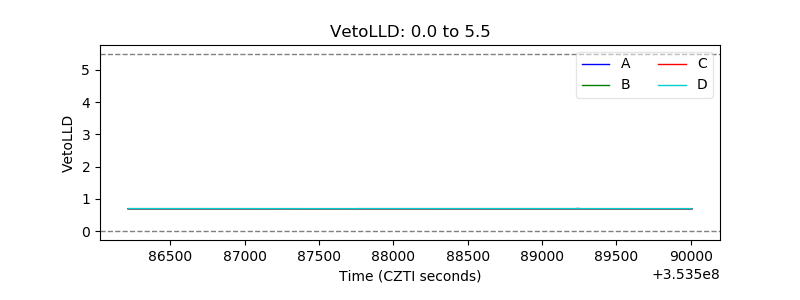 |
| Alpha Counter | 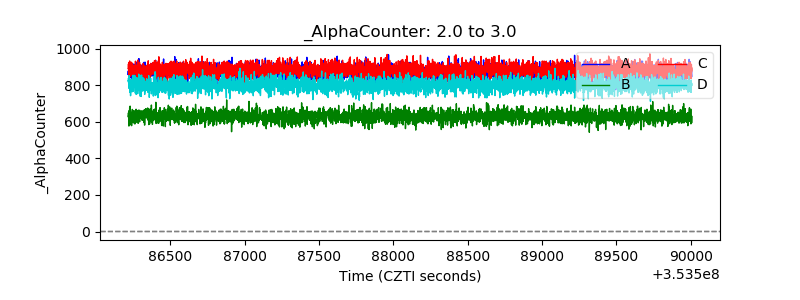 |
| _CPM_Rate | 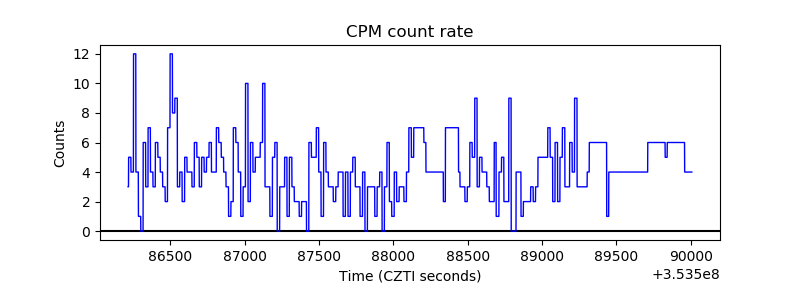 |
| CZT Counter | 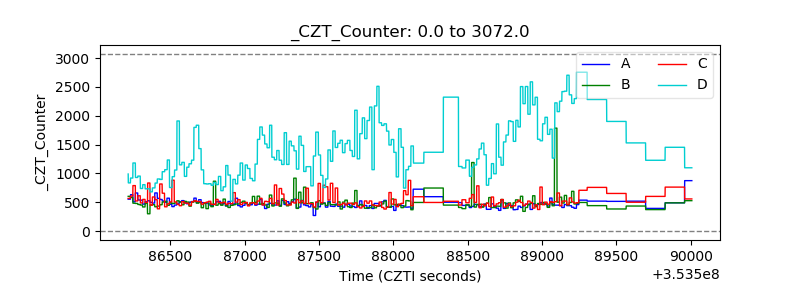 |
| +2.5 Volts monitor |  |
| +5 Volts monitor |  |
| _ROLL_ROT | 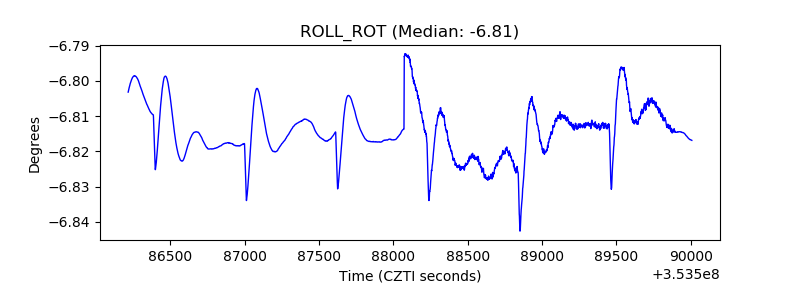 |
| _Roll_DEC | 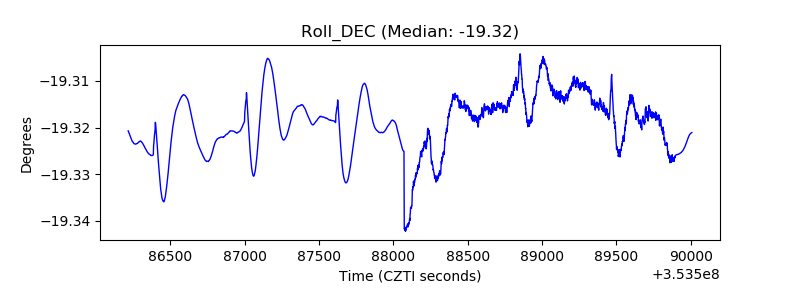 |
| _Roll_RA | 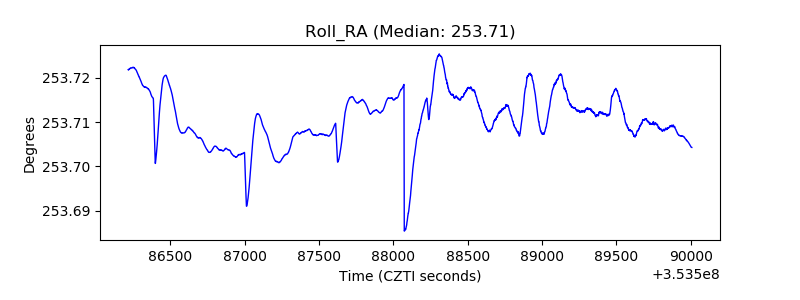 |
| Veto Counter | 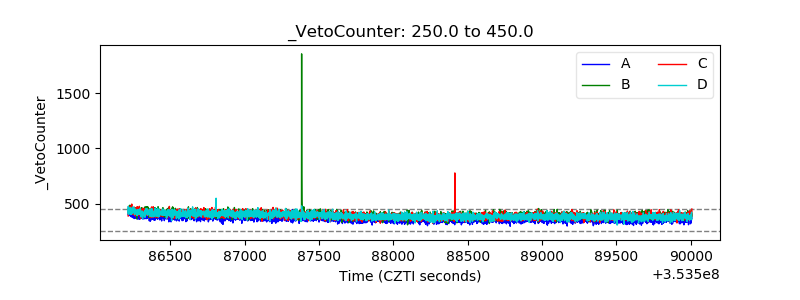 |