| Param | Original file | Final file |
|---|---|---|
| Filename | modeM0/AS1A10_073T07_9000004254_29725cztM0_level2.evt | modeM0/AS1A10_073T07_9000004254_29725cztM0_level2_quad_clean.evt |
| Size (bytes) | 1,589,760 | 650,880 |
| Size | 1.5 MB | 635.6 KB |
| Events in quadrant A | 12,605 | 3,400 |
| Events in quadrant B | 11,280 | 1,799 |
| Events in quadrant C | 11,960 | 3,049 |
| Events in quadrant D | 7,086 | 1,013 |
| Mode SS | |||
|---|---|---|---|
| Quadrant | BADHDUFLAG | Total packets | Discarded packets |
| A | 0 | 36 | 34 |
| B | 0 | 28 | 28 |
| C | 0 | 30 | 30 |
| D | 0 | 35 | 35 |
| Mode M9 | |||
|---|---|---|---|
| Quadrant | BADHDUFLAG | Total packets | Discarded packets |
| A | 0 | 2 | 2 |
| B | 0 | 8 | 8 |
| C | 0 | 2 | 2 |
| D | 0 | 1 | 1 |
| Mode M0 | |||
|---|---|---|---|
| Quadrant | BADHDUFLAG | Total packets | Discarded packets |
| A | 0 | 3168 | 3109 |
| B | 0 | 4861 | 4814 |
| C | 0 | 3963 | 3911 |
| D | 0 | 5627 | 5599 |
| Quadrant | Total seconds | Saturated seconds | Saturation percentage |
|---|---|---|---|
| A | 29 | 0 | 0.000000% |
| B | 16 | 0 | 0.000000% |
| C | 26 | 0 | 0.000000% |
| D | 9 | 0 | 0.000000% |
Noise dominated data is calculated using 1-second bins in cleaned event files. If a bin has >2000 counts, and if more than 50% of those come from <1% of pixels, then it is considered to be noise-dominated and hence unusable.
| Quadrant | # 1 sec bins | Bins with >0 counts | Bins with >2000 counts | High rate bins dominated by noise | Noise dominated (total time) | Noise dominated (detector-on time) | Marked lightcurve |
|---|---|---|---|---|---|---|---|
| A | 1618 | 45 | 0 | 0 | 0.00% | 0.00% |  |
| B | 1106 | 26 | 0 | 0 | 0.00% | 0.00% |  |
| C | 51 | 35 | 0 | 0 | 0.00% | 0.00% |  |
| D | 41 | 13 | 0 | 0 | 0.00% | 0.00% |  |
Top three noisy pixels from each quadrant. If the there are fewer than three noisy pixels in the level2.evt file, extra rows are filled as -1
| Pixel properties | Quadrant properties | ||||||
|---|---|---|---|---|---|---|---|
| Quadrant | DetID | PixID | Counts | Sigma | Mean | Median | Sigma |
| A | 13 | 254 | 41 | 22.08 | 3 | 3 | 1.7 |
| A | 0 | 226 | 33 | 17.43 | 3 | 3 | 1.7 |
| A | 3 | 137 | 25 | 12.78 | 3 | 3 | 1.7 |
| B | 6 | 159 | 4152 | 3675.21 | 1 | 1 | 1.1 |
| B | 12 | 111 | 60 | 52.24 | 1 | 1 | 1.1 |
| B | 14 | 111 | 42 | 36.3 | 1 | 1 | 1.1 |
| C | 14 | 238 | 473 | 286.9 | 2 | 2 | 1.6 |
| C | 3 | 233 | 330 | 199.79 | 2 | 2 | 1.6 |
| C | 2 | 114 | 47 | 27.41 | 2 | 2 | 1.6 |
| D | 7 | 80 | 1871 | 2973.65 | 1 | 1 | 0.6 |
| D | 8 | 195 | 1047 | 1663.34 | 1 | 1 | 0.6 |
| D | 13 | 104 | 71 | 111.31 | 1 | 1 | 0.6 |
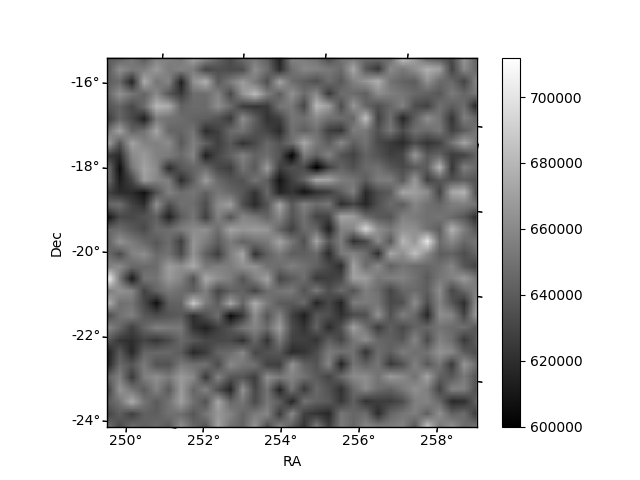
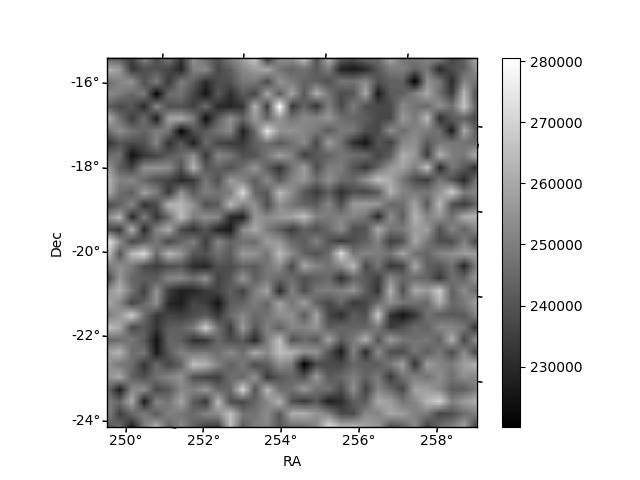
Histogram calculated using DETX and DETY for each event in the final _common_clean file
| Quadrant A | 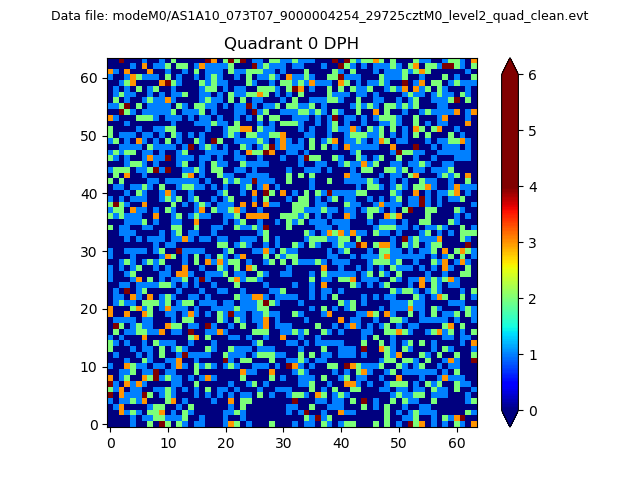 |
 |
Quadrant B |
|---|---|---|---|
| Quadrant D | 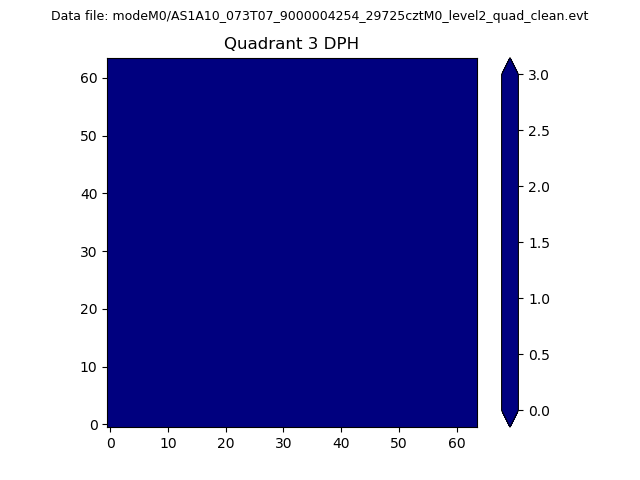 |
 |
Quadrant C |
| Plot type | Count rate plots | Images |
|---|---|---|
| Comparison with Poisson distribution Blue bars denote a histogram of data divided into 1 sec bins. Red curve is a Poisson curve with rate = median count rate of data. |
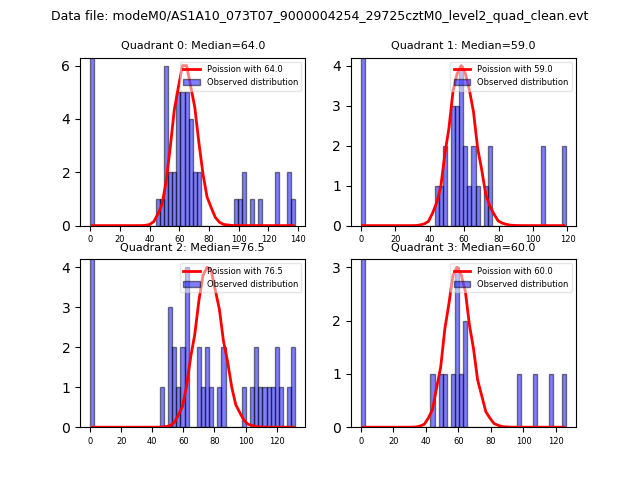 |
 |
| Quadrant-wise count rates Data is divided into 100 sec bins |
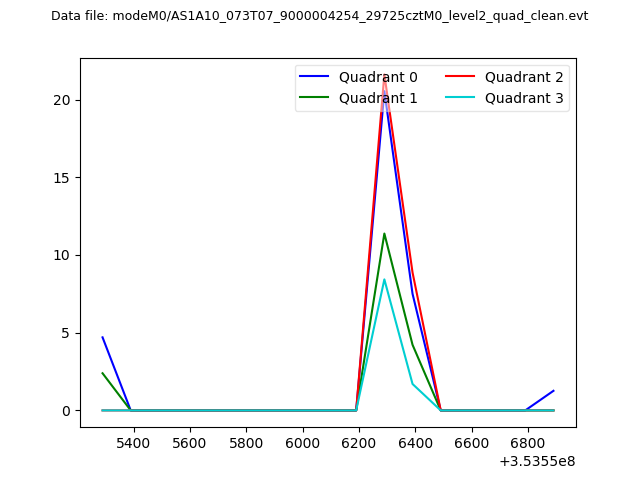 |
|
| Module-wise count rates for Quadrant A Data is divided into 100 sec bins |
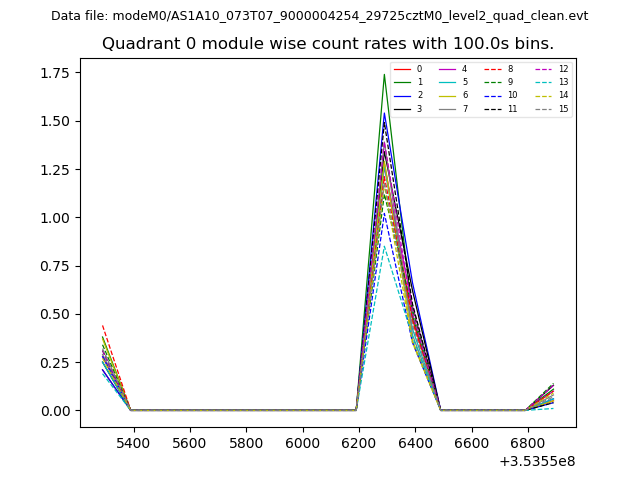 |
 |
| Module-wise count rates for Quadrant B Data is divided into 100 sec bins |
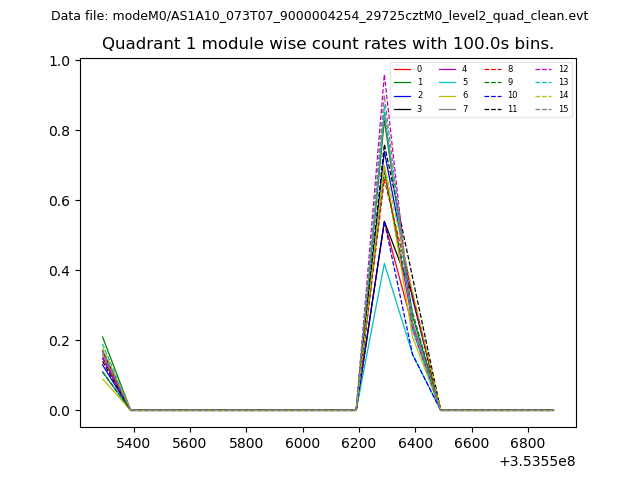 |
 |
| Module-wise count rates for Quadrant C Data is divided into 100 sec bins |
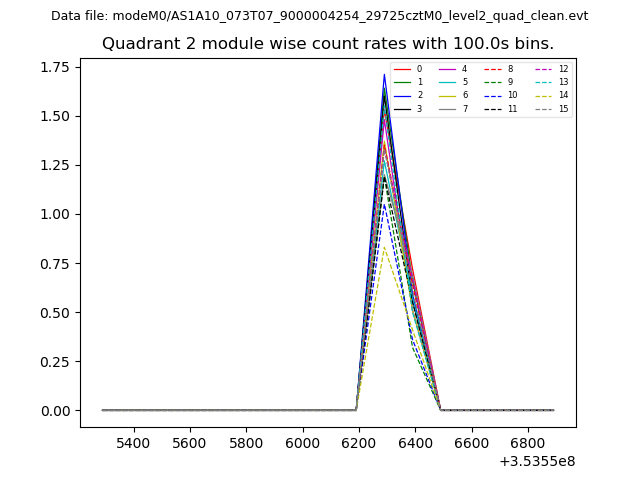 |
 |
| Module-wise count rates for Quadrant D Data is divided into 100 sec bins |
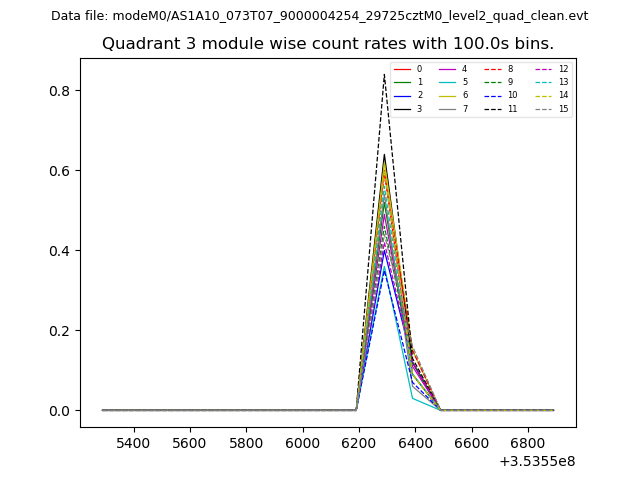 |
 |
| Parameter | Plot |
|---|---|
| CZT HV Monitor | 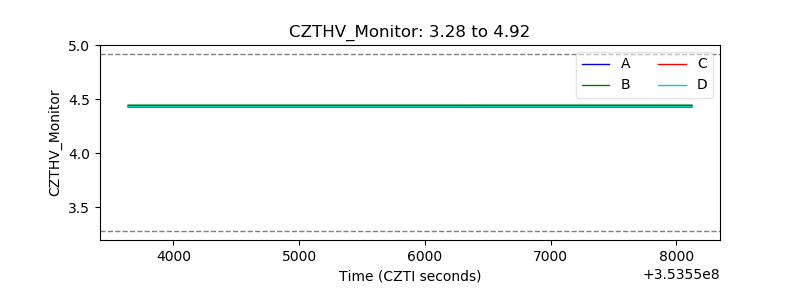 |
| D_VDD | 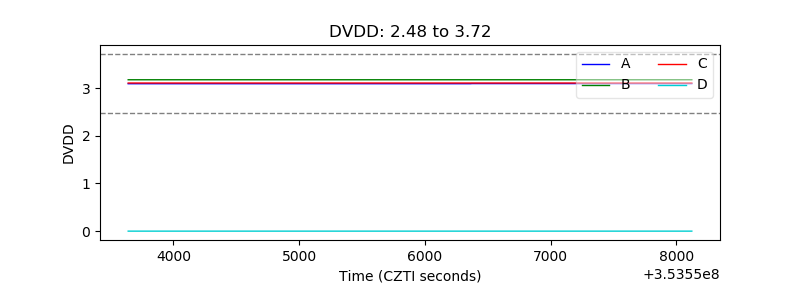 |
| Temperature 1 | 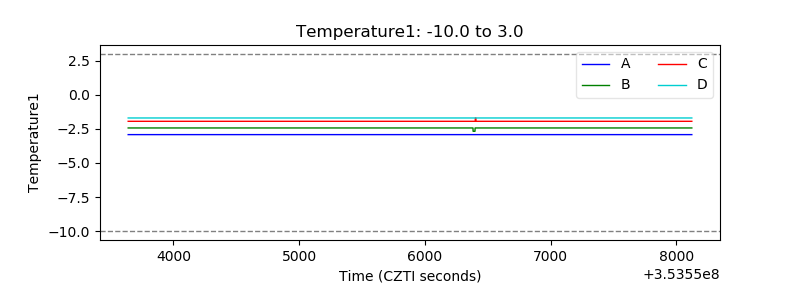 |
| Veto HV Monitor | 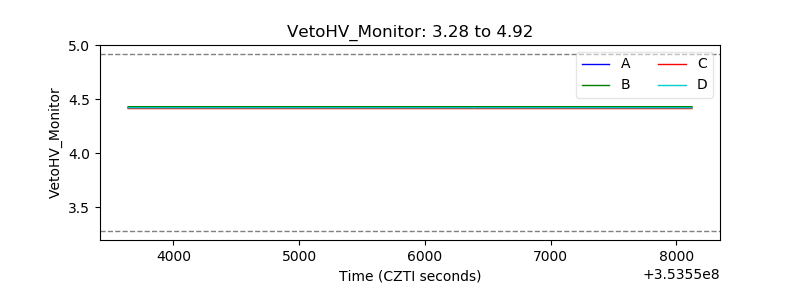 |
| Veto LLD | 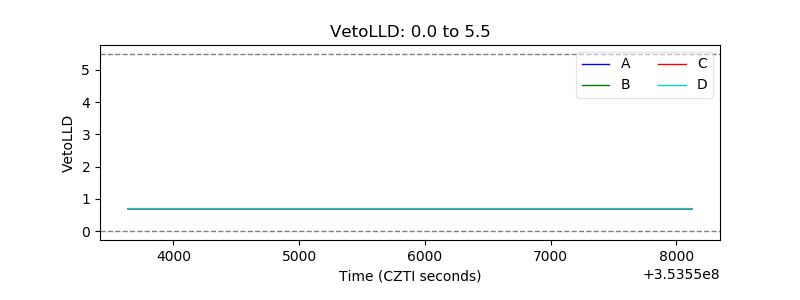 |
| Alpha Counter | 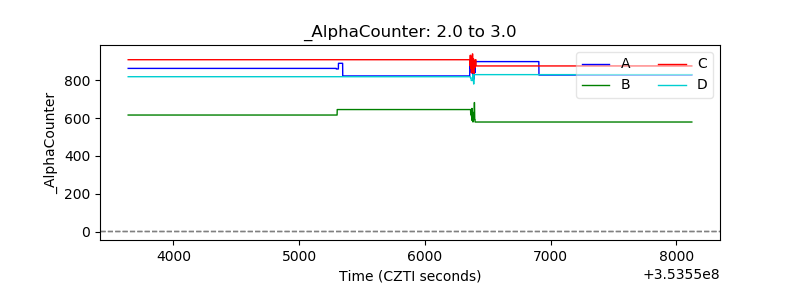 |
| _CPM_Rate | 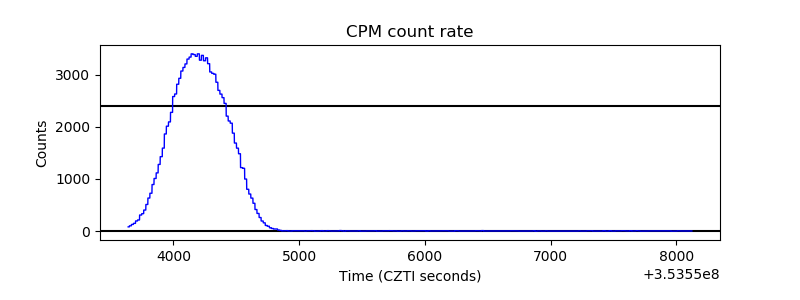 |
| CZT Counter | 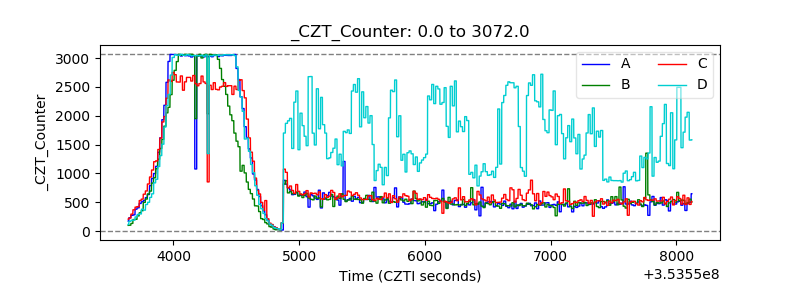 |
| +2.5 Volts monitor |  |
| +5 Volts monitor |  |
| _ROLL_ROT | 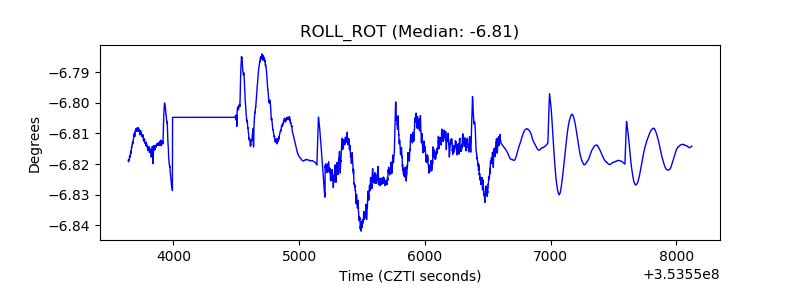 |
| _Roll_DEC | 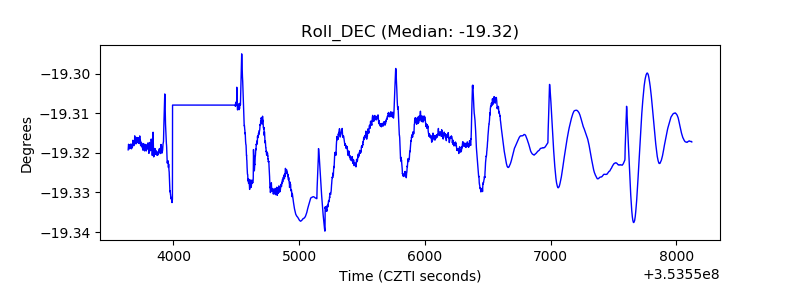 |
| _Roll_RA | 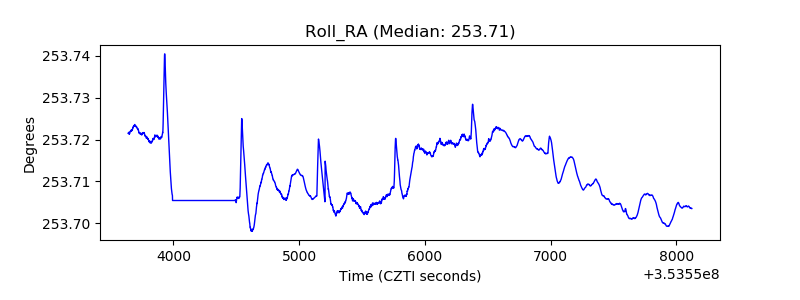 |
| Veto Counter | 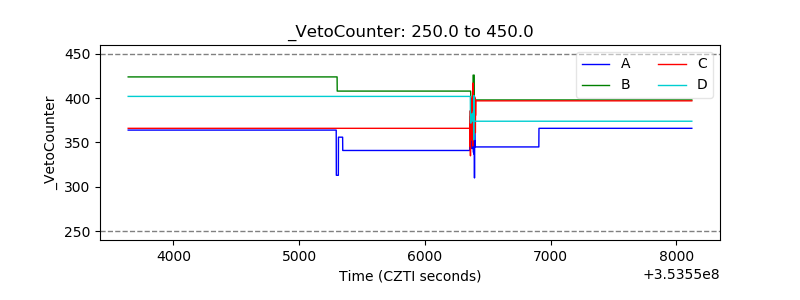 |