| Param | Original file | Final file |
|---|---|---|
| Filename | modeM0/AS1A10_094T08_9000004252cztM0_level2.fits | modeM0/AS1A10_094T08_9000004252cztM0_level2_quad_clean.evt |
| Size (bytes) | 48,358,080 | 32,330,880 |
| Size | 46.1 MB | 30.8 MB |
| Events in quadrant A | 278,734 | 136,330 |
| Events in quadrant B | 264,888 | 142,352 |
| Events in quadrant C | 276,560 | 132,547 |
| Events in quadrant D | 286,992 | 209,722 |
| Mode M0 | |||
|---|---|---|---|
| Quadrant | BADHDUFLAG | Total packets | Discarded packets |
| A | 0 | 9732 | 0 |
| B | 0 | 10038 | 0 |
| C | 0 | 10167 | 0 |
| D | 0 | 33623 | 0 |
| Mode SS | |||
|---|---|---|---|
| Quadrant | BADHDUFLAG | Total packets | Discarded packets |
| A | 0 | 96 | 0 |
| B | 0 | 96 | 0 |
| C | 0 | 98 | 0 |
| D | 0 | 94 | 0 |
| Quadrant | Total seconds | Saturated seconds | Saturation percentage |
|---|---|---|---|
| A | 4673 | 151 | 3.231329% |
| B | 4745 | 176 | 3.709168% |
| C | 4737 | 204 | 4.306523% |
| D | 6283 | 1081 | 17.205157% |
Noise dominated data is calculated using 1-second bins in cleaned event files. If a bin has >2000 counts, and if more than 50% of those come from <1% of pixels, then it is considered to be noise-dominated and hence unusable.
| Quadrant | # 1 sec bins | Bins with >0 counts | Bins with >2000 counts | High rate bins dominated by noise | Noise dominated (total time) | Noise dominated (detector-on time) | Marked lightcurve |
|---|---|---|---|---|---|---|---|
| A | 6318 | 4717 | 0 | 0 | 0.00% | 0.00% |  |
| B | 6318 | 4786 | 0 | 0 | 0.00% | 0.00% |  |
| C | 6318 | 4778 | 0 | 0 | 0.00% | 0.00% |  |
| D | 6318 | 6283 | 0 | 0 | 0.00% | 0.00% |  |
Top three noisy pixels from each quadrant. If the there are fewer than three noisy pixels in the level2.evt file, extra rows are filled as -1
| Pixel properties | Quadrant properties | ||||||
|---|---|---|---|---|---|---|---|
| Quadrant | DetID | PixID | Counts | Sigma | Mean | Median | Sigma |
| A | 0 | 29 | 278 | 10.5 | 72 | 68 | 20.0 |
| A | 0 | 30 | 243 | 8.75 | 72 | 68 | 20.0 |
| A | 7 | 110 | 234 | 8.3 | 72 | 68 | 20.0 |
| B | 2 | 9 | 191 | 7.83 | 70 | 67 | 15.8 |
| B | 5 | 225 | 172 | 6.63 | 70 | 67 | 15.8 |
| B | 14 | 254 | 165 | 6.19 | 70 | 67 | 15.8 |
| C | 12 | 241 | 211 | 7.14 | 73 | 68 | 20.0 |
| C | 9 | 209 | 203 | 6.74 | 73 | 68 | 20.0 |
| C | 2 | 191 | 191 | 6.14 | 73 | 68 | 20.0 |
| D | 15 | 46 | 220 | 6.2 | 81 | 74 | 23.5 |
| D | 4 | 246 | 220 | 6.2 | 81 | 74 | 23.5 |
| D | 3 | 14 | 216 | 6.03 | 81 | 74 | 23.5 |
Histogram calculated using DETX and DETY for each event in the final _common_clean file
| Quadrant A | 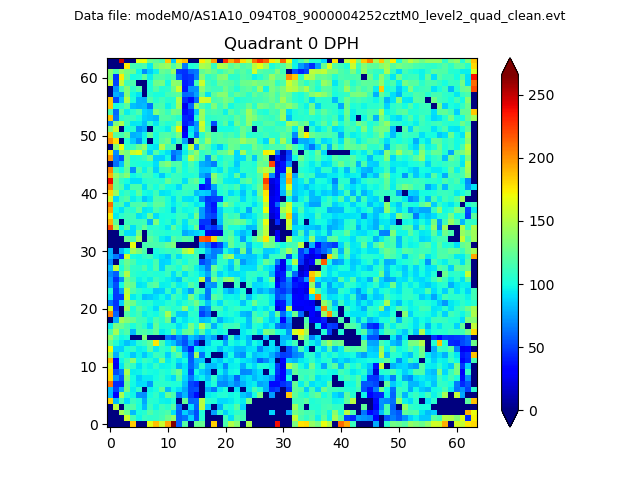 |
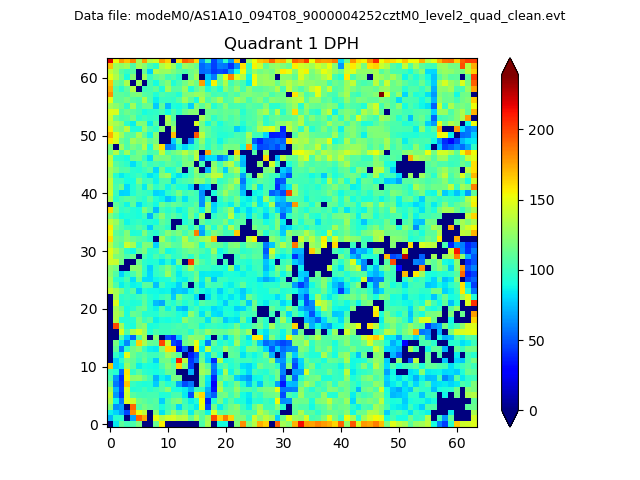 |
Quadrant B |
|---|---|---|---|
| Quadrant D |  |
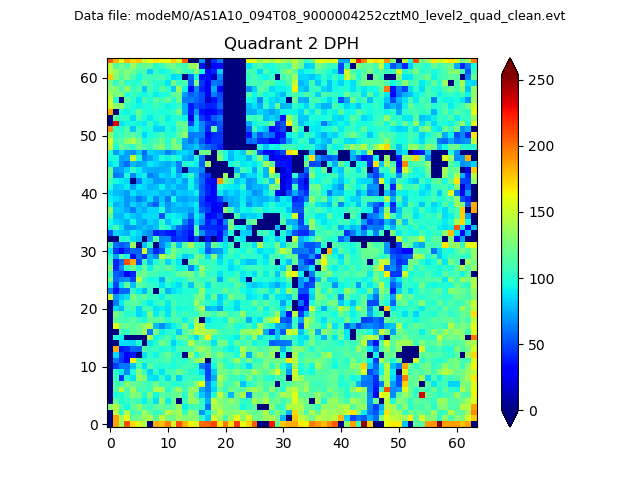 |
Quadrant C |
| Plot type | Count rate plots | Images |
|---|---|---|
| Comparison with Poisson distribution Blue bars denote a histogram of data divided into 1 sec bins. Red curve is a Poisson curve with rate = median count rate of data. |
 |
 |
| Quadrant-wise count rates Data is divided into 100 sec bins |
 |
|
| Module-wise count rates for Quadrant A Data is divided into 100 sec bins |
 |
 |
| Module-wise count rates for Quadrant B Data is divided into 100 sec bins |
 |
 |
| Module-wise count rates for Quadrant C Data is divided into 100 sec bins |
 |
 |
| Module-wise count rates for Quadrant D Data is divided into 100 sec bins |
 |
 |
| Parameter | Plot |
|---|---|
| CZT HV Monitor |  |
| D_VDD | 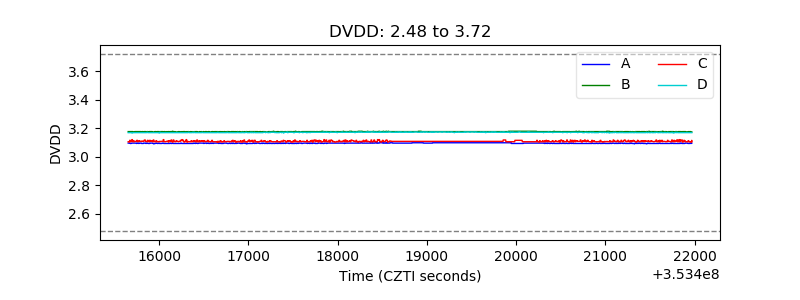 |
| Temperature 1 |  |
| Veto HV Monitor |  |
| Veto LLD |  |
| Alpha Counter |  |
| _CPM_Rate |  |
| CZT Counter |  |
| +2.5 Volts monitor |  |
| +5 Volts monitor |  |
| _ROLL_ROT |  |
| _Roll_DEC |  |
| _Roll_RA | 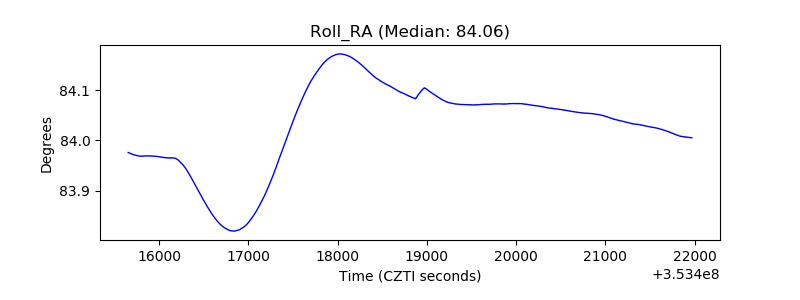 |
| Veto Counter |  |