| Param | Original file | Final file |
|---|---|---|
| Filename | modeM0/AS1A10_094T08_9000004252_29519cztM0_level2.evt | modeM0/AS1A10_094T08_9000004252_29519cztM0_level2_quad_clean.evt |
| Size (bytes) | 296,593,920 | 39,778,560 |
| Size | 282.9 MB | 37.9 MB |
| Events in quadrant A | 1,494,589 | 254,351 |
| Events in quadrant B | 1,525,868 | 260,968 |
| Events in quadrant C | 1,600,717 | 249,906 |
| Events in quadrant D | 4,159,247 | 228,027 |
| Mode M0 | |||
|---|---|---|---|
| Quadrant | BADHDUFLAG | Total packets | Discarded packets |
| A | 0 | 6283 | 0 |
| B | 0 | 6409 | 0 |
| C | 0 | 6549 | 0 |
| D | 0 | 14459 | 0 |
| Mode SS | |||
|---|---|---|---|
| Quadrant | BADHDUFLAG | Total packets | Discarded packets |
| A | 0 | 60 | 0 |
| B | 0 | 60 | 0 |
| C | 0 | 60 | 0 |
| D | 0 | 60 | 0 |
| Quadrant | Total seconds | Saturated seconds | Saturation percentage |
|---|---|---|---|
| A | 2953 | 151 | 5.113444% |
| B | 2953 | 173 | 5.858449% |
| C | 2953 | 195 | 6.603454% |
| D | 2953 | 506 | 17.135117% |
Noise dominated data is calculated using 1-second bins in cleaned event files. If a bin has >2000 counts, and if more than 50% of those come from <1% of pixels, then it is considered to be noise-dominated and hence unusable.
| Quadrant | # 1 sec bins | Bins with >0 counts | Bins with >2000 counts | High rate bins dominated by noise | Noise dominated (total time) | Noise dominated (detector-on time) | Marked lightcurve |
|---|---|---|---|---|---|---|---|
| A | 2953 | 2953 | 0 | 0 | 0.00% | 0.00% | 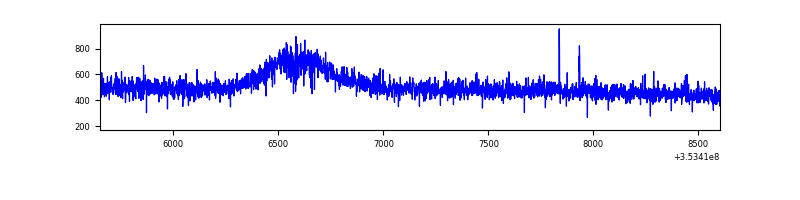 |
| B | 2953 | 2953 | 3 | 3 | 0.10% | 0.10% | 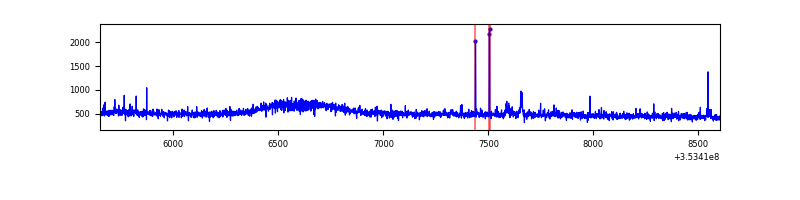 |
| C | 2953 | 2953 | 0 | 0 | 0.00% | 0.00% | 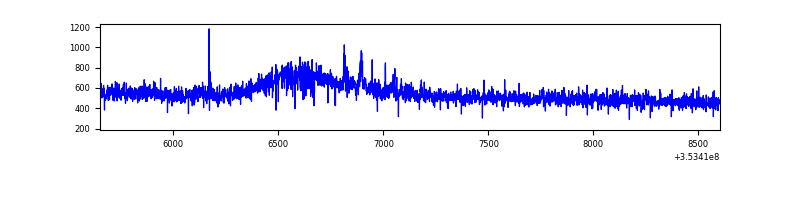 |
| D | 2953 | 2953 | 205 | 205 | 6.94% | 6.94% | 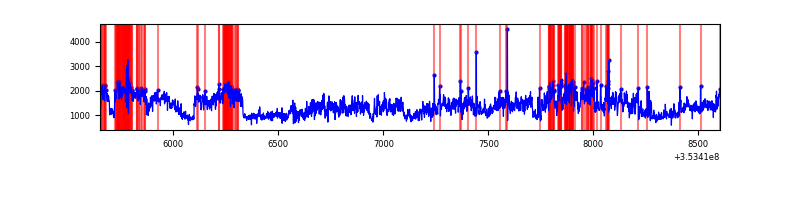 |
Top three noisy pixels from each quadrant. If the there are fewer than three noisy pixels in the level2.evt file, extra rows are filled as -1
| Pixel properties | Quadrant properties | ||||||
|---|---|---|---|---|---|---|---|
| Quadrant | DetID | PixID | Counts | Sigma | Mean | Median | Sigma |
| A | 13 | 254 | 5261 | 61.18 | 386 | 375 | 79.9 |
| A | 15 | 174 | 3983 | 45.18 | 386 | 375 | 79.9 |
| A | 3 | 137 | 3982 | 45.16 | 386 | 375 | 79.9 |
| B | 0 | 230 | 10933 | 140.36 | 381 | 370 | 75.3 |
| B | 12 | 111 | 9082 | 115.76 | 381 | 370 | 75.3 |
| B | 11 | 111 | 8533 | 108.47 | 381 | 370 | 75.3 |
| C | 14 | 238 | 61144 | 687.83 | 374 | 374 | 88.4 |
| C | 3 | 233 | 57254 | 643.8 | 374 | 374 | 88.4 |
| C | 2 | 114 | 7212 | 77.4 | 374 | 374 | 88.4 |
| D | 8 | 195 | 2551496 | 28547.52 | 369 | 357 | 89.4 |
| D | 7 | 223 | 64135 | 713.68 | 369 | 357 | 89.4 |
| D | 12 | 33 | 44330 | 492.06 | 369 | 357 | 89.4 |
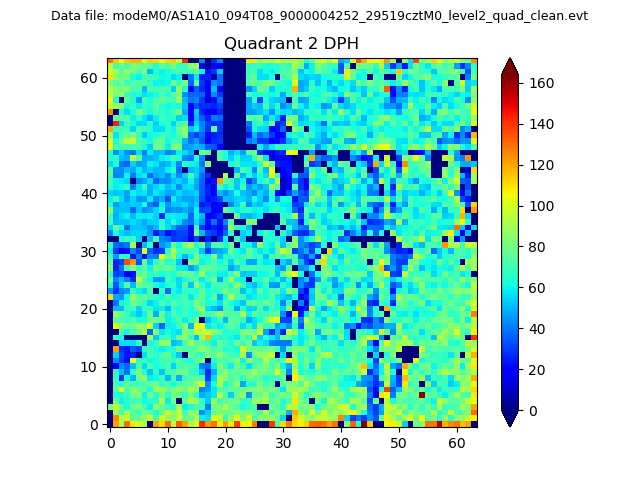
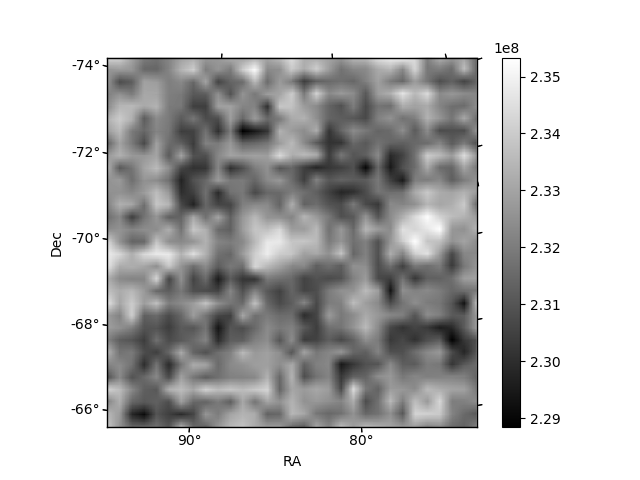
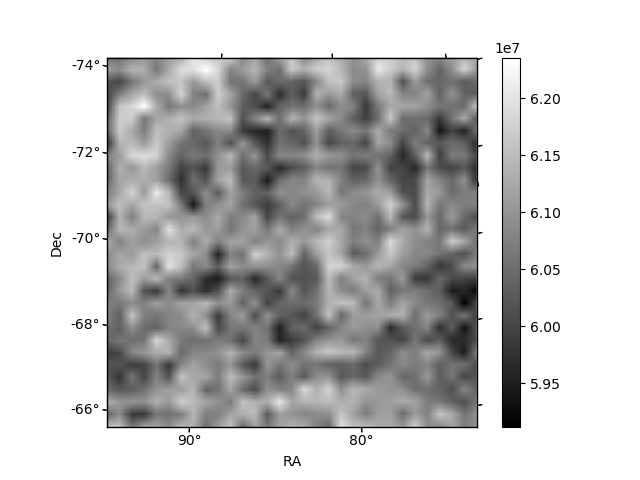
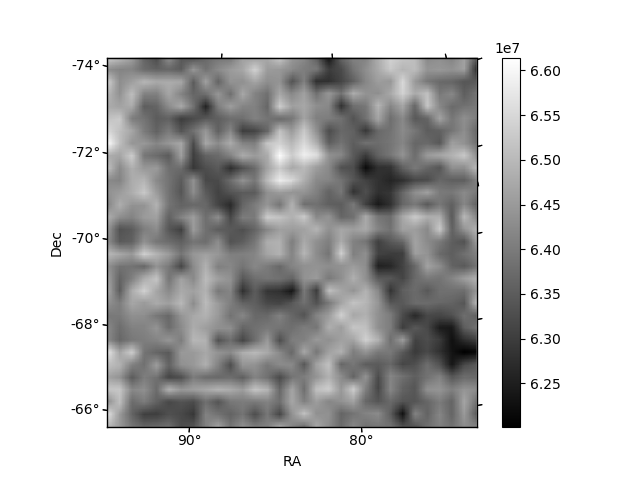
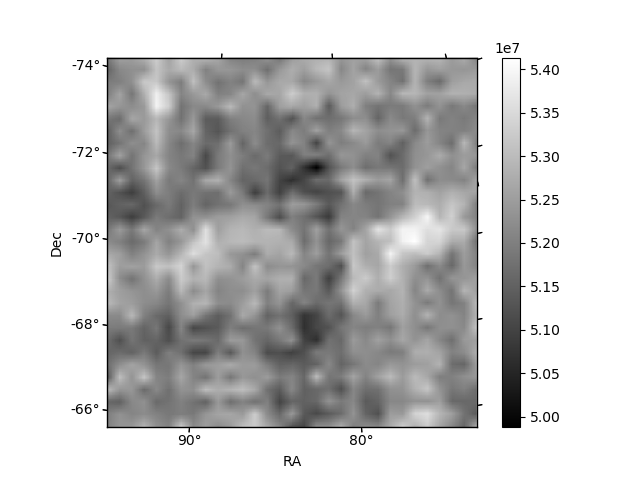
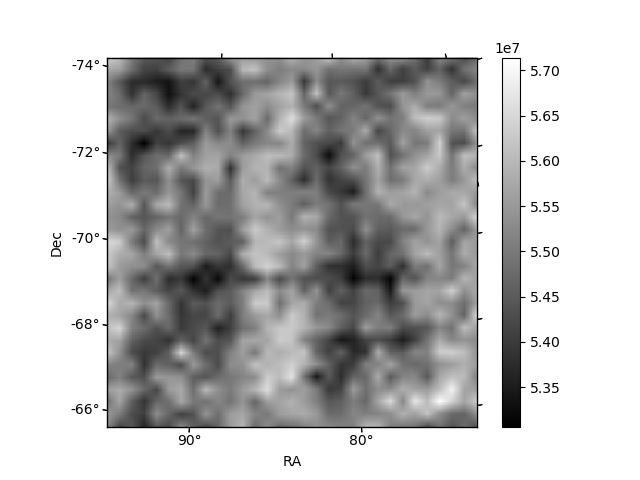
Histogram calculated using DETX and DETY for each event in the final _common_clean file
| Quadrant A | 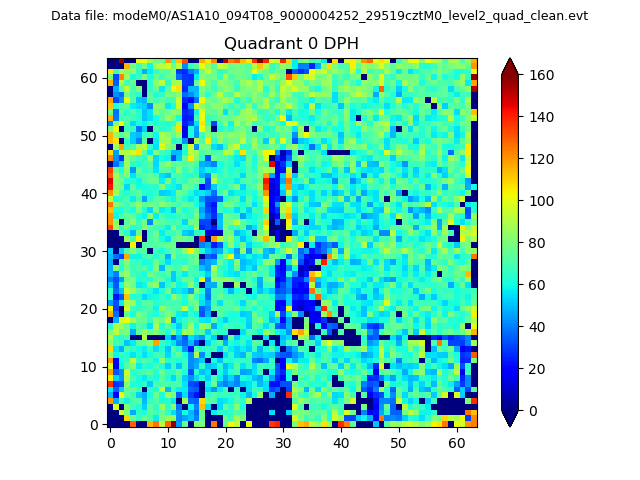 |
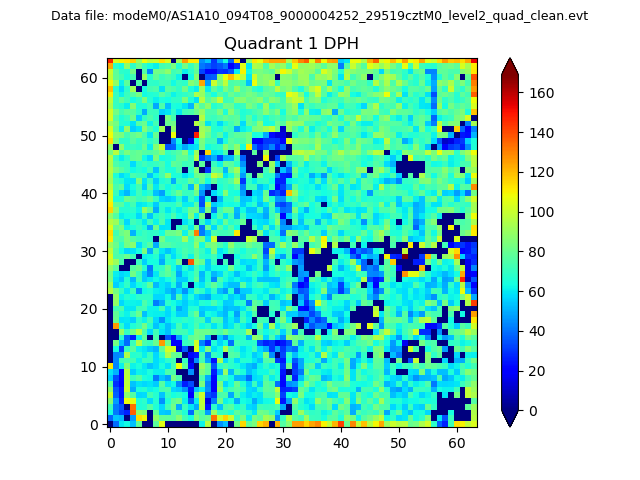 |
Quadrant B |
|---|---|---|---|
| Quadrant D | 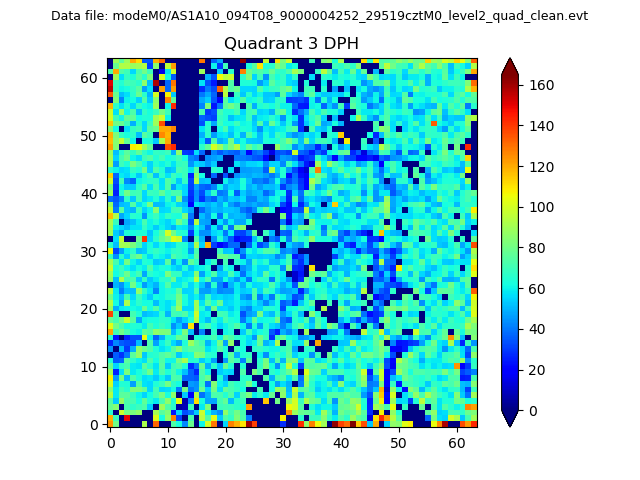 |
 |
Quadrant C |
| Plot type | Count rate plots | Images |
|---|---|---|
| Comparison with Poisson distribution Blue bars denote a histogram of data divided into 1 sec bins. Red curve is a Poisson curve with rate = median count rate of data. |
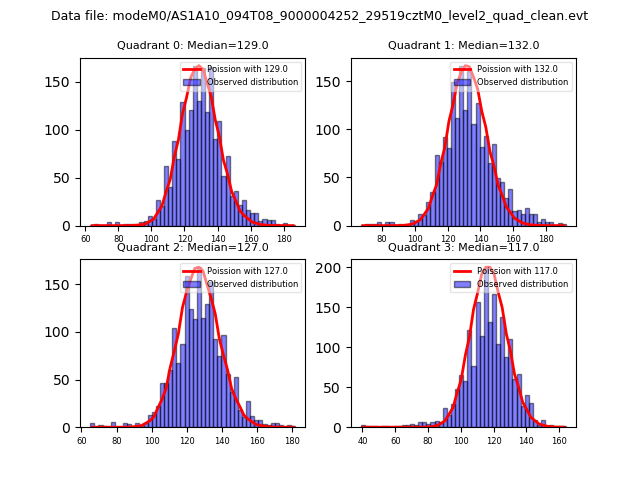 |
 |
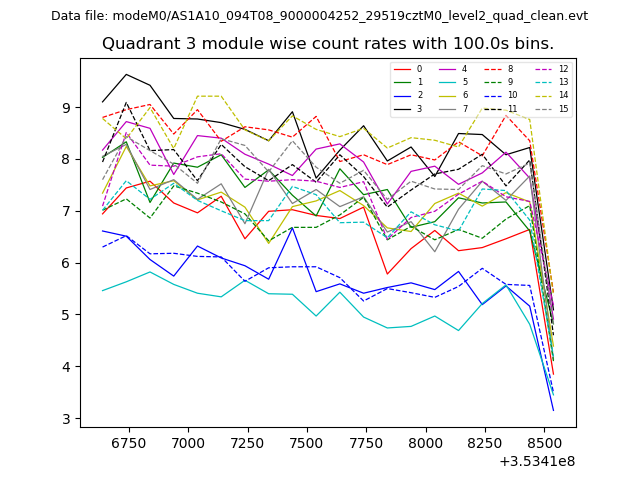
| Quadrant-wise count rates Data is divided into 100 sec bins |
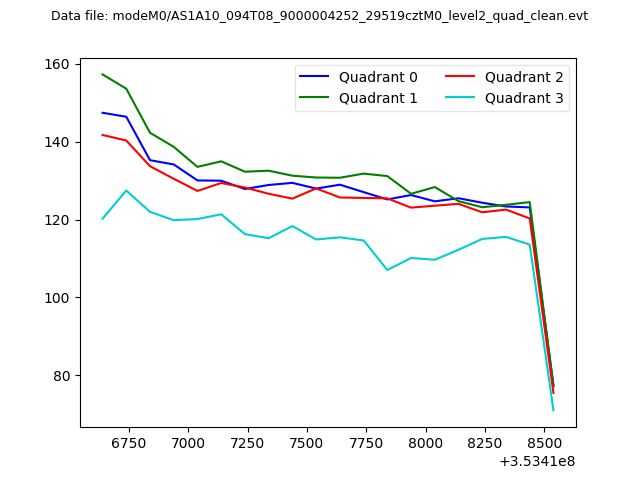 |
|
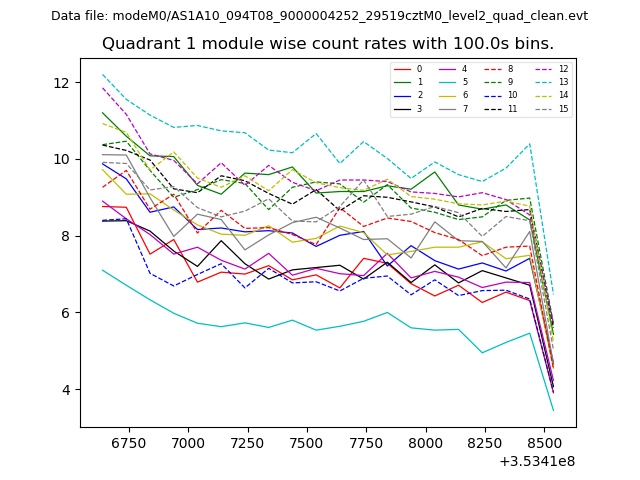
| Module-wise count rates for Quadrant A Data is divided into 100 sec bins |
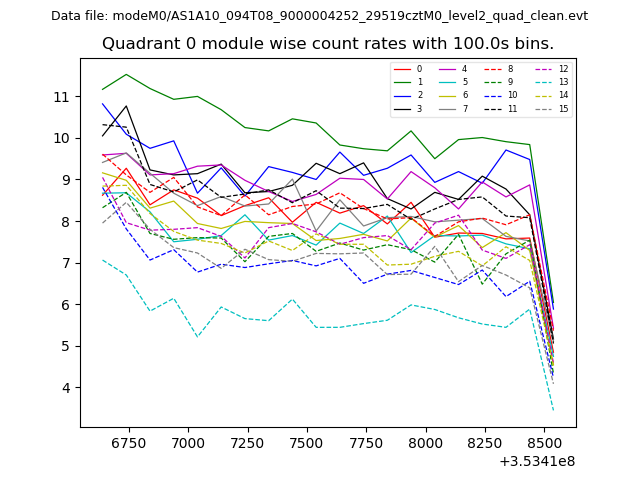 |
 |
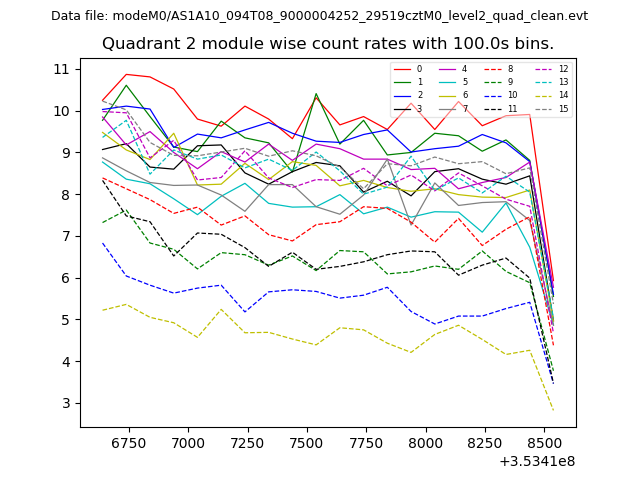
| Module-wise count rates for Quadrant B Data is divided into 100 sec bins |
 |
 |
| Module-wise count rates for Quadrant C Data is divided into 100 sec bins |
 |
 |
| Module-wise count rates for Quadrant D Data is divided into 100 sec bins |
 |
 |
| Parameter | Plot |
|---|---|
| CZT HV Monitor | 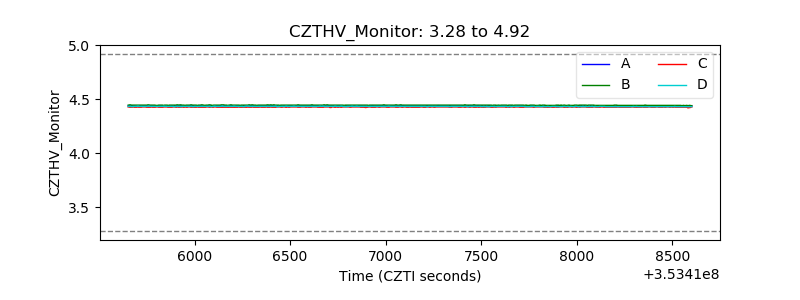 |
| D_VDD | 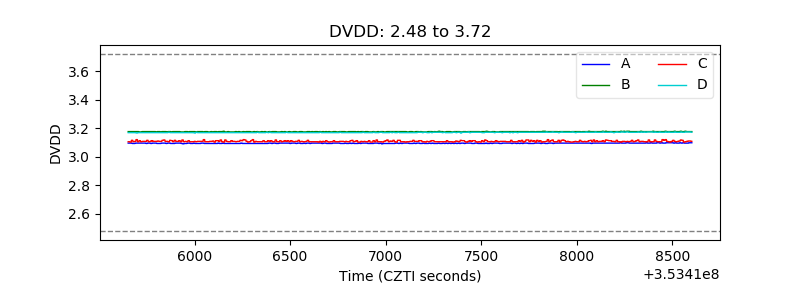 |
| Temperature 1 | 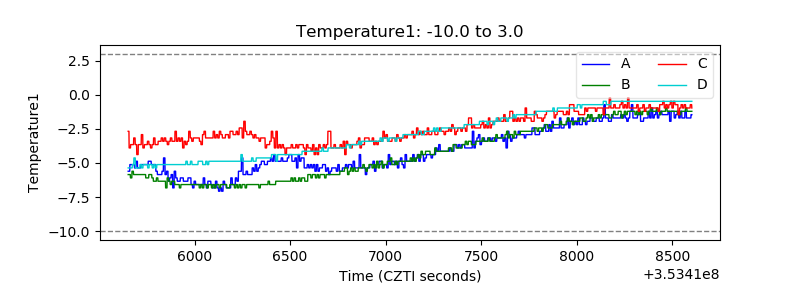 |
| Veto HV Monitor | 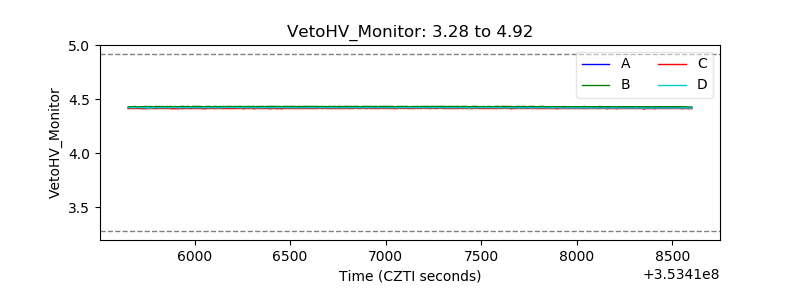 |
| Veto LLD | 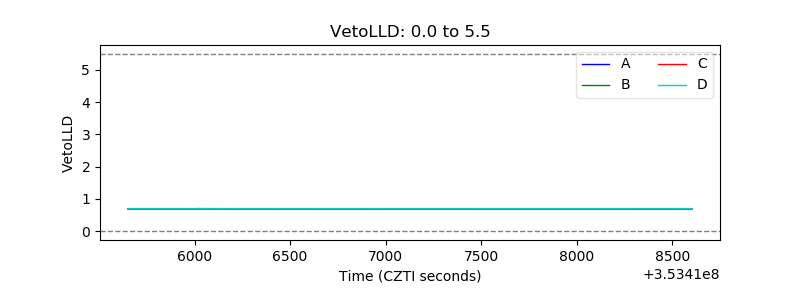 |
| Alpha Counter | 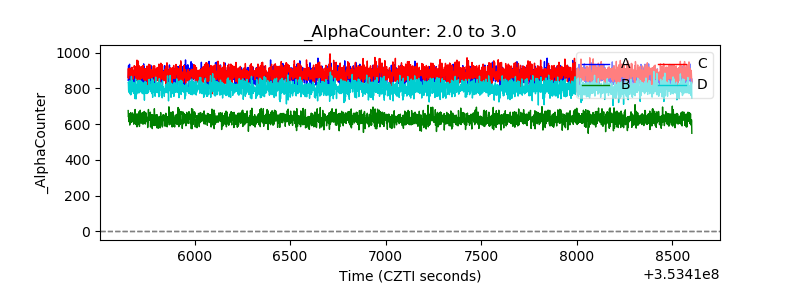 |
| _CPM_Rate | 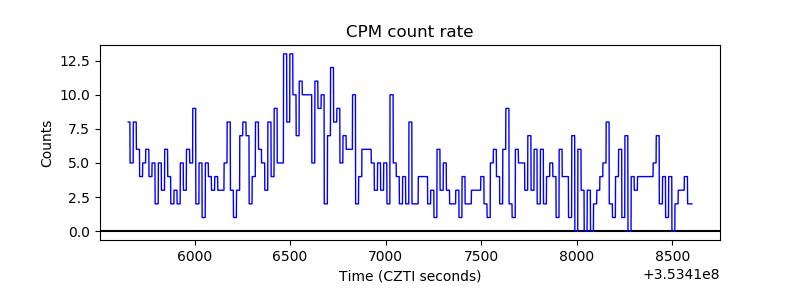 |
| CZT Counter | 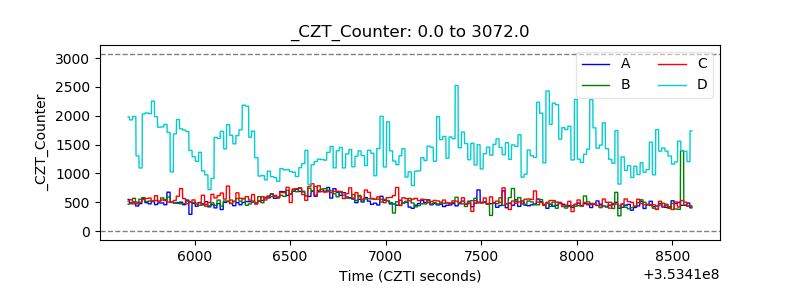 |
| +2.5 Volts monitor |  |
| +5 Volts monitor |  |
| _ROLL_ROT | 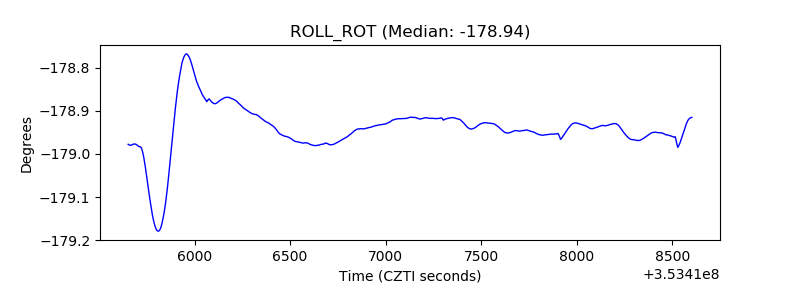 |
| _Roll_DEC | 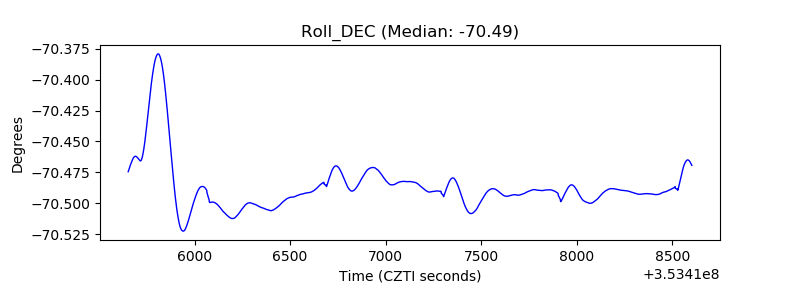 |
| _Roll_RA | 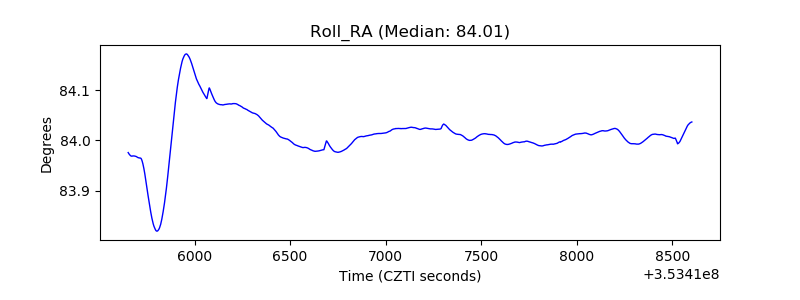 |
| Veto Counter | 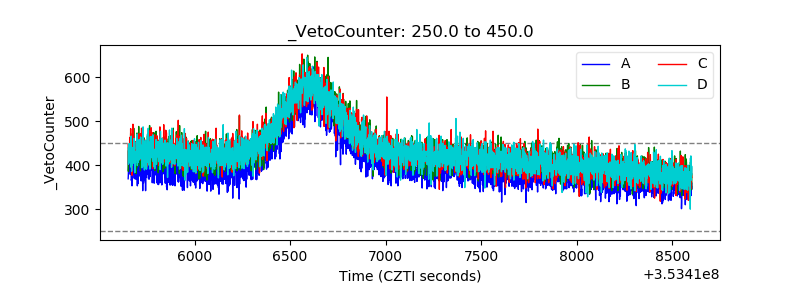 |