| Param | Original file | Final file |
|---|---|---|
| Filename | modeM0/AS1A10_094T08_9000004252_29523cztM0_level2.evt | modeM0/AS1A10_094T08_9000004252_29523cztM0_level2_quad_clean.evt |
| Size (bytes) | 393,269,760 | 60,053,760 |
| Size | 375.1 MB | 57.3 MB |
| Events in quadrant A | 1,693,444 | 404,794 |
| Events in quadrant B | 1,749,747 | 405,781 |
| Events in quadrant C | 1,799,176 | 386,492 |
| Events in quadrant D | 6,404,702 | 347,519 |
| Mode M0 | |||
|---|---|---|---|
| Quadrant | BADHDUFLAG | Total packets | Discarded packets |
| A | 0 | 7786 | 0 |
| B | 0 | 7859 | 0 |
| C | 0 | 7868 | 0 |
| D | 0 | 21723 | 0 |
| Mode SS | |||
|---|---|---|---|
| Quadrant | BADHDUFLAG | Total packets | Discarded packets |
| A | 0 | 76 | 0 |
| B | 0 | 76 | 0 |
| C | 0 | 76 | 0 |
| D | 0 | 76 | 0 |
| Quadrant | Total seconds | Saturated seconds | Saturation percentage |
|---|---|---|---|
| A | 3877 | 1 | 0.025793% |
| B | 3878 | 7 | 0.180505% |
| C | 3878 | 22 | 0.567303% |
| D | 3878 | 593 | 15.291387% |
Noise dominated data is calculated using 1-second bins in cleaned event files. If a bin has >2000 counts, and if more than 50% of those come from <1% of pixels, then it is considered to be noise-dominated and hence unusable.
| Quadrant | # 1 sec bins | Bins with >0 counts | Bins with >2000 counts | High rate bins dominated by noise | Noise dominated (total time) | Noise dominated (detector-on time) | Marked lightcurve |
|---|---|---|---|---|---|---|---|
| A | 3877 | 3877 | 0 | 0 | 0.00% | 0.00% | 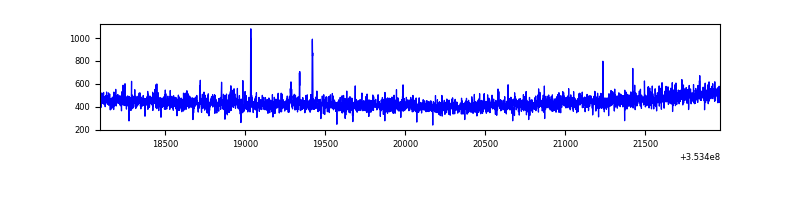 |
| B | 3878 | 3878 | 1 | 1 | 0.03% | 0.03% | 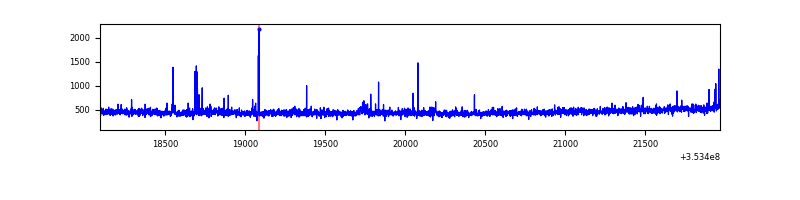 |
| C | 3878 | 3878 | 0 | 0 | 0.00% | 0.00% | 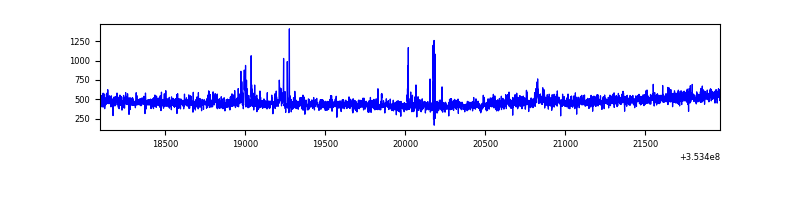 |
| D | 3878 | 3878 | 982 | 982 | 25.32% | 25.32% | 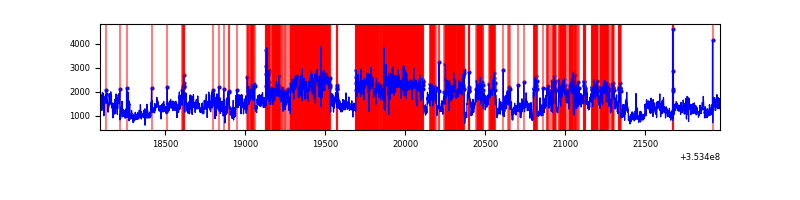 |
Top three noisy pixels from each quadrant. If the there are fewer than three noisy pixels in the level2.evt file, extra rows are filled as -1
| Pixel properties | Quadrant properties | ||||||
|---|---|---|---|---|---|---|---|
| Quadrant | DetID | PixID | Counts | Sigma | Mean | Median | Sigma |
| A | 15 | 174 | 9482 | 101.27 | 435 | 427 | 89.4 |
| A | 13 | 254 | 8349 | 88.6 | 435 | 427 | 89.4 |
| A | 3 | 137 | 4254 | 42.8 | 435 | 427 | 89.4 |
| B | 10 | 245 | 12075 | 138.9 | 435 | 425 | 83.9 |
| B | 0 | 190 | 11151 | 127.88 | 435 | 425 | 83.9 |
| B | 12 | 111 | 9998 | 114.14 | 435 | 425 | 83.9 |
| C | 14 | 238 | 72637 | 731.22 | 414 | 417 | 98.8 |
| C | 3 | 233 | 65026 | 654.16 | 414 | 417 | 98.8 |
| C | 7 | 247 | 19597 | 194.2 | 414 | 417 | 98.8 |
| D | 8 | 195 | 4235874 | 43205.15 | 404 | 392 | 98.0 |
| D | 7 | 223 | 330413 | 3366.47 | 404 | 392 | 98.0 |
| D | 12 | 33 | 105272 | 1069.86 | 404 | 392 | 98.0 |
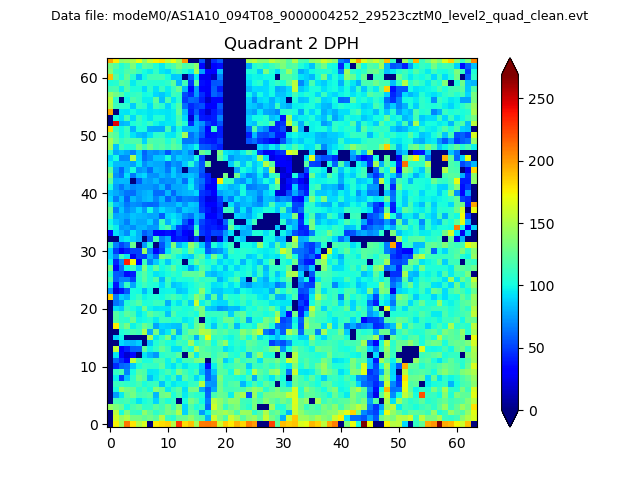
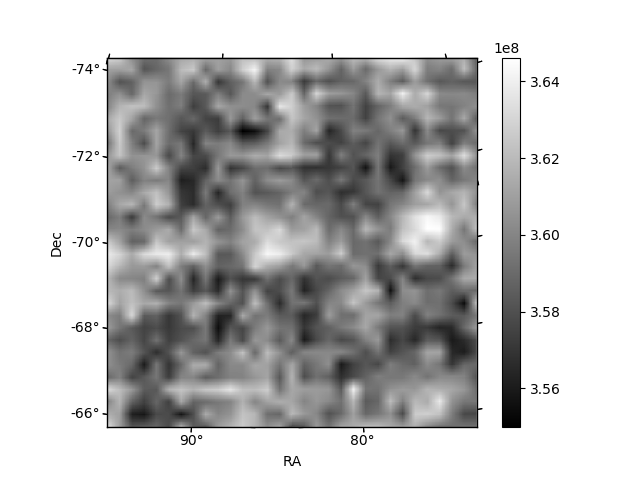
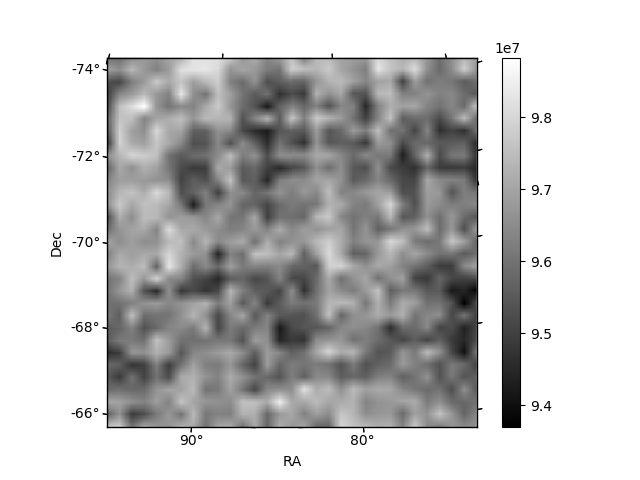
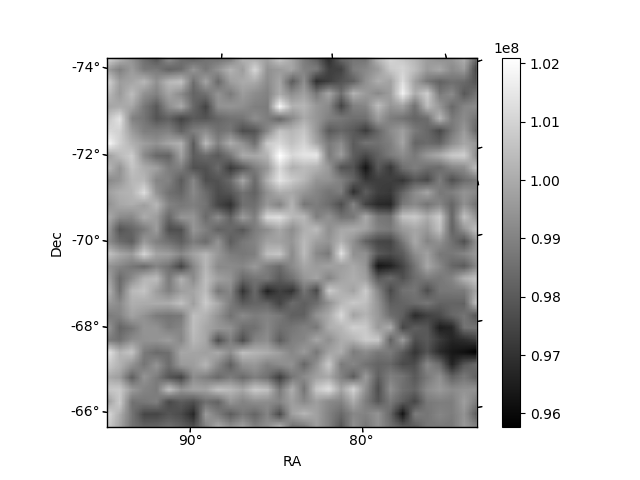
Histogram calculated using DETX and DETY for each event in the final _common_clean file
| Quadrant A | 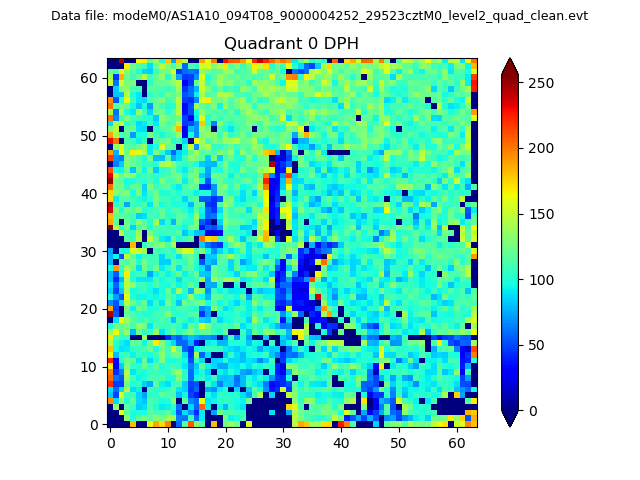 |
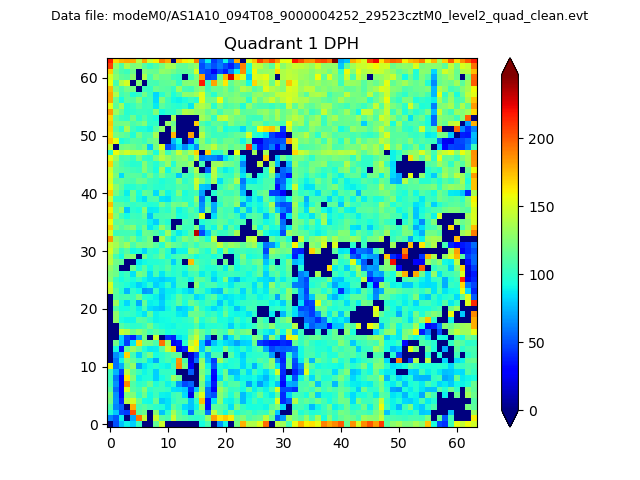 |
Quadrant B |
|---|---|---|---|
| Quadrant D | 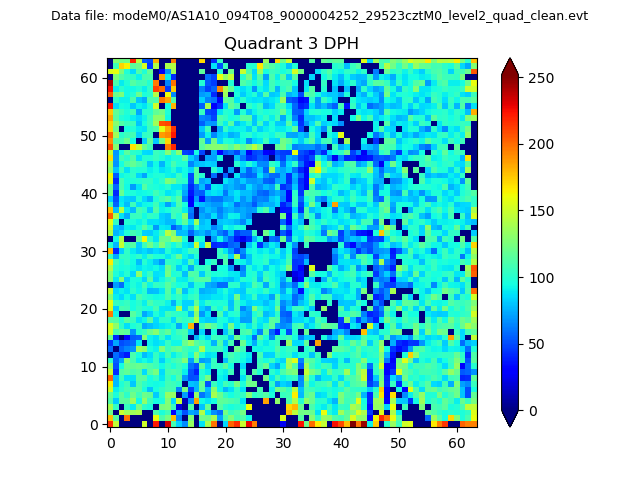 |
 |
Quadrant C |
| Plot type | Count rate plots | Images |
|---|---|---|
| Comparison with Poisson distribution Blue bars denote a histogram of data divided into 1 sec bins. Red curve is a Poisson curve with rate = median count rate of data. |
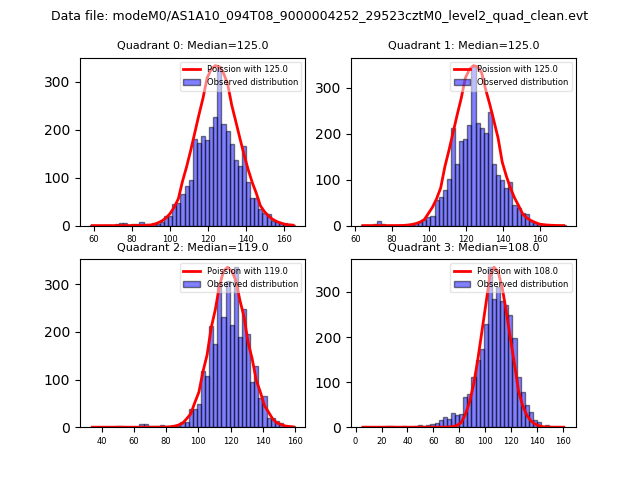 |
 |
| Quadrant-wise count rates Data is divided into 100 sec bins |
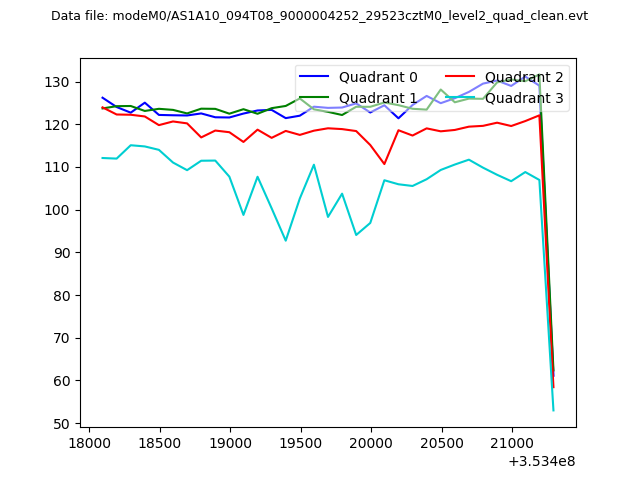 |
|
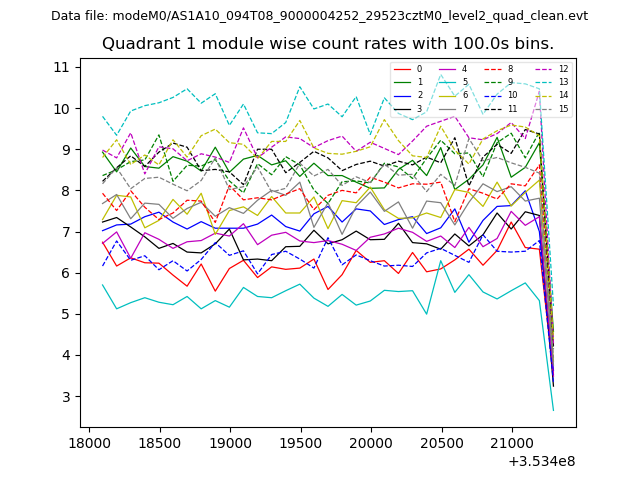
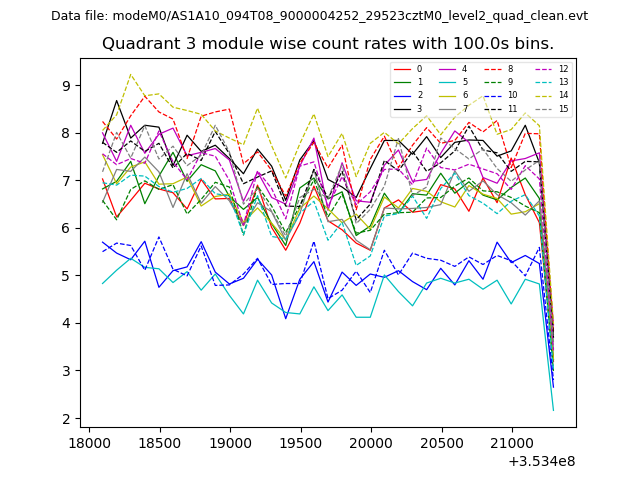
| Module-wise count rates for Quadrant A Data is divided into 100 sec bins |
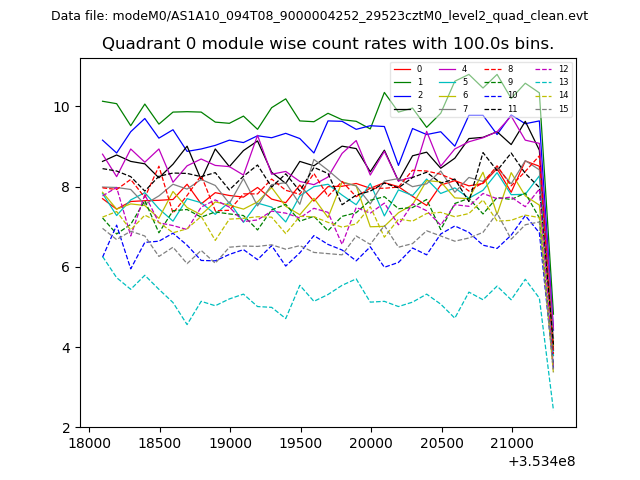 |
 |
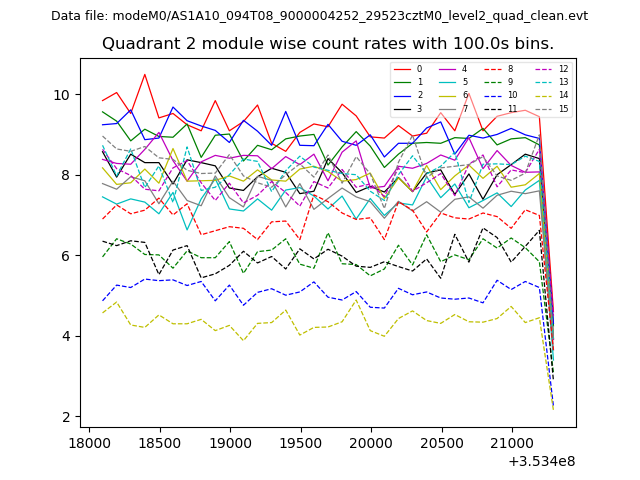
| Module-wise count rates for Quadrant B Data is divided into 100 sec bins |
 |
 |
| Module-wise count rates for Quadrant C Data is divided into 100 sec bins |
 |
 |
| Module-wise count rates for Quadrant D Data is divided into 100 sec bins |
 |
 |
| Parameter | Plot |
|---|---|
| CZT HV Monitor | 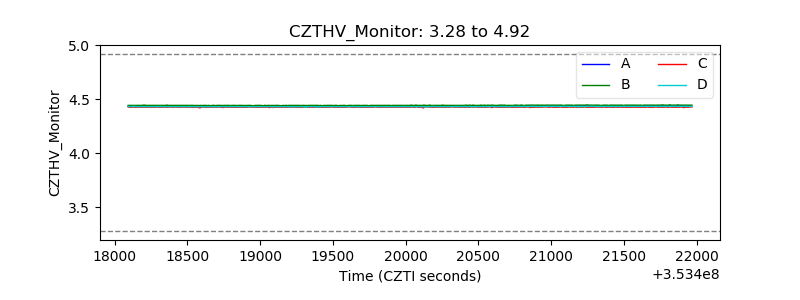 |
| D_VDD | 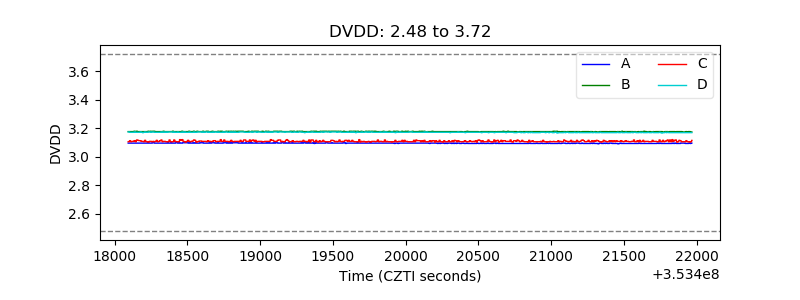 |
| Temperature 1 | 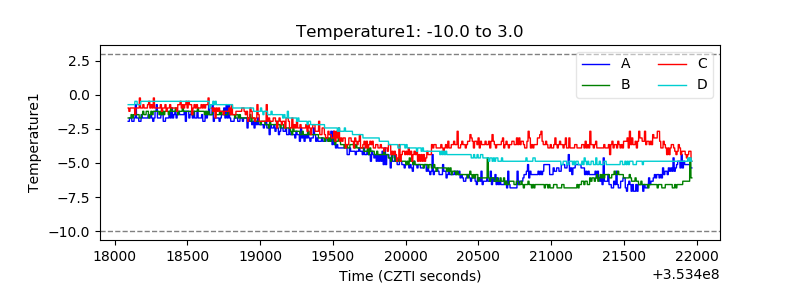 |
| Veto HV Monitor |  |
| Veto LLD | 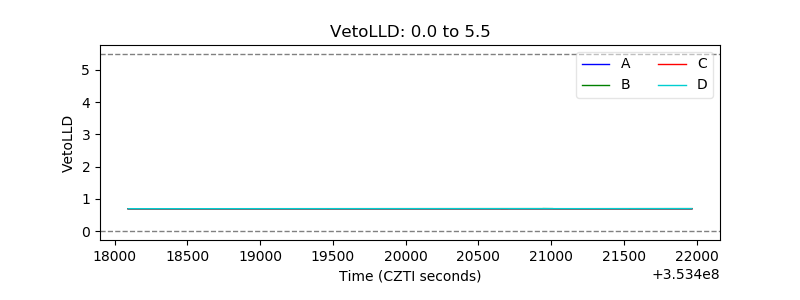 |
| Alpha Counter | 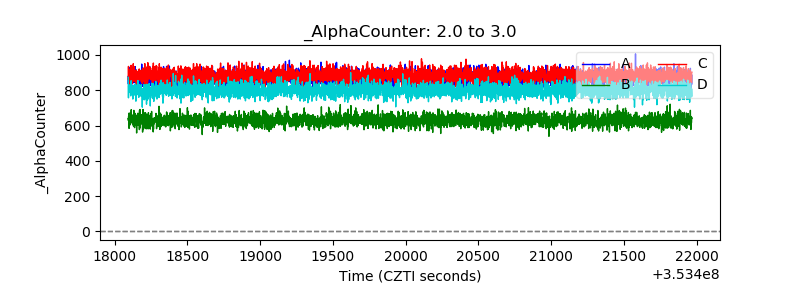 |
| _CPM_Rate | 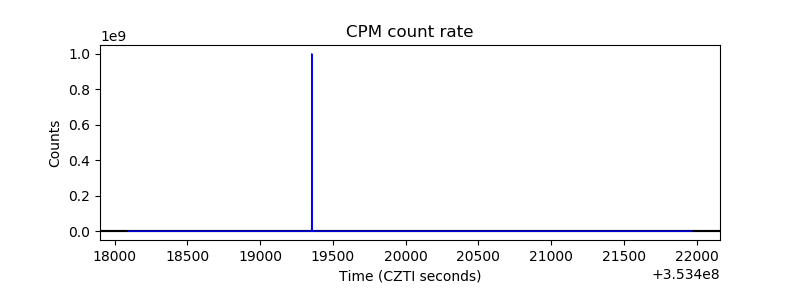 |
| CZT Counter | 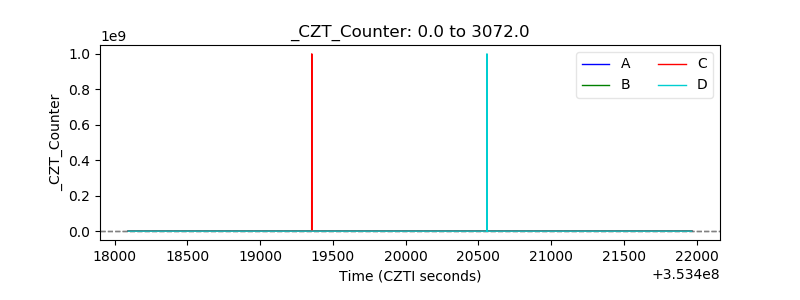 |
| +2.5 Volts monitor |  |
| +5 Volts monitor |  |
| _ROLL_ROT | 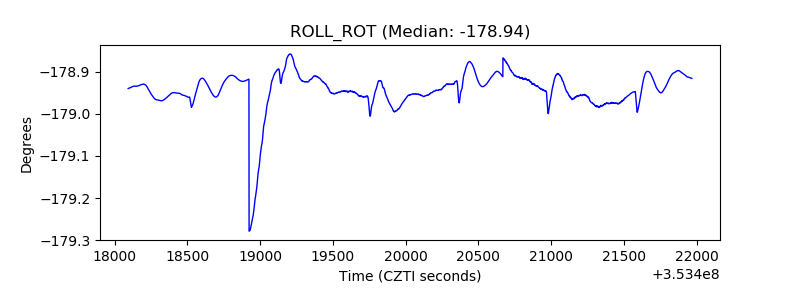 |
| _Roll_DEC | 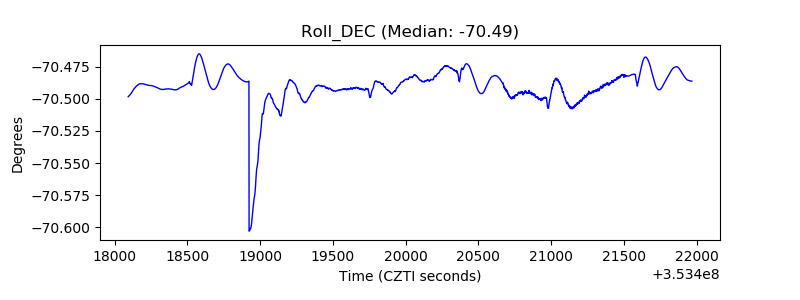 |
| _Roll_RA | 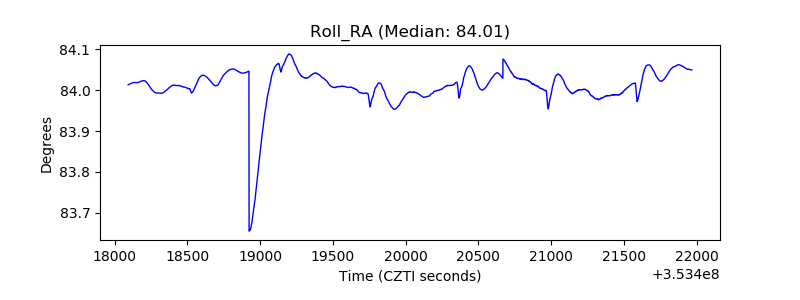 |
| Veto Counter | 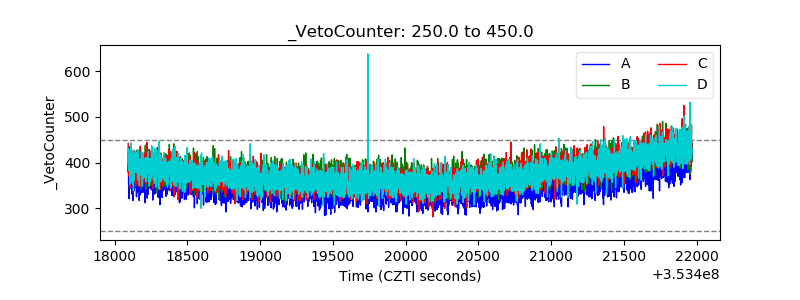 |