| Param | Original file | Final file |
|---|---|---|
| Filename | modeM0/AS1A10_094T09_9000004256cztM0_level2.fits | modeM0/AS1A10_094T09_9000004256cztM0_level2_quad_clean.evt |
| Size (bytes) | 47,160,000 | 58,003,200 |
| Size | 45.0 MB | 55.3 MB |
| Events in quadrant A | 290,638 | 379,828 |
| Events in quadrant B | 278,252 | 379,628 |
| Events in quadrant C | 268,258 | 343,759 |
| Events in quadrant D | 231,164 | 293,261 |
| Mode M0 | |||
|---|---|---|---|
| Quadrant | BADHDUFLAG | Total packets | Discarded packets |
| A | 0 | 11051 | 0 |
| B | 0 | 10943 | 0 |
| C | 0 | 11544 | 0 |
| D | 0 | 26452 | 0 |
| Mode SS | |||
|---|---|---|---|
| Quadrant | BADHDUFLAG | Total packets | Discarded packets |
| A | 0 | 106 | 0 |
| B | 0 | 106 | 0 |
| C | 0 | 106 | 0 |
| D | 0 | 106 | 0 |
| Mode M9 | |||
|---|---|---|---|
| Quadrant | BADHDUFLAG | Total packets | Discarded packets |
| A | 0 | 2 | 0 |
| B | 0 | 2 | 0 |
| C | 0 | 2 | 0 |
| D | 0 | 2 | 0 |
| Quadrant | Total seconds | Saturated seconds | Saturation percentage |
|---|---|---|---|
| A | 5122 | 131 | 2.557595% |
| B | 5122 | 135 | 2.635689% |
| C | 5122 | 632 | 12.338930% |
| D | 5122 | 696 | 13.588442% |
Noise dominated data is calculated using 1-second bins in cleaned event files. If a bin has >2000 counts, and if more than 50% of those come from <1% of pixels, then it is considered to be noise-dominated and hence unusable.
| Quadrant | # 1 sec bins | Bins with >0 counts | Bins with >2000 counts | High rate bins dominated by noise | Noise dominated (total time) | Noise dominated (detector-on time) | Marked lightcurve |
|---|---|---|---|---|---|---|---|
| A | 5337 | 5122 | 0 | 0 | 0.00% | 0.00% |  |
| B | 5337 | 5122 | 0 | 0 | 0.00% | 0.00% |  |
| C | 5337 | 5118 | 0 | 0 | 0.00% | 0.00% |  |
| D | 5337 | 5122 | 0 | 0 | 0.00% | 0.00% |  |
Top three noisy pixels from each quadrant. If the there are fewer than three noisy pixels in the level2.evt file, extra rows are filled as -1
| Pixel properties | Quadrant properties | ||||||
|---|---|---|---|---|---|---|---|
| Quadrant | DetID | PixID | Counts | Sigma | Mean | Median | Sigma |
| A | 14 | 188 | 313 | 11.58 | 75 | 71 | 20.9 |
| A | 14 | 204 | 261 | 9.09 | 75 | 71 | 20.9 |
| A | 0 | 29 | 244 | 8.28 | 75 | 71 | 20.9 |
| B | 2 | 9 | 215 | 8.72 | 73 | 70 | 16.6 |
| B | 2 | 8 | 199 | 7.76 | 73 | 70 | 16.6 |
| B | 15 | 6 | 190 | 7.21 | 73 | 70 | 16.6 |
| C | 1 | 81 | 209 | 7.19 | 70 | 66 | 19.9 |
| C | 1 | 80 | 196 | 6.54 | 70 | 66 | 19.9 |
| C | 12 | 250 | 192 | 6.34 | 70 | 66 | 19.9 |
| D | 15 | 46 | 194 | 7.02 | 65 | 60 | 19.1 |
| D | 4 | 246 | 185 | 6.55 | 65 | 60 | 19.1 |
| D | 6 | 231 | 177 | 6.13 | 65 | 60 | 19.1 |
Histogram calculated using DETX and DETY for each event in the final _common_clean file
| Quadrant A | 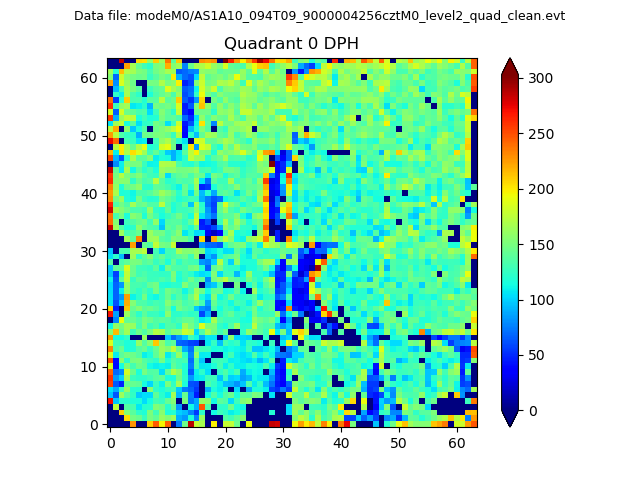 |
 |
Quadrant B |
|---|---|---|---|
| Quadrant D |  |
 |
Quadrant C |
| Plot type | Count rate plots | Images |
|---|---|---|
| Comparison with Poisson distribution Blue bars denote a histogram of data divided into 1 sec bins. Red curve is a Poisson curve with rate = median count rate of data. |
 |
 |
| Quadrant-wise count rates Data is divided into 100 sec bins |
 |
|
| Module-wise count rates for Quadrant A Data is divided into 100 sec bins |
 |
 |
| Module-wise count rates for Quadrant B Data is divided into 100 sec bins |
 |
 |
| Module-wise count rates for Quadrant C Data is divided into 100 sec bins |
 |
 |
| Module-wise count rates for Quadrant D Data is divided into 100 sec bins |
 |
 |
| Parameter | Plot |
|---|---|
| CZT HV Monitor | 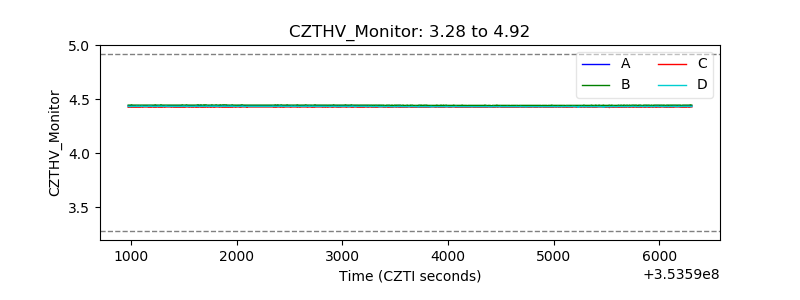 |
| D_VDD |  |
| Temperature 1 |  |
| Veto HV Monitor | 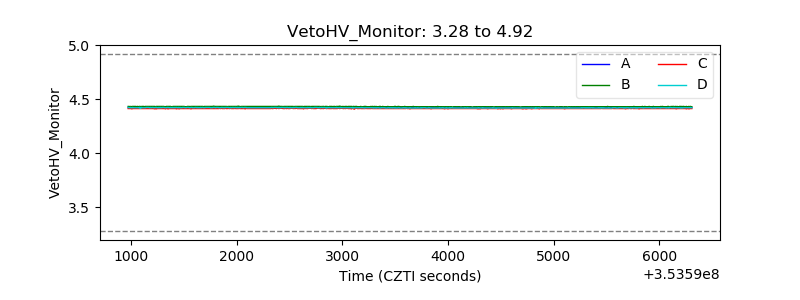 |
| Veto LLD | 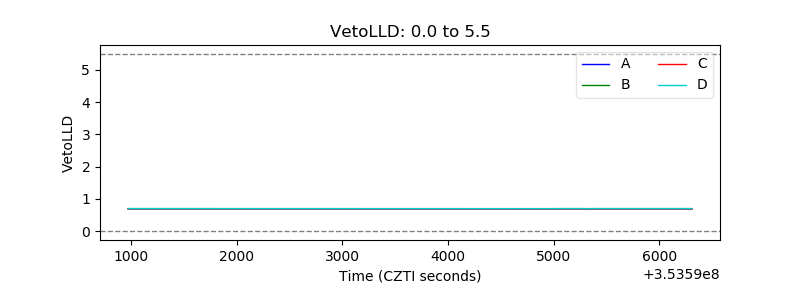 |
| Alpha Counter |  |
| _CPM_Rate |  |
| CZT Counter |  |
| +2.5 Volts monitor |  |
| +5 Volts monitor |  |
| _ROLL_ROT |  |
| _Roll_DEC |  |
| _Roll_RA | 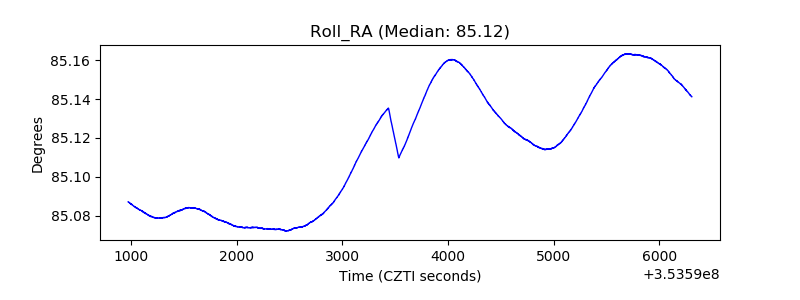 |
| Veto Counter | 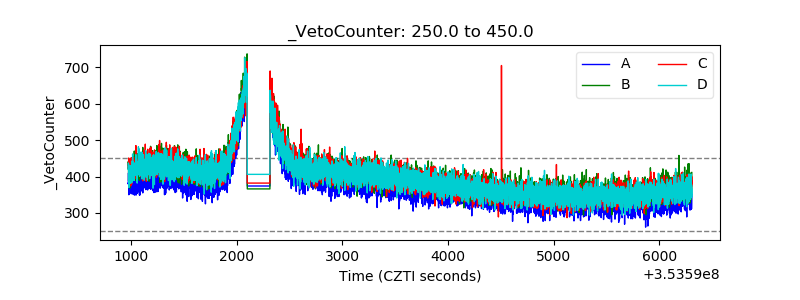 |