| Param | Original file | Final file |
|---|---|---|
| Filename | modeM0/AS1A10_094T09_9000004256_29549cztM0_level2.evt | modeM0/AS1A10_094T09_9000004256_29549cztM0_level2_quad_clean.evt |
| Size (bytes) | 298,972,800 | 38,306,880 |
| Size | 285.1 MB | 36.5 MB |
| Events in quadrant A | 1,623,721 | 248,110 |
| Events in quadrant B | 1,512,292 | 254,479 |
| Events in quadrant C | 1,715,080 | 228,274 |
| Events in quadrant D | 4,001,764 | 218,297 |
| Mode M0 | |||
|---|---|---|---|
| Quadrant | BADHDUFLAG | Total packets | Discarded packets |
| A | 0 | 6676 | 1 |
| B | 0 | 6274 | 1 |
| C | 0 | 7007 | 1 |
| D | 0 | 13939 | 1 |
| Mode SS | |||
|---|---|---|---|
| Quadrant | BADHDUFLAG | Total packets | Discarded packets |
| A | 0 | 62 | 0 |
| B | 0 | 62 | 0 |
| C | 0 | 62 | 0 |
| D | 0 | 62 | 0 |
| Mode M9 | |||
|---|---|---|---|
| Quadrant | BADHDUFLAG | Total packets | Discarded packets |
| A | 0 | 2 | 0 |
| B | 0 | 2 | 0 |
| C | 0 | 2 | 0 |
| D | 0 | 2 | 0 |
| Quadrant | Total seconds | Saturated seconds | Saturation percentage |
|---|---|---|---|
| A | 2944 | 131 | 4.449728% |
| B | 2943 | 124 | 4.213388% |
| C | 2943 | 544 | 18.484540% |
| D | 2943 | 496 | 16.853551% |
Noise dominated data is calculated using 1-second bins in cleaned event files. If a bin has >2000 counts, and if more than 50% of those come from <1% of pixels, then it is considered to be noise-dominated and hence unusable.
| Quadrant | # 1 sec bins | Bins with >0 counts | Bins with >2000 counts | High rate bins dominated by noise | Noise dominated (total time) | Noise dominated (detector-on time) | Marked lightcurve |
|---|---|---|---|---|---|---|---|
| A | 3159 | 2945 | 8 | 8 | 0.25% | 0.27% |  |
| B | 3158 | 2944 | 4 | 4 | 0.13% | 0.14% |  |
| C | 3158 | 2944 | 0 | 0 | 0.00% | 0.00% |  |
| D | 3158 | 2944 | 356 | 356 | 11.27% | 12.09% |  |
Top three noisy pixels from each quadrant. If the there are fewer than three noisy pixels in the level2.evt file, extra rows are filled as -1
| Pixel properties | Quadrant properties | ||||||
|---|---|---|---|---|---|---|---|
| Quadrant | DetID | PixID | Counts | Sigma | Mean | Median | Sigma |
| A | 0 | 13 | 160375 | 2053.59 | 377 | 368 | 77.9 |
| A | 13 | 254 | 5870 | 70.61 | 377 | 368 | 77.9 |
| A | 3 | 137 | 3895 | 45.27 | 377 | 368 | 77.9 |
| B | 5 | 255 | 27583 | 362.2 | 372 | 361 | 75.2 |
| B | 0 | 156 | 14656 | 190.2 | 372 | 361 | 75.2 |
| B | 12 | 111 | 9140 | 116.81 | 372 | 361 | 75.2 |
| C | 14 | 238 | 157728 | 1926.43 | 341 | 340 | 81.7 |
| C | 14 | 254 | 146063 | 1783.65 | 341 | 340 | 81.7 |
| C | 7 | 247 | 66390 | 808.45 | 341 | 340 | 81.7 |
| D | 8 | 195 | 2380881 | 26902.13 | 361 | 349 | 88.5 |
| D | 12 | 33 | 73124 | 822.42 | 361 | 349 | 88.5 |
| D | 7 | 80 | 63272 | 711.09 | 361 | 349 | 88.5 |
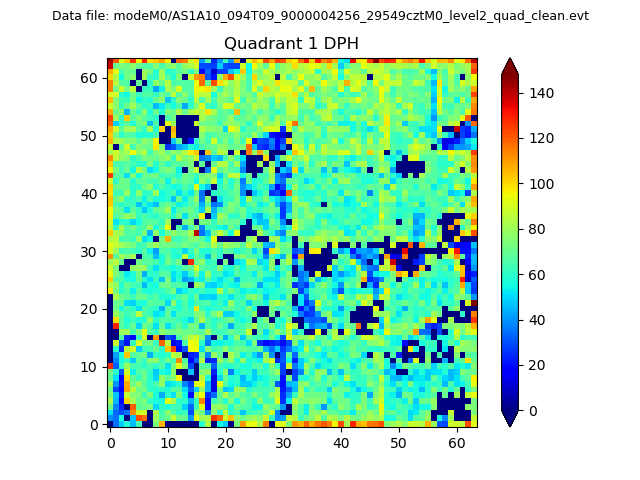
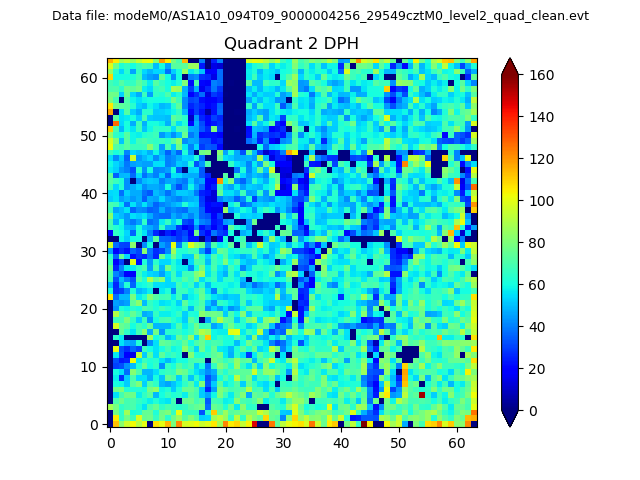
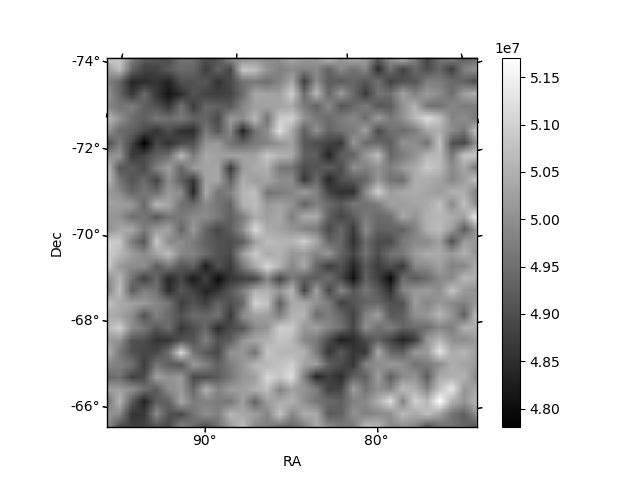
Histogram calculated using DETX and DETY for each event in the final _common_clean file
| Quadrant A | 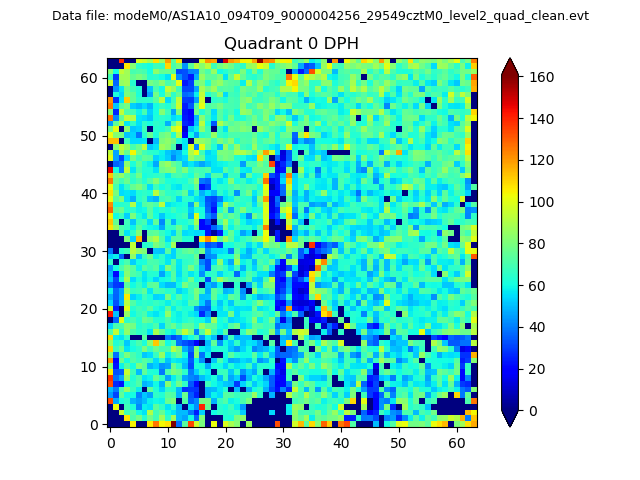 |
 |
Quadrant B |
|---|---|---|---|
| Quadrant D | 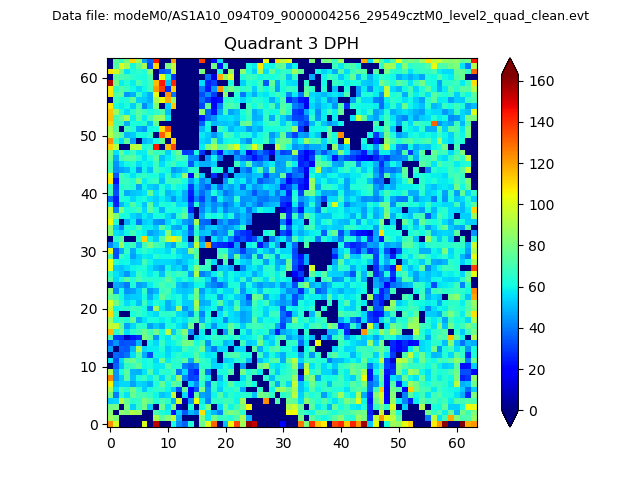 |
 |
Quadrant C |
| Plot type | Count rate plots | Images |
|---|---|---|
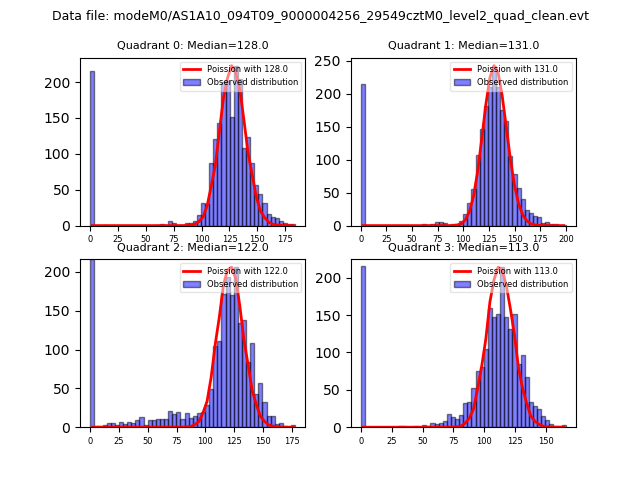
| Comparison with Poisson distribution Blue bars denote a histogram of data divided into 1 sec bins. Red curve is a Poisson curve with rate = median count rate of data. |
 |
 |
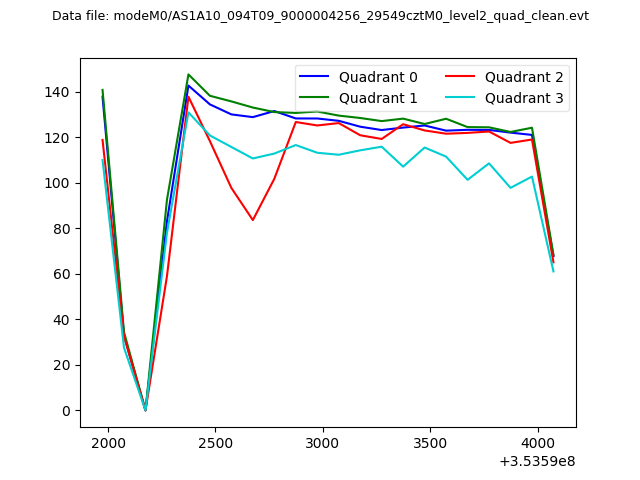
| Quadrant-wise count rates Data is divided into 100 sec bins |
 |
|
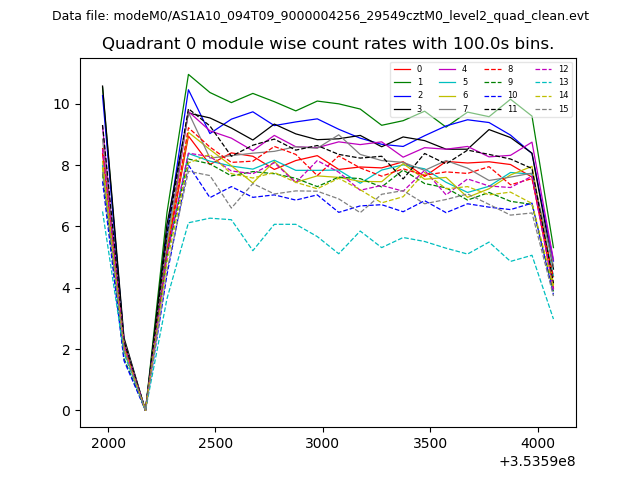
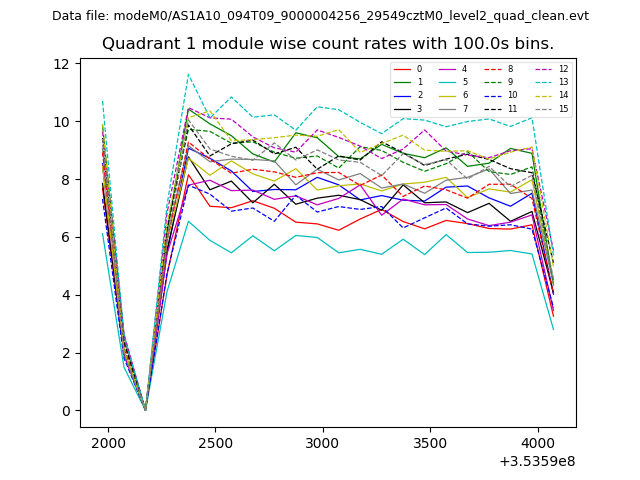
| Module-wise count rates for Quadrant A Data is divided into 100 sec bins |
 |
 |
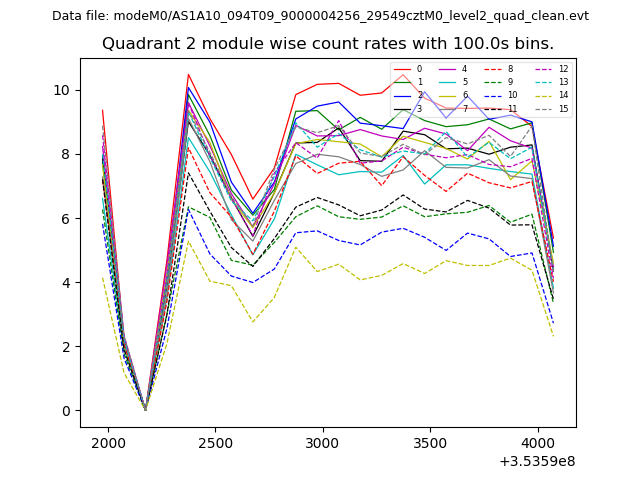
| Module-wise count rates for Quadrant B Data is divided into 100 sec bins |
 |
 |
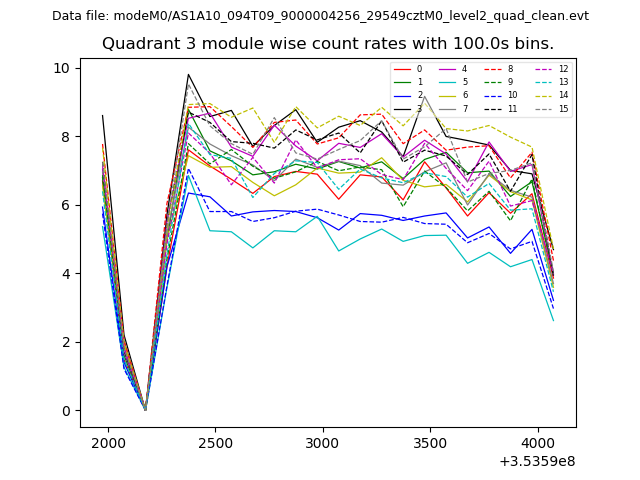
| Module-wise count rates for Quadrant C Data is divided into 100 sec bins |
 |
 |
| Module-wise count rates for Quadrant D Data is divided into 100 sec bins |
 |
 |
| Parameter | Plot |
|---|---|
| CZT HV Monitor | 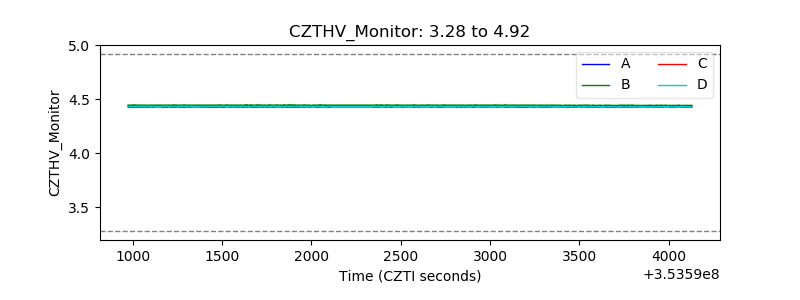 |
| D_VDD | 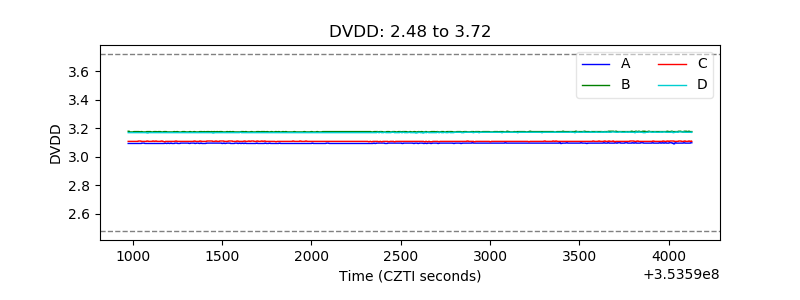 |
| Temperature 1 | 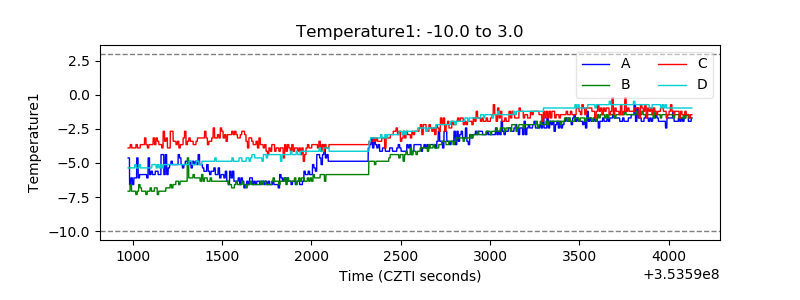 |
| Veto HV Monitor | 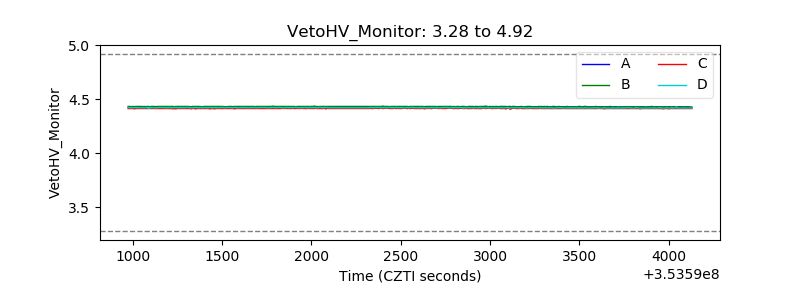 |
| Veto LLD | 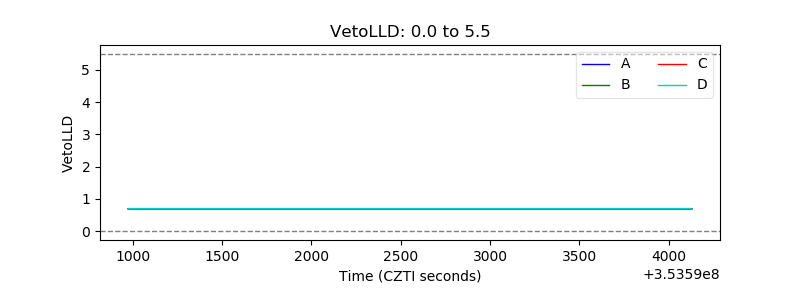 |
| Alpha Counter | 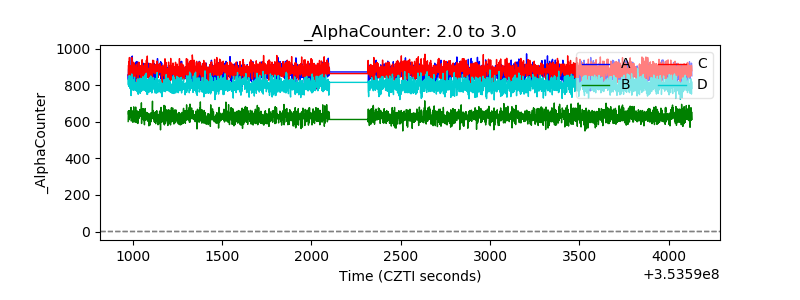 |
| _CPM_Rate | 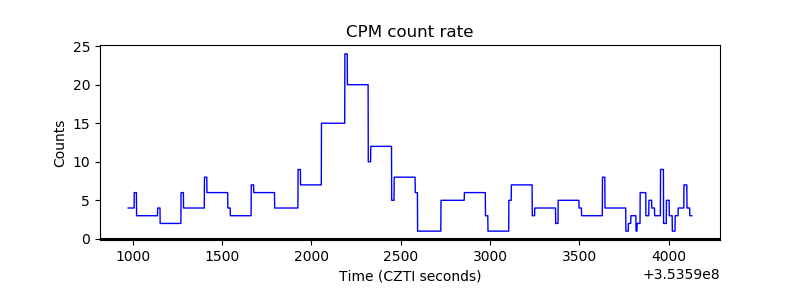 |
| CZT Counter | 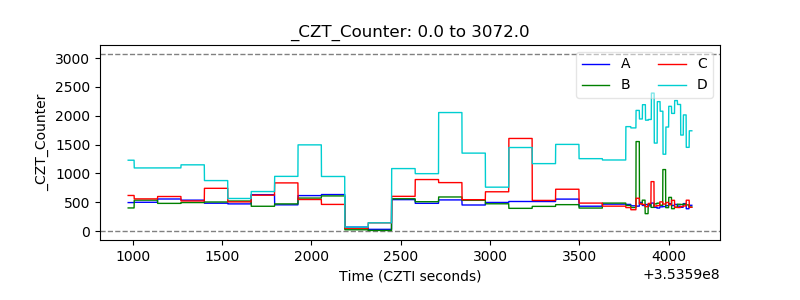 |
| +2.5 Volts monitor |  |
| +5 Volts monitor |  |
| _ROLL_ROT | 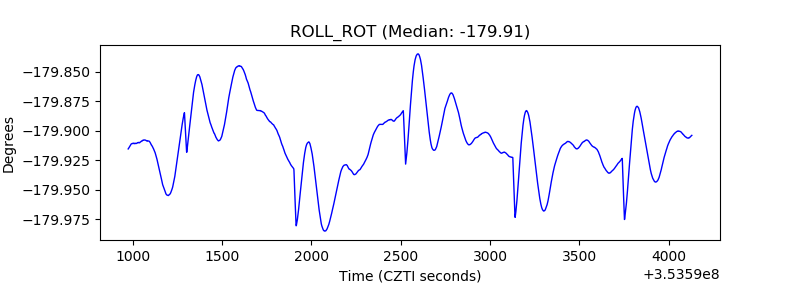 |
| _Roll_DEC | 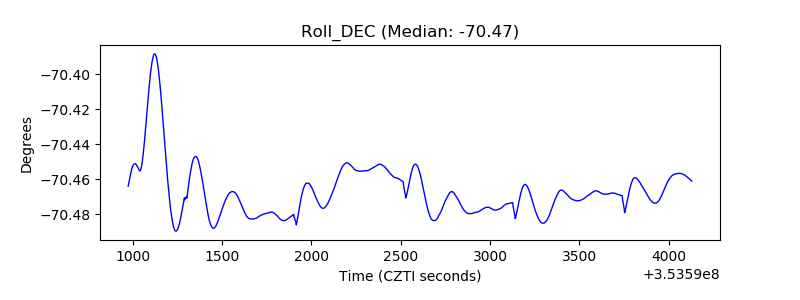 |
| _Roll_RA | 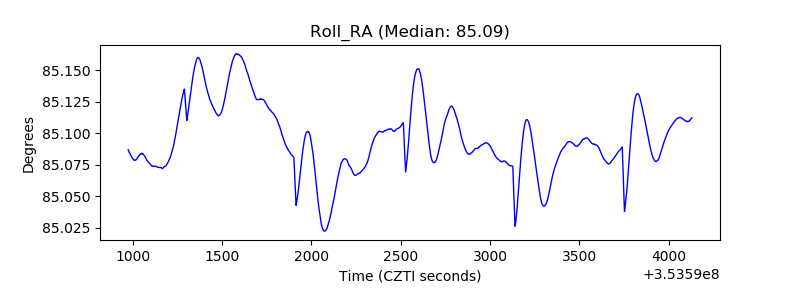 |
| Veto Counter | 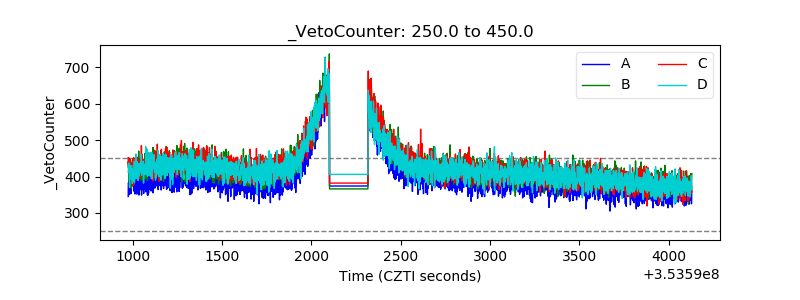 |