| Param | Original file | Final file |
|---|---|---|
| Filename | modeM0/AS1A10_094T09_9000004256_29551cztM0_level2.evt | modeM0/AS1A10_094T09_9000004256_29551cztM0_level2_quad_clean.evt |
| Size (bytes) | 322,752,960 | 55,111,680 |
| Size | 307.8 MB | 52.6 MB |
| Events in quadrant A | 1,332,621 | 377,466 |
| Events in quadrant B | 1,500,654 | 379,890 |
| Events in quadrant C | 1,465,811 | 360,062 |
| Events in quadrant D | 5,264,751 | 330,901 |
| Mode M0 | |||
|---|---|---|---|
| Quadrant | BADHDUFLAG | Total packets | Discarded packets |
| A | 0 | 6212 | 0 |
| B | 0 | 6611 | 0 |
| C | 0 | 6516 | 0 |
| D | 0 | 17798 | 0 |
| Mode SS | |||
|---|---|---|---|
| Quadrant | BADHDUFLAG | Total packets | Discarded packets |
| A | 0 | 62 | 0 |
| B | 0 | 62 | 0 |
| C | 0 | 62 | 0 |
| D | 0 | 62 | 0 |
| Quadrant | Total seconds | Saturated seconds | Saturation percentage |
|---|---|---|---|
| A | 3094 | 1 | 0.032321% |
| B | 3094 | 17 | 0.549451% |
| C | 3094 | 113 | 3.652230% |
| D | 3095 | 418 | 13.505654% |
Noise dominated data is calculated using 1-second bins in cleaned event files. If a bin has >2000 counts, and if more than 50% of those come from <1% of pixels, then it is considered to be noise-dominated and hence unusable.
| Quadrant | # 1 sec bins | Bins with >0 counts | Bins with >2000 counts | High rate bins dominated by noise | Noise dominated (total time) | Noise dominated (detector-on time) | Marked lightcurve |
|---|---|---|---|---|---|---|---|
| A | 3094 | 3094 | 0 | 0 | 0.00% | 0.00% | 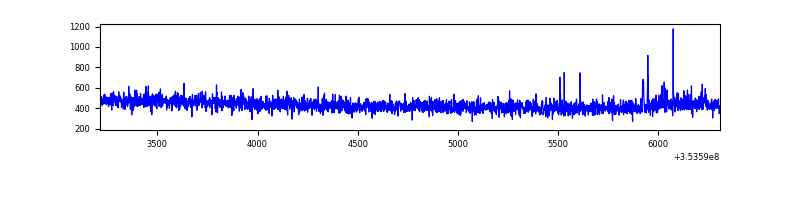 |
| B | 3094 | 3094 | 11 | 11 | 0.36% | 0.36% | 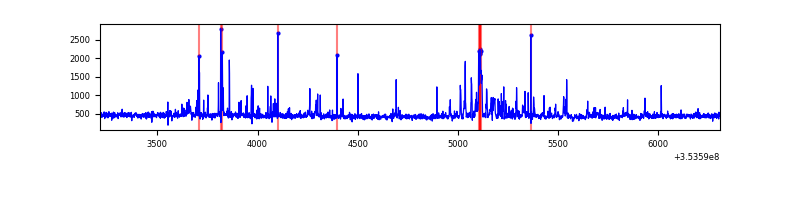 |
| C | 3094 | 3094 | 0 | 0 | 0.00% | 0.00% | 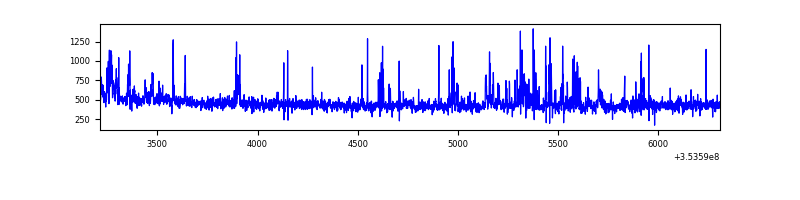 |
| D | 3095 | 3095 | 761 | 761 | 24.59% | 24.59% |  |
Top three noisy pixels from each quadrant. If the there are fewer than three noisy pixels in the level2.evt file, extra rows are filled as -1
| Pixel properties | Quadrant properties | ||||||
|---|---|---|---|---|---|---|---|
| Quadrant | DetID | PixID | Counts | Sigma | Mean | Median | Sigma |
| A | 0 | 13 | 16818 | 234.14 | 340 | 333 | 70.4 |
| A | 13 | 254 | 6249 | 84.03 | 340 | 333 | 70.4 |
| A | 3 | 137 | 3357 | 42.95 | 340 | 333 | 70.4 |
| B | 5 | 255 | 151354 | 2282.56 | 335 | 327 | 66.2 |
| B | 0 | 156 | 15085 | 223.05 | 335 | 327 | 66.2 |
| B | 12 | 111 | 7826 | 113.34 | 335 | 327 | 66.2 |
| C | 14 | 238 | 100794 | 1332.33 | 313 | 315 | 75.4 |
| C | 14 | 254 | 69787 | 921.18 | 313 | 315 | 75.4 |
| C | 7 | 247 | 50734 | 668.54 | 313 | 315 | 75.4 |
| D | 8 | 195 | 3744723 | 48595.03 | 313 | 304 | 77.1 |
| D | 12 | 33 | 147625 | 1911.93 | 313 | 304 | 77.1 |
| D | 7 | 238 | 43114 | 555.59 | 313 | 304 | 77.1 |
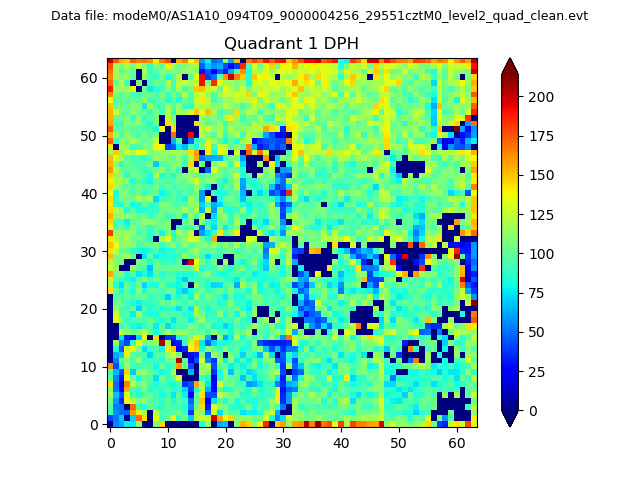
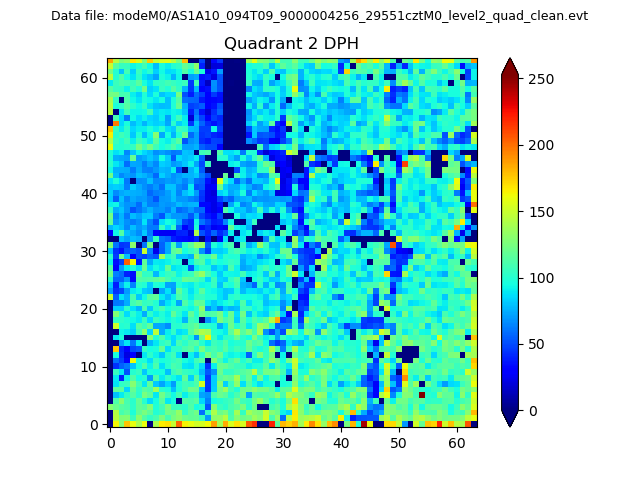
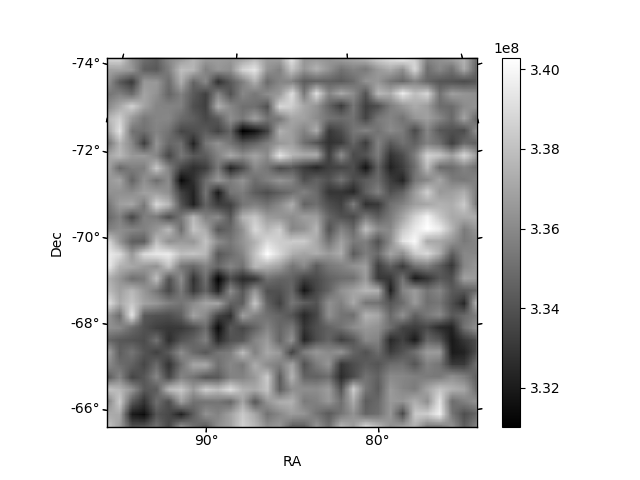
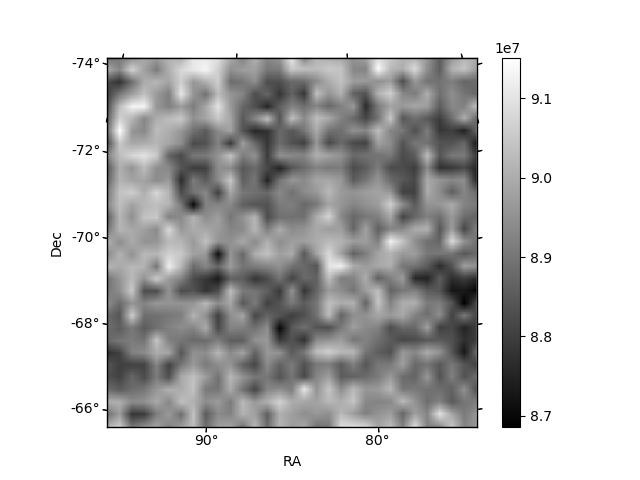
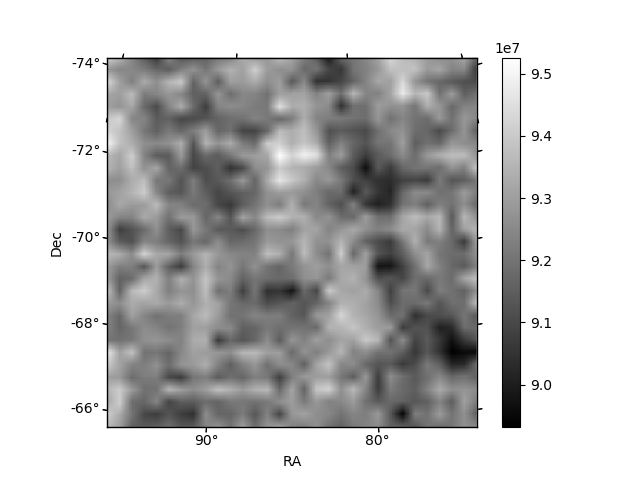
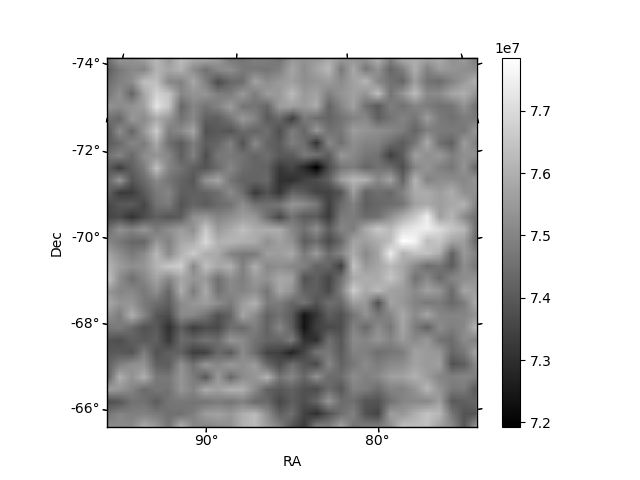
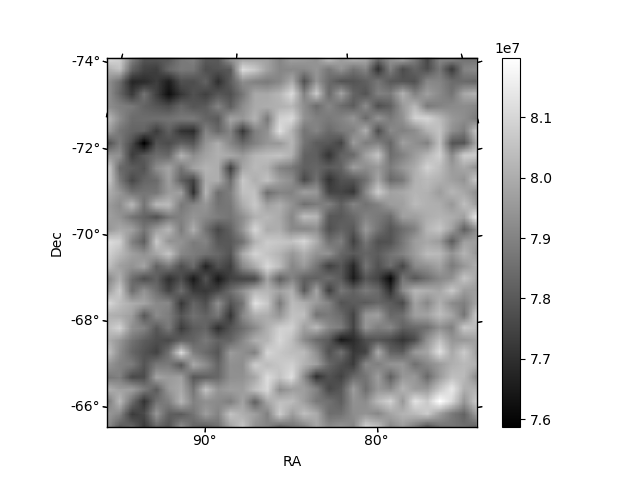
Histogram calculated using DETX and DETY for each event in the final _common_clean file
| Quadrant A | 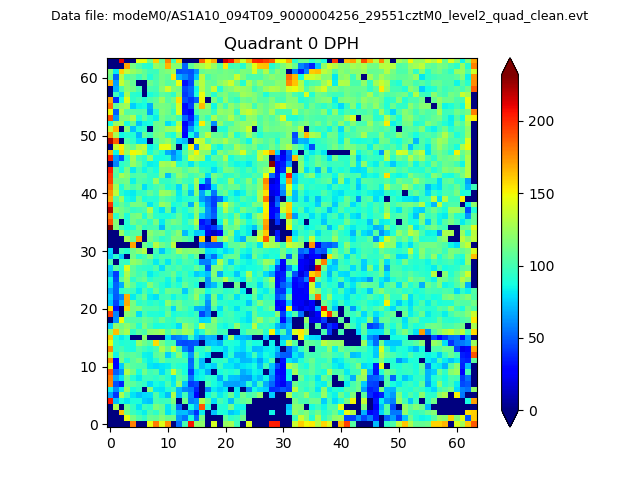 |
 |
Quadrant B |
|---|---|---|---|
| Quadrant D | 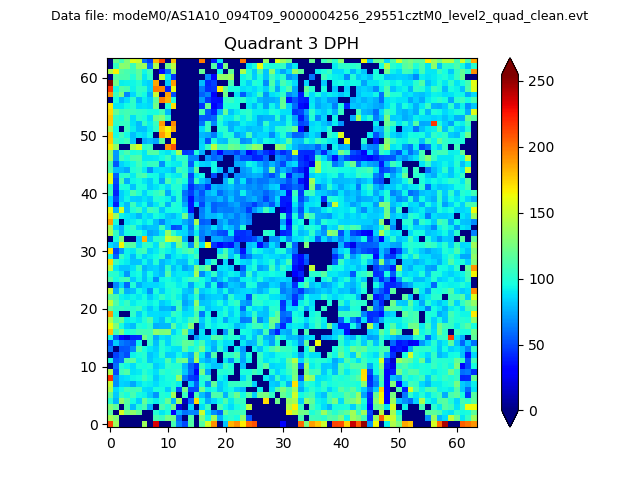 |
 |
Quadrant C |
| Plot type | Count rate plots | Images |
|---|---|---|
| Comparison with Poisson distribution Blue bars denote a histogram of data divided into 1 sec bins. Red curve is a Poisson curve with rate = median count rate of data. |
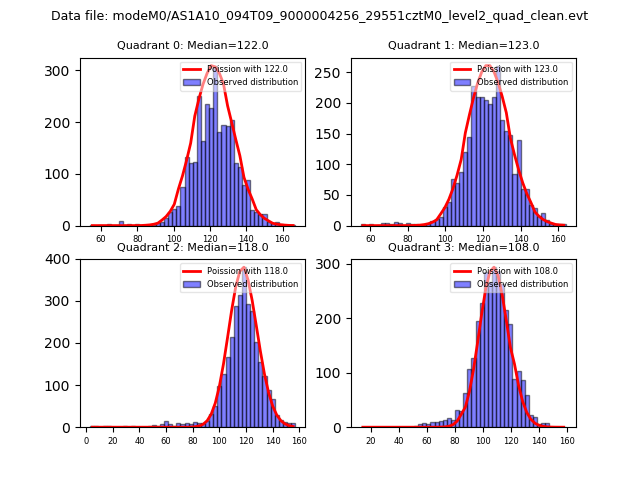 |
 |
| Quadrant-wise count rates Data is divided into 100 sec bins |
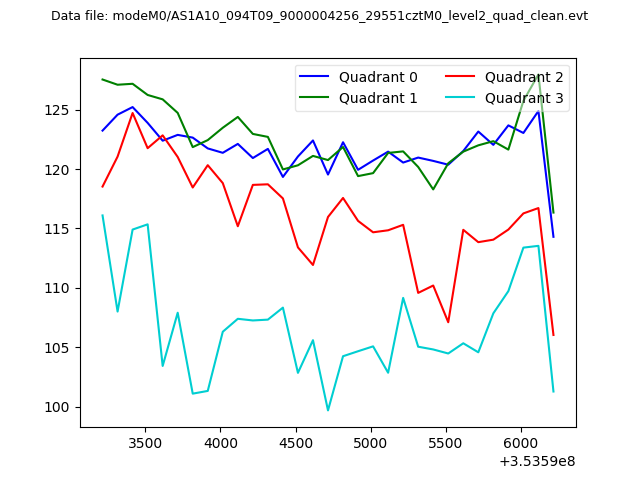 |
|
| Module-wise count rates for Quadrant A Data is divided into 100 sec bins |
 |
 |
| Module-wise count rates for Quadrant B Data is divided into 100 sec bins |
 |
 |
| Module-wise count rates for Quadrant C Data is divided into 100 sec bins |
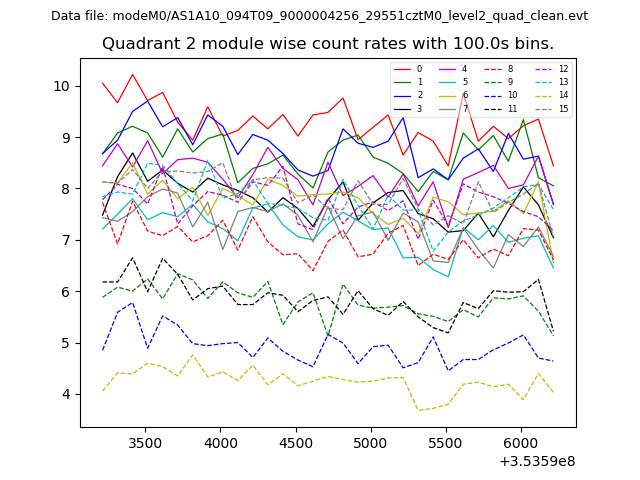 |
 |
| Module-wise count rates for Quadrant D Data is divided into 100 sec bins |
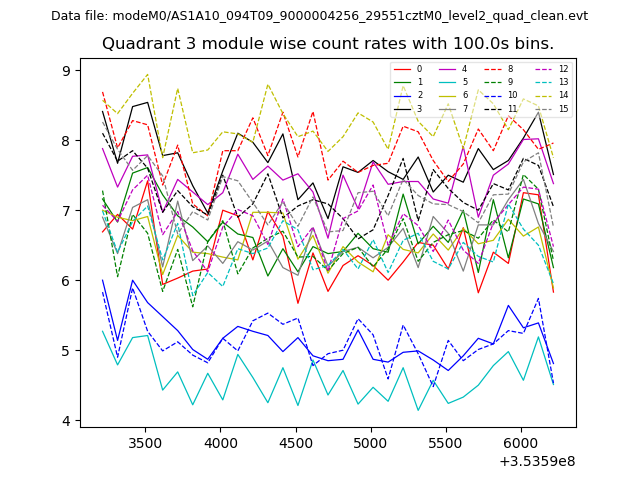 |
 |
| Parameter | Plot |
|---|---|
| CZT HV Monitor | 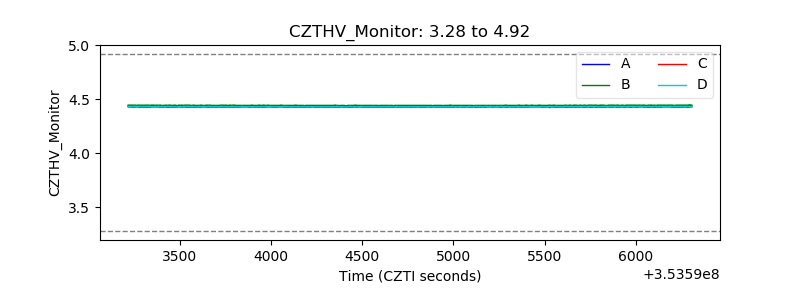 |
| D_VDD |  |
| Temperature 1 | 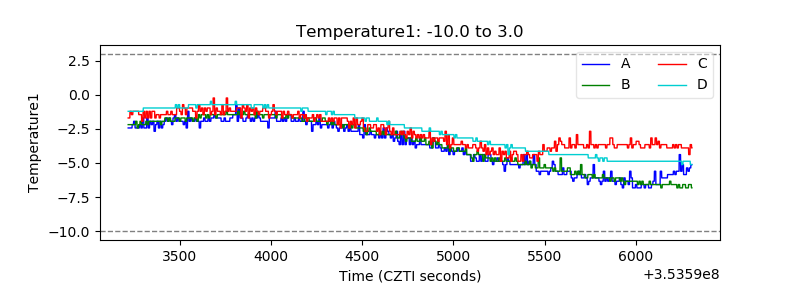 |
| Veto HV Monitor | 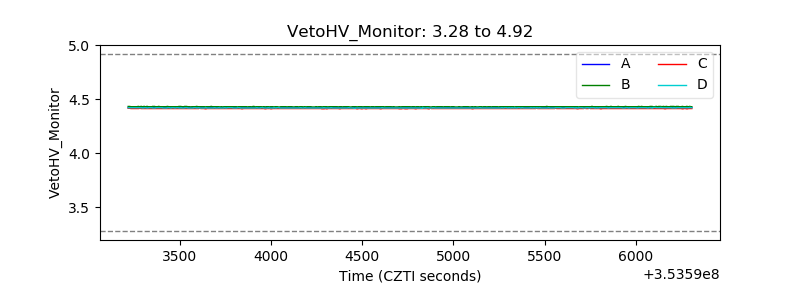 |
| Veto LLD | 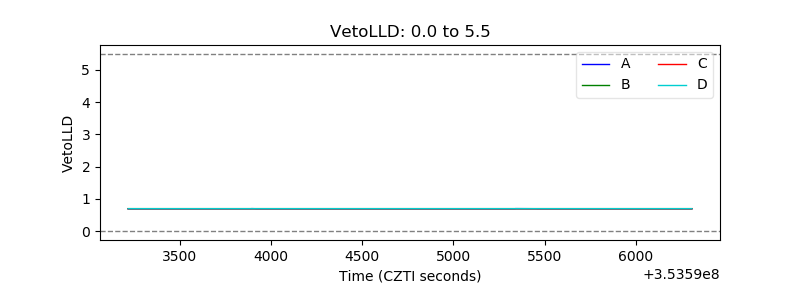 |
| Alpha Counter | 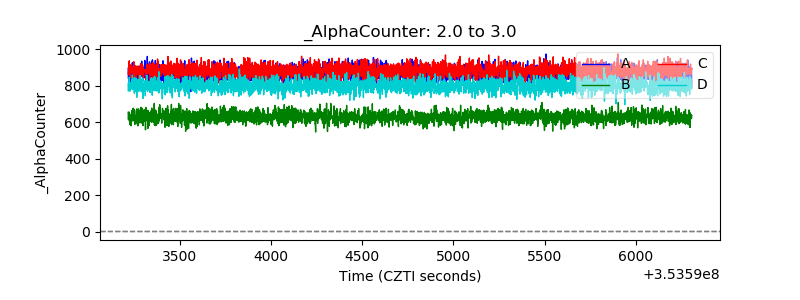 |
| _CPM_Rate | 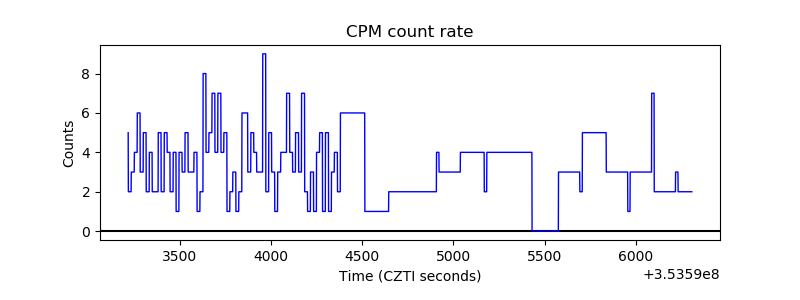 |
| CZT Counter | 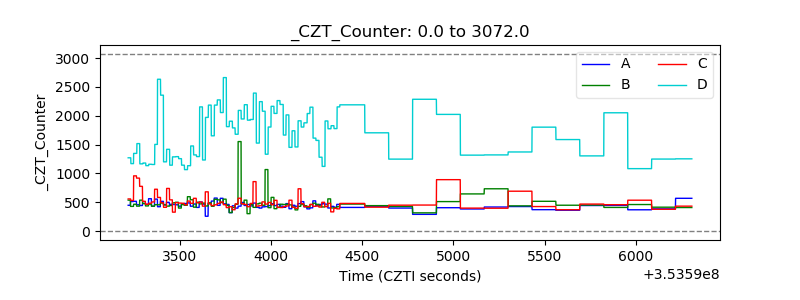 |
| +2.5 Volts monitor |  |
| +5 Volts monitor |  |
| _ROLL_ROT | 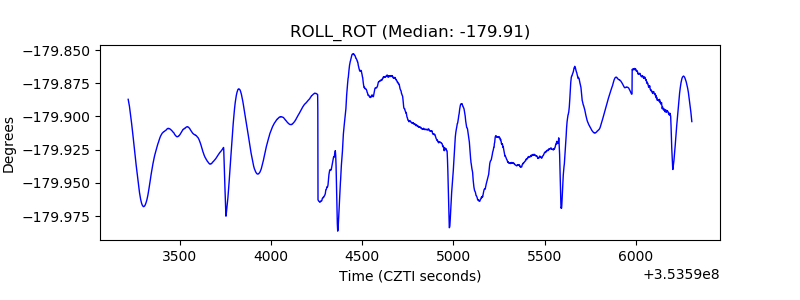 |
| _Roll_DEC | 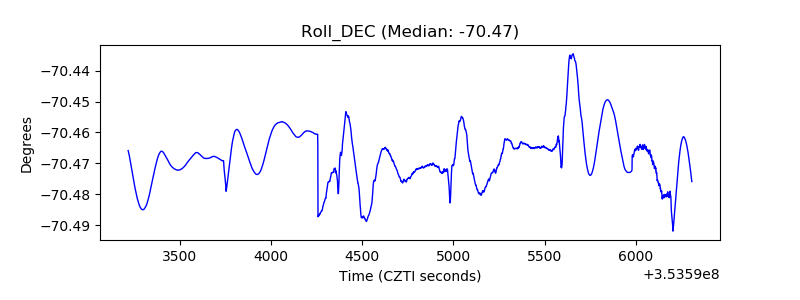 |
| _Roll_RA | 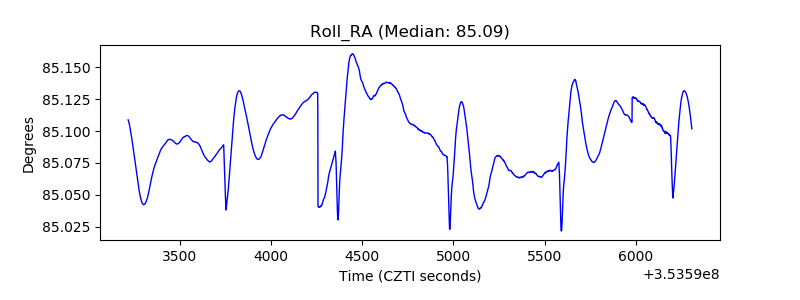 |
| Veto Counter | 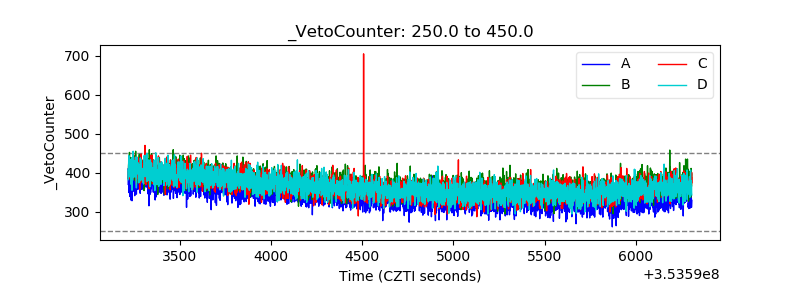 |