| Param | Original file | Final file |
|---|---|---|
| Filename | modeM0/AS1A10_094T10_9000004262cztM0_level2.fits | modeM0/AS1A10_094T10_9000004262cztM0_level2_quad_clean.evt |
| Size (bytes) | 46,313,280 | 28,071,360 |
| Size | 44.2 MB | 26.8 MB |
| Events in quadrant A | 290,422 | 140,002 |
| Events in quadrant B | 279,682 | 142,020 |
| Events in quadrant C | 276,982 | 128,288 |
| Events in quadrant D | 228,986 | 112,042 |
| Mode SS | |||
|---|---|---|---|
| Quadrant | BADHDUFLAG | Total packets | Discarded packets |
| A | 0 | 96 | 0 |
| B | 0 | 96 | 0 |
| C | 0 | 96 | 0 |
| D | 0 | 96 | 0 |
| Mode M0 | |||
|---|---|---|---|
| Quadrant | BADHDUFLAG | Total packets | Discarded packets |
| A | 0 | 9584 | 0 |
| B | 0 | 9770 | 0 |
| C | 0 | 10064 | 0 |
| D | 0 | 23626 | 0 |
| Mode M9 | |||
|---|---|---|---|
| Quadrant | BADHDUFLAG | Total packets | Discarded packets |
| A | 0 | 11 | 0 |
| B | 0 | 11 | 0 |
| C | 0 | 11 | 0 |
| D | 0 | 11 | 0 |
| Quadrant | Total seconds | Saturated seconds | Saturation percentage |
|---|---|---|---|
| A | 4645 | 8 | 0.172228% |
| B | 4645 | 17 | 0.365985% |
| C | 4645 | 216 | 4.650161% |
| D | 4645 | 451 | 9.709365% |
Noise dominated data is calculated using 1-second bins in cleaned event files. If a bin has >2000 counts, and if more than 50% of those come from <1% of pixels, then it is considered to be noise-dominated and hence unusable.
| Quadrant | # 1 sec bins | Bins with >0 counts | Bins with >2000 counts | High rate bins dominated by noise | Noise dominated (total time) | Noise dominated (detector-on time) | Marked lightcurve |
|---|---|---|---|---|---|---|---|
| A | 5780 | 4645 | 0 | 0 | 0.00% | 0.00% |  |
| B | 5780 | 4645 | 0 | 0 | 0.00% | 0.00% |  |
| C | 5780 | 4642 | 0 | 0 | 0.00% | 0.00% |  |
| D | 5780 | 4645 | 0 | 0 | 0.00% | 0.00% |  |
Top three noisy pixels from each quadrant. If the there are fewer than three noisy pixels in the level2.evt file, extra rows are filled as -1
| Pixel properties | Quadrant properties | ||||||
|---|---|---|---|---|---|---|---|
| Quadrant | DetID | PixID | Counts | Sigma | Mean | Median | Sigma |
| A | 0 | 29 | 257 | 9.26 | 75 | 71 | 20.1 |
| A | 7 | 110 | 237 | 8.27 | 75 | 71 | 20.1 |
| A | 0 | 30 | 228 | 7.82 | 75 | 71 | 20.1 |
| B | 2 | 9 | 204 | 7.81 | 74 | 71 | 17.0 |
| B | 14 | 254 | 192 | 7.11 | 74 | 71 | 17.0 |
| B | 3 | 80 | 185 | 6.69 | 74 | 71 | 17.0 |
| C | 1 | 81 | 231 | 7.92 | 73 | 69 | 20.5 |
| C | 1 | 80 | 227 | 7.73 | 73 | 69 | 20.5 |
| C | 3 | 203 | 218 | 7.29 | 73 | 69 | 20.5 |
| D | 10 | 189 | 181 | 6.56 | 65 | 59 | 18.6 |
| D | 15 | 46 | 179 | 6.45 | 65 | 59 | 18.6 |
| D | 3 | 14 | 178 | 6.4 | 65 | 59 | 18.6 |
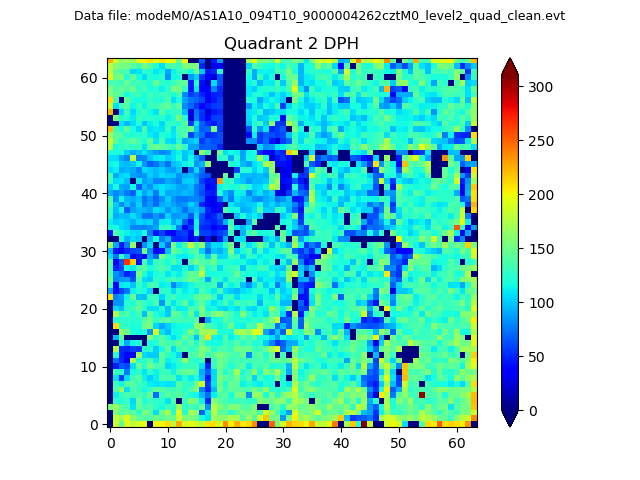
Histogram calculated using DETX and DETY for each event in the final _common_clean file
| Quadrant A | 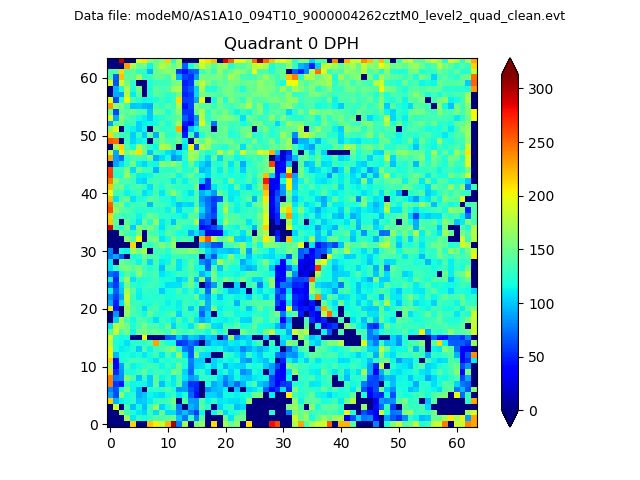 |
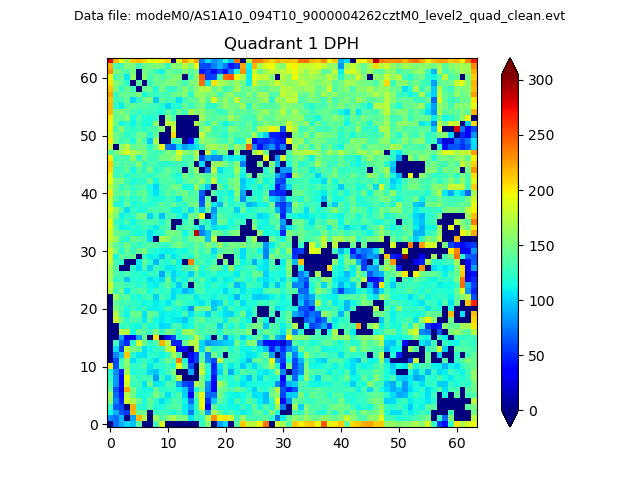 |
Quadrant B |
|---|---|---|---|
| Quadrant D | 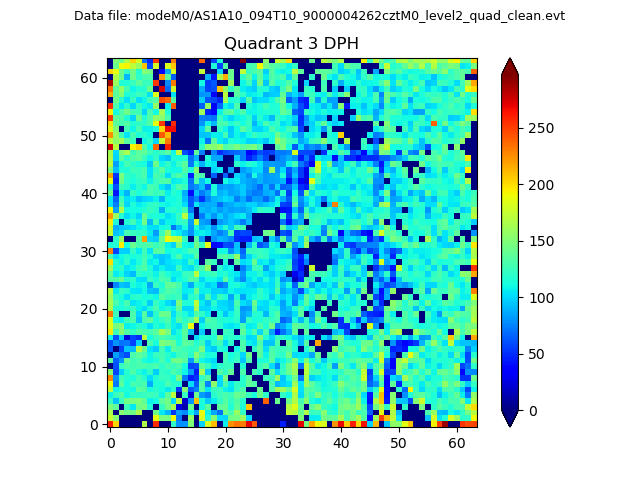 |
 |
Quadrant C |
| Plot type | Count rate plots | Images |
|---|---|---|
| Comparison with Poisson distribution Blue bars denote a histogram of data divided into 1 sec bins. Red curve is a Poisson curve with rate = median count rate of data. |
 |
 |
| Quadrant-wise count rates Data is divided into 100 sec bins |
 |
|
| Module-wise count rates for Quadrant A Data is divided into 100 sec bins |
 |
 |
| Module-wise count rates for Quadrant B Data is divided into 100 sec bins |
 |
 |
| Module-wise count rates for Quadrant C Data is divided into 100 sec bins |
 |
 |
| Module-wise count rates for Quadrant D Data is divided into 100 sec bins |
 |
 |
| Parameter | Plot |
|---|---|
| CZT HV Monitor |  |
| D_VDD |  |
| Temperature 1 |  |
| Veto HV Monitor |  |
| Veto LLD |  |
| Alpha Counter |  |
| _CPM_Rate |  |
| CZT Counter |  |
| +2.5 Volts monitor |  |
| +5 Volts monitor |  |
| _ROLL_ROT | 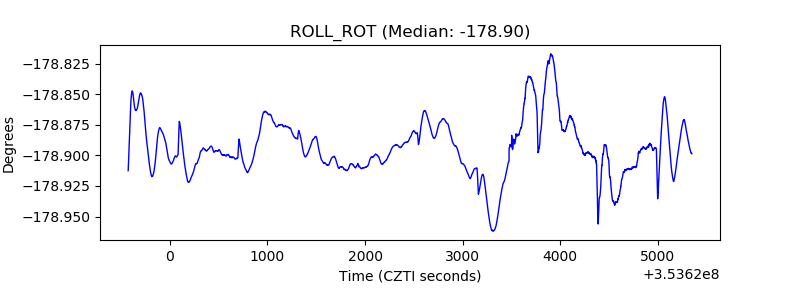 |
| _Roll_DEC |  |
| _Roll_RA |  |
| Veto Counter |  |