| Param | Original file | Final file |
|---|---|---|
| Filename | modeM0/AS1A10_094T10_9000004262_29556cztM0_level2.evt | modeM0/AS1A10_094T10_9000004262_29556cztM0_level2_quad_clean.evt |
| Size (bytes) | 168,721,920 | 32,607,360 |
| Size | 160.9 MB | 31.1 MB |
| Events in quadrant A | 766,890 | 228,673 |
| Events in quadrant B | 803,567 | 237,381 |
| Events in quadrant C | 848,779 | 214,528 |
| Events in quadrant D | 2,587,685 | 196,317 |
| Mode SS | |||
|---|---|---|---|
| Quadrant | BADHDUFLAG | Total packets | Discarded packets |
| A | 0 | 30 | 0 |
| B | 0 | 30 | 0 |
| C | 0 | 30 | 0 |
| D | 0 | 30 | 0 |
| Mode M0 | |||
|---|---|---|---|
| Quadrant | BADHDUFLAG | Total packets | Discarded packets |
| A | 0 | 3189 | 1 |
| B | 0 | 3318 | 1 |
| C | 0 | 3448 | 1 |
| D | 0 | 8745 | 1 |
| Mode M9 | |||
|---|---|---|---|
| Quadrant | BADHDUFLAG | Total packets | Discarded packets |
| A | 0 | 5 | 0 |
| B | 0 | 6 | 0 |
| C | 0 | 6 | 0 |
| D | 0 | 6 | 0 |
| Quadrant | Total seconds | Saturated seconds | Saturation percentage |
|---|---|---|---|
| A | 1483 | 8 | 0.539447% |
| B | 1483 | 10 | 0.674309% |
| C | 1483 | 136 | 9.170600% |
| D | 1483 | 220 | 14.834794% |
Noise dominated data is calculated using 1-second bins in cleaned event files. If a bin has >2000 counts, and if more than 50% of those come from <1% of pixels, then it is considered to be noise-dominated and hence unusable.
| Quadrant | # 1 sec bins | Bins with >0 counts | Bins with >2000 counts | High rate bins dominated by noise | Noise dominated (total time) | Noise dominated (detector-on time) | Marked lightcurve |
|---|---|---|---|---|---|---|---|
| A | 1483 | 1483 | 0 | 0 | 0.00% | 0.00% | 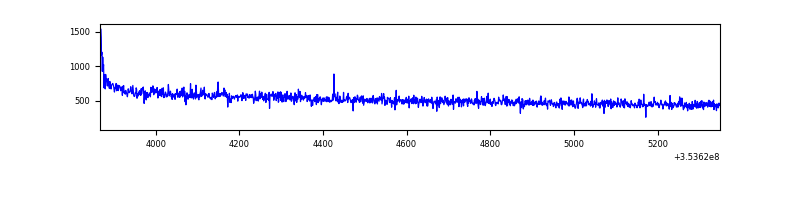 |
| B | 1483 | 1483 | 2 | 2 | 0.13% | 0.13% | 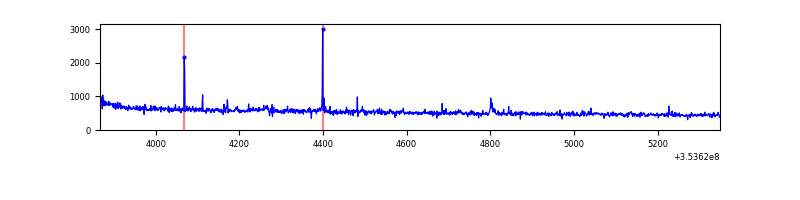 |
| C | 1483 | 1483 | 0 | 0 | 0.00% | 0.00% | 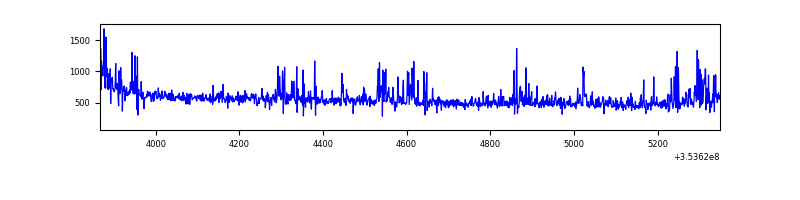 |
| D | 1483 | 1483 | 341 | 341 | 22.99% | 22.99% | 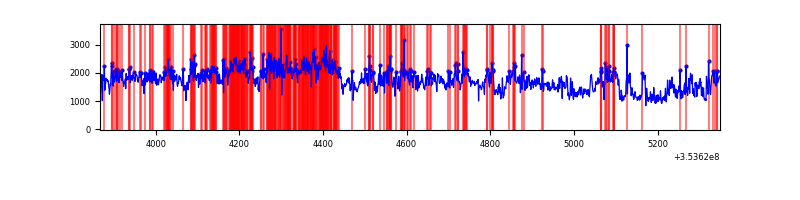 |
Top three noisy pixels from each quadrant. If the there are fewer than three noisy pixels in the level2.evt file, extra rows are filled as -1
| Pixel properties | Quadrant properties | ||||||
|---|---|---|---|---|---|---|---|
| Quadrant | DetID | PixID | Counts | Sigma | Mean | Median | Sigma |
| A | 8 | 192 | 3821 | 88.32 | 196 | 193 | 41.1 |
| A | 13 | 254 | 3298 | 75.59 | 196 | 193 | 41.1 |
| A | 14 | 239 | 2790 | 63.22 | 196 | 193 | 41.1 |
| B | 0 | 199 | 6091 | 150.27 | 199 | 194 | 39.2 |
| B | 0 | 189 | 5985 | 147.57 | 199 | 194 | 39.2 |
| B | 5 | 255 | 5483 | 134.78 | 199 | 194 | 39.2 |
| C | 14 | 238 | 67838 | 1568.31 | 178 | 179 | 43.1 |
| C | 14 | 254 | 52290 | 1207.91 | 178 | 179 | 43.1 |
| C | 3 | 233 | 22116 | 508.49 | 178 | 179 | 43.1 |
| D | 8 | 195 | 1816011 | 41244.81 | 178 | 173 | 44.0 |
| D | 13 | 153 | 45544 | 1030.55 | 178 | 173 | 44.0 |
| D | 5 | 233 | 16219 | 364.47 | 178 | 173 | 44.0 |
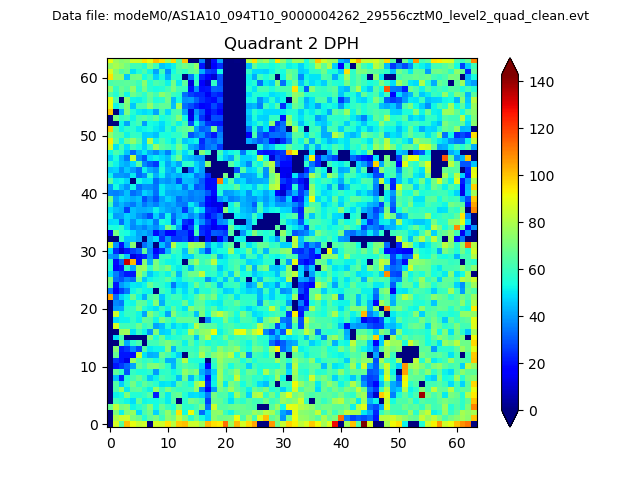
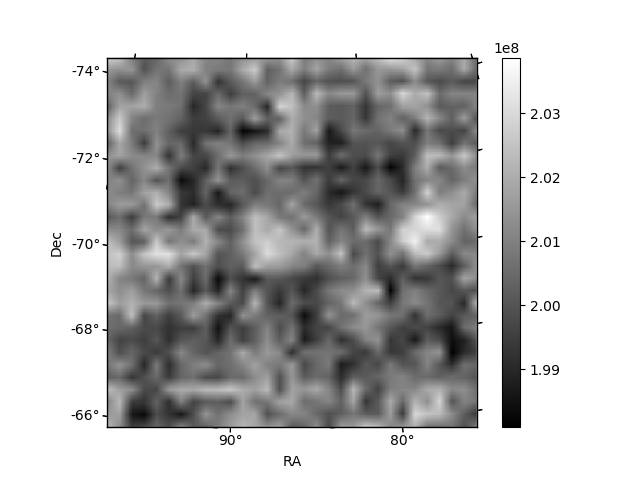
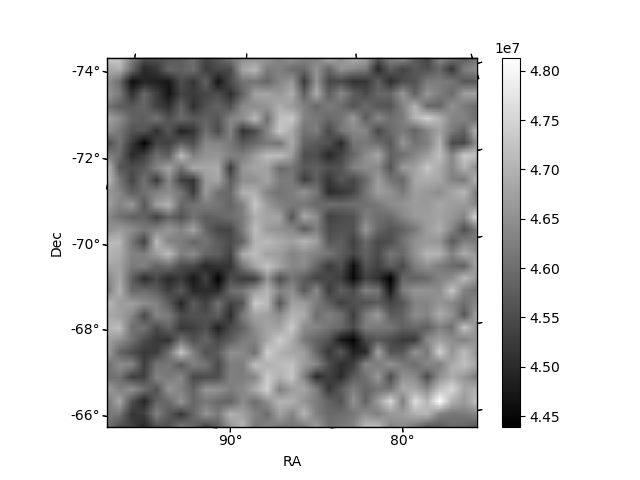
Histogram calculated using DETX and DETY for each event in the final _common_clean file
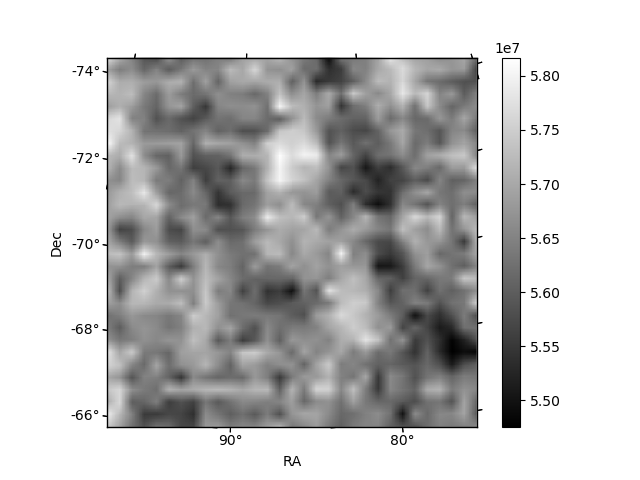
| Quadrant A | 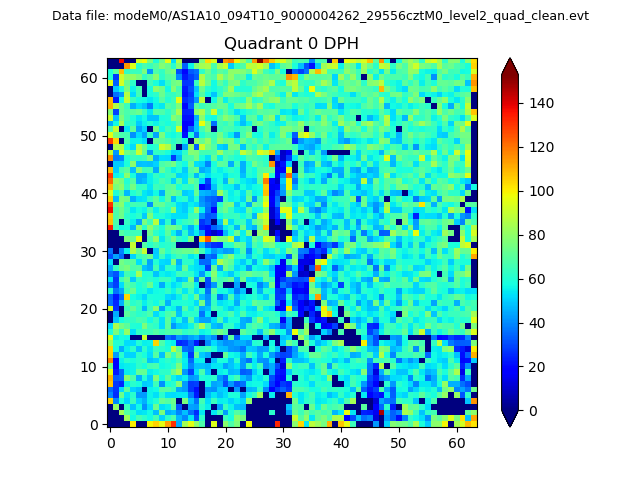 |
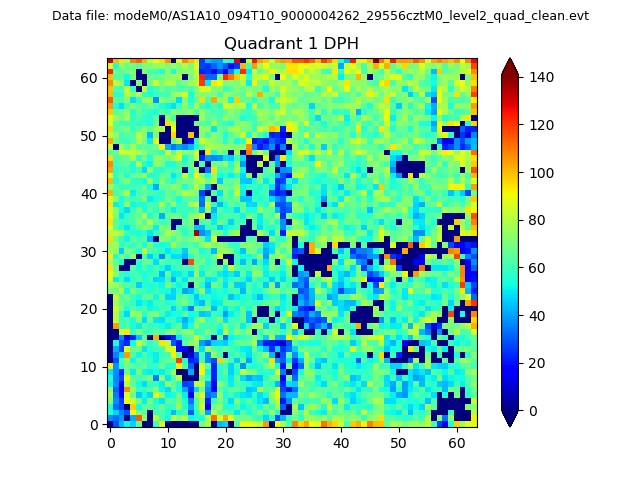 |
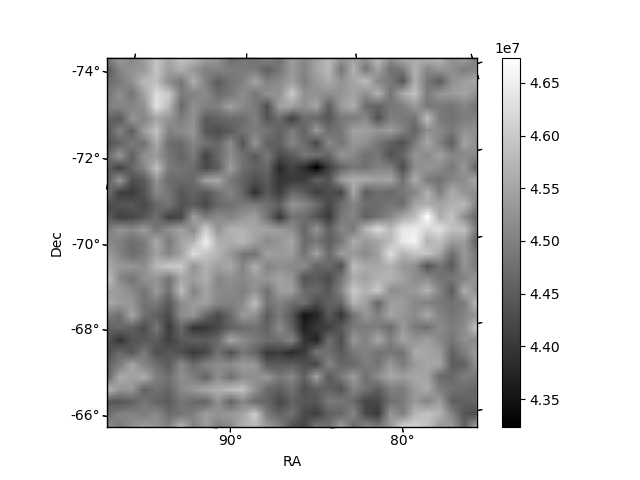
Quadrant B |
|---|---|---|---|
| Quadrant D | 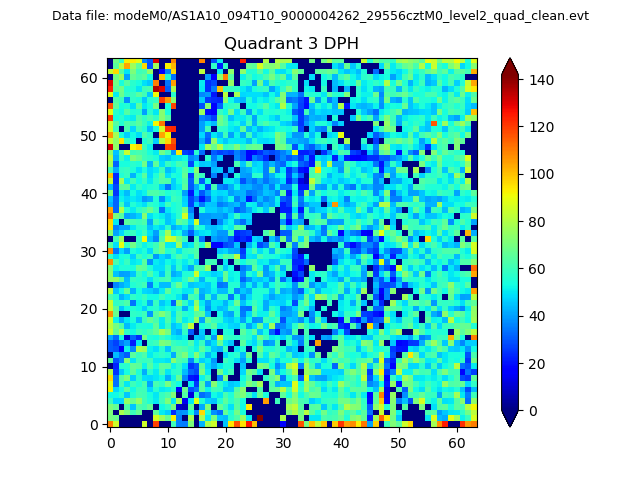 |
 |
Quadrant C |
| Plot type | Count rate plots | Images |
|---|---|---|
| Comparison with Poisson distribution Blue bars denote a histogram of data divided into 1 sec bins. Red curve is a Poisson curve with rate = median count rate of data. |
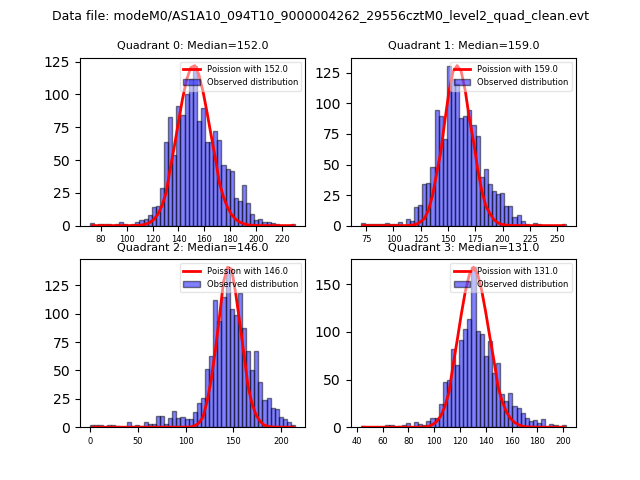 |
 |
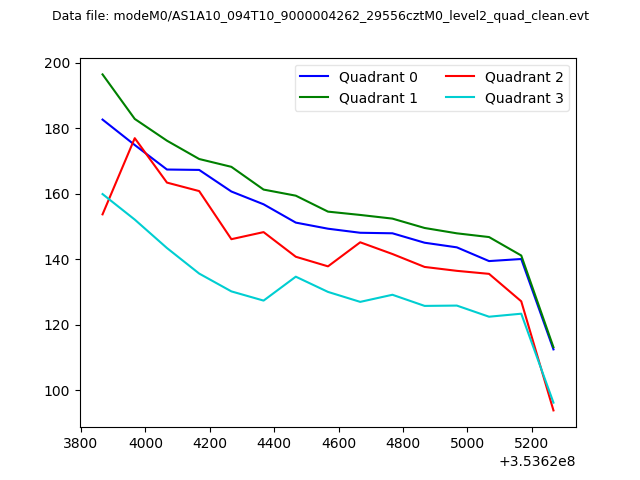
| Quadrant-wise count rates Data is divided into 100 sec bins |
 |
|
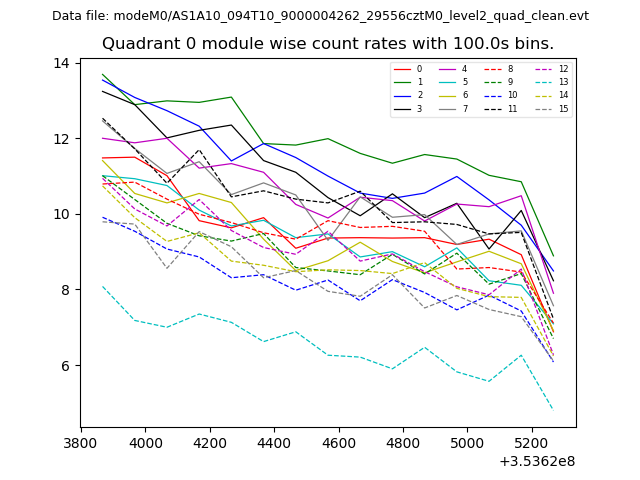
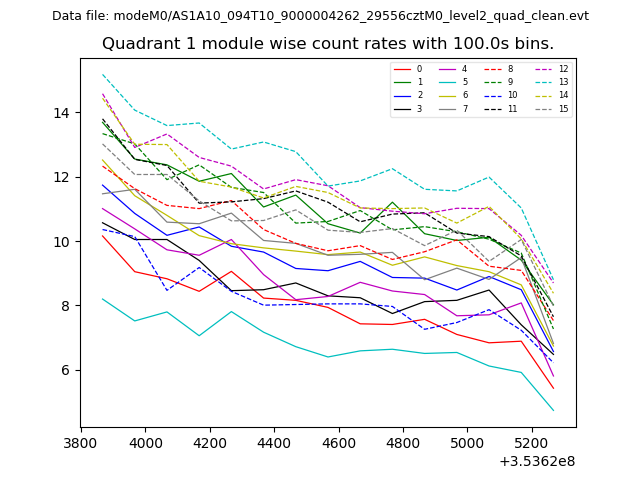
| Module-wise count rates for Quadrant A Data is divided into 100 sec bins |
 |
 |
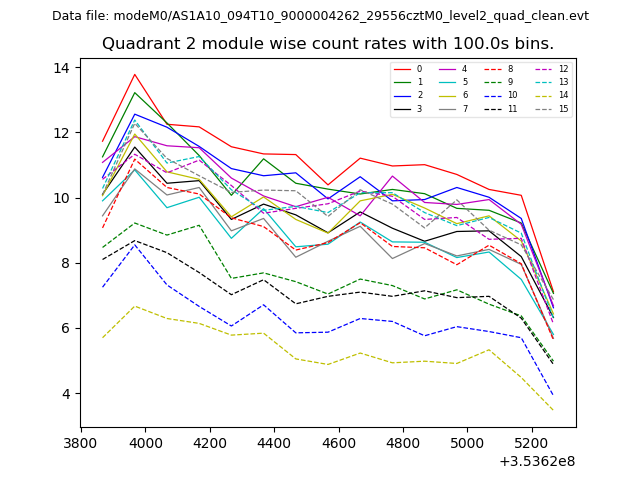
| Module-wise count rates for Quadrant B Data is divided into 100 sec bins |
 |
 |
| Module-wise count rates for Quadrant C Data is divided into 100 sec bins |
 |
 |
| Module-wise count rates for Quadrant D Data is divided into 100 sec bins |
 |
 |
| Parameter | Plot |
|---|---|
| CZT HV Monitor | 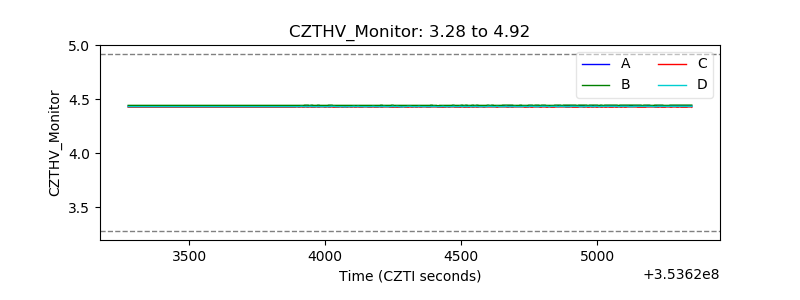 |
| D_VDD | 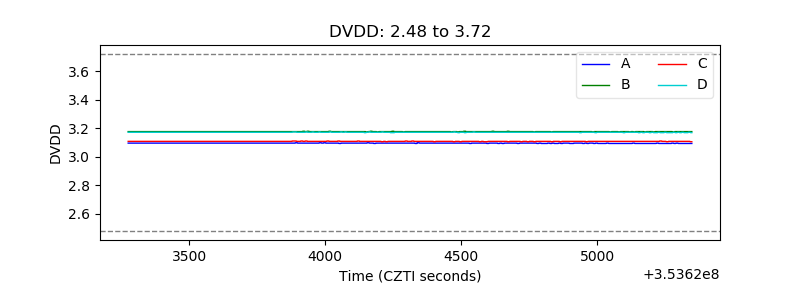 |
| Temperature 1 |  |
| Veto HV Monitor | 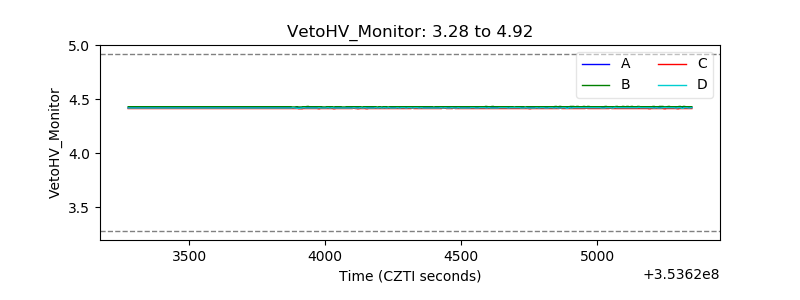 |
| Veto LLD | 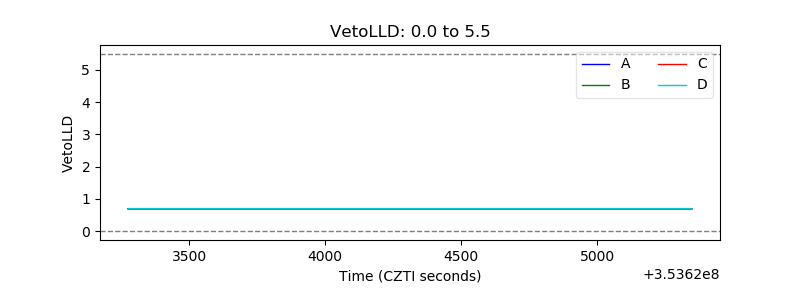 |
| Alpha Counter | 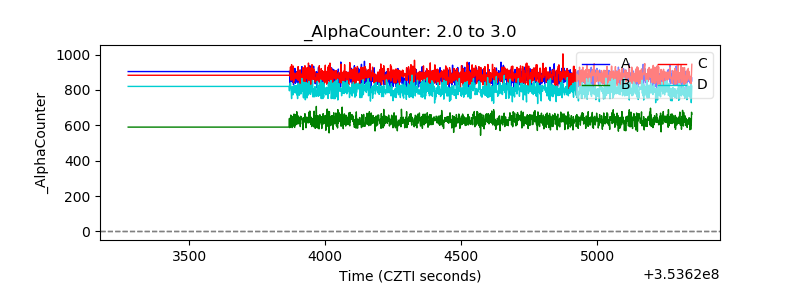 |
| _CPM_Rate | 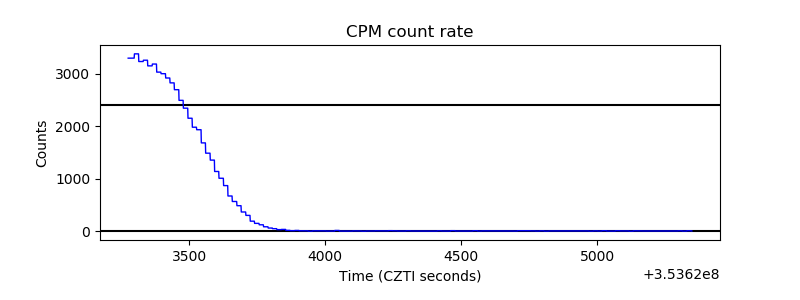 |
| CZT Counter | 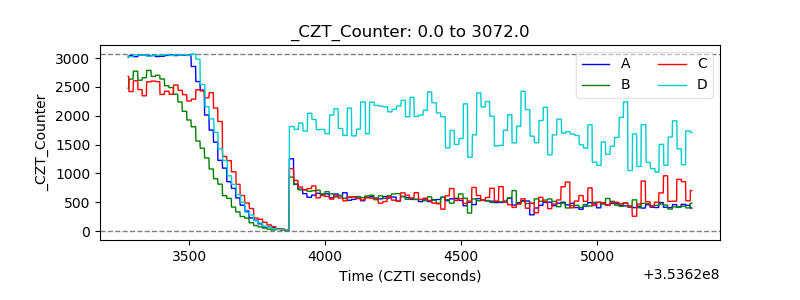 |
| +2.5 Volts monitor |  |
| +5 Volts monitor | 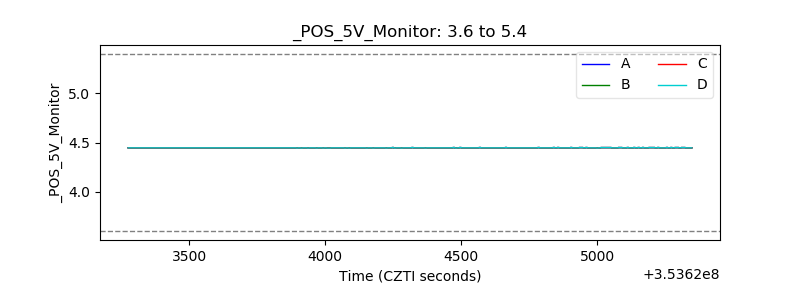 |
| _ROLL_ROT | 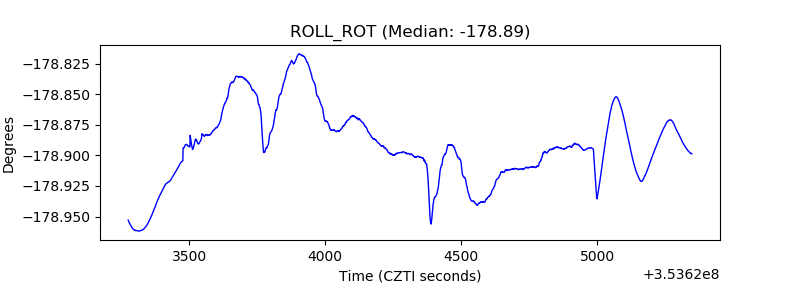 |
| _Roll_DEC |  |
| _Roll_RA | 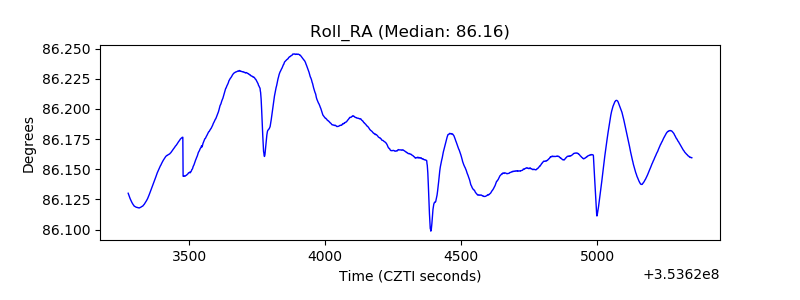 |
| Veto Counter | 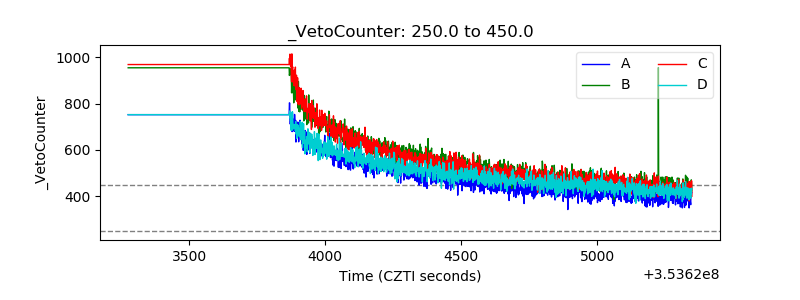 |