| Param | Original file | Final file |
|---|---|---|
| Filename | modeM0/AS1A10_094T12_9000004260cztM0_level2.fits | modeM0/AS1A10_094T12_9000004260cztM0_level2_quad_clean.evt |
| Size (bytes) | 38,903,040 | 24,278,400 |
| Size | 37.1 MB | 23.2 MB |
| Events in quadrant A | 244,640 | 123,179 |
| Events in quadrant B | 233,148 | 123,258 |
| Events in quadrant C | 218,230 | 106,189 |
| Events in quadrant D | 199,798 | 99,168 |
| Mode M0 | |||
|---|---|---|---|
| Quadrant | BADHDUFLAG | Total packets | Discarded packets |
| A | 0 | 8328 | 0 |
| B | 0 | 8523 | 0 |
| C | 0 | 9062 | 0 |
| D | 0 | 16511 | 0 |
| Mode M9 | |||
|---|---|---|---|
| Quadrant | BADHDUFLAG | Total packets | Discarded packets |
| A | 0 | 10 | 0 |
| B | 0 | 10 | 0 |
| C | 0 | 10 | 0 |
| D | 0 | 10 | 0 |
| Mode SS | |||
|---|---|---|---|
| Quadrant | BADHDUFLAG | Total packets | Discarded packets |
| A | 0 | 82 | 0 |
| B | 0 | 82 | 0 |
| C | 0 | 82 | 0 |
| D | 0 | 82 | 0 |
| Quadrant | Total seconds | Saturated seconds | Saturation percentage |
|---|---|---|---|
| A | 4001 | 10 | 0.249938% |
| B | 4001 | 19 | 0.474881% |
| C | 4001 | 605 | 15.121220% |
| D | 4001 | 97 | 2.424394% |
Noise dominated data is calculated using 1-second bins in cleaned event files. If a bin has >2000 counts, and if more than 50% of those come from <1% of pixels, then it is considered to be noise-dominated and hence unusable.
| Quadrant | # 1 sec bins | Bins with >0 counts | Bins with >2000 counts | High rate bins dominated by noise | Noise dominated (total time) | Noise dominated (detector-on time) | Marked lightcurve |
|---|---|---|---|---|---|---|---|
| A | 5021 | 4001 | 0 | 0 | 0.00% | 0.00% |  |
| B | 5021 | 4001 | 0 | 0 | 0.00% | 0.00% |  |
| C | 5021 | 3979 | 0 | 0 | 0.00% | 0.00% |  |
| D | 5021 | 4001 | 0 | 0 | 0.00% | 0.00% |  |
Top three noisy pixels from each quadrant. If the there are fewer than three noisy pixels in the level2.evt file, extra rows are filled as -1
| Pixel properties | Quadrant properties | ||||||
|---|---|---|---|---|---|---|---|
| Quadrant | DetID | PixID | Counts | Sigma | Mean | Median | Sigma |
| A | 0 | 29 | 211 | 8.49 | 63 | 60 | 17.8 |
| A | 7 | 110 | 203 | 8.04 | 63 | 60 | 17.8 |
| A | 14 | 95 | 185 | 7.03 | 63 | 60 | 17.8 |
| B | 2 | 9 | 199 | 9.68 | 61 | 59 | 14.5 |
| B | 2 | 8 | 186 | 8.78 | 61 | 59 | 14.5 |
| B | 14 | 254 | 157 | 6.78 | 61 | 59 | 14.5 |
| C | 1 | 81 | 170 | 7.13 | 57 | 54 | 16.3 |
| C | 3 | 235 | 160 | 6.52 | 57 | 54 | 16.3 |
| C | 3 | 187 | 159 | 6.46 | 57 | 54 | 16.3 |
| D | 15 | 46 | 171 | 7.05 | 57 | 52 | 16.9 |
| D | 7 | 5 | 150 | 5.81 | 57 | 52 | 16.9 |
| D | 6 | 83 | 150 | 5.81 | 57 | 52 | 16.9 |
Histogram calculated using DETX and DETY for each event in the final _common_clean file
| Quadrant A |  |
 |
Quadrant B |
|---|---|---|---|
| Quadrant D | 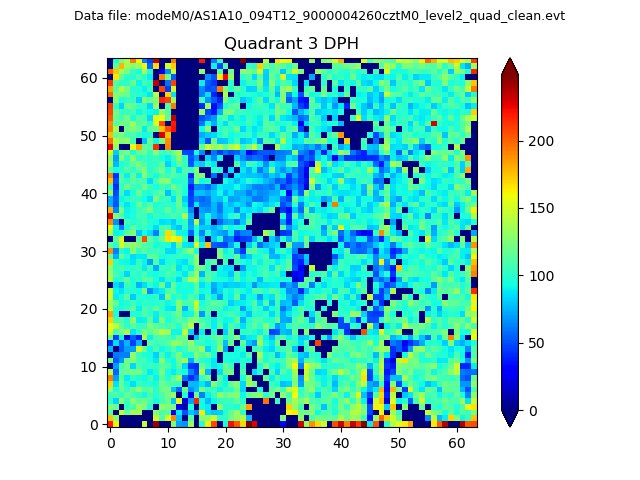 |
 |
Quadrant C |
| Plot type | Count rate plots | Images |
|---|---|---|
| Comparison with Poisson distribution Blue bars denote a histogram of data divided into 1 sec bins. Red curve is a Poisson curve with rate = median count rate of data. |
 |
 |
| Quadrant-wise count rates Data is divided into 100 sec bins |
 |
|
| Module-wise count rates for Quadrant A Data is divided into 100 sec bins |
 |
 |
| Module-wise count rates for Quadrant B Data is divided into 100 sec bins |
 |
 |
| Module-wise count rates for Quadrant C Data is divided into 100 sec bins |
 |
 |
| Module-wise count rates for Quadrant D Data is divided into 100 sec bins |
 |
 |
| Parameter | Plot |
|---|---|
| CZT HV Monitor |  |
| D_VDD |  |
| Temperature 1 |  |
| Veto HV Monitor |  |
| Veto LLD |  |
| Alpha Counter |  |
| _CPM_Rate |  |
| CZT Counter | 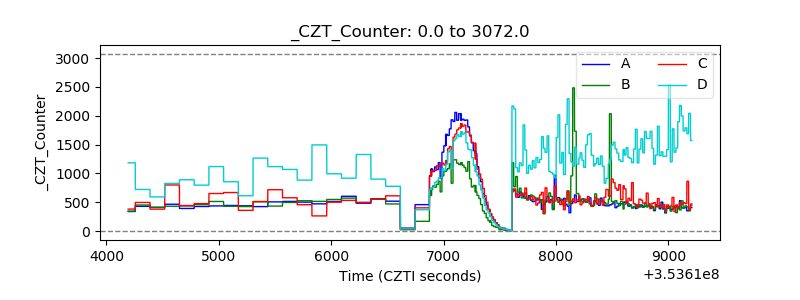 |
| +2.5 Volts monitor |  |
| +5 Volts monitor |  |
| _ROLL_ROT | 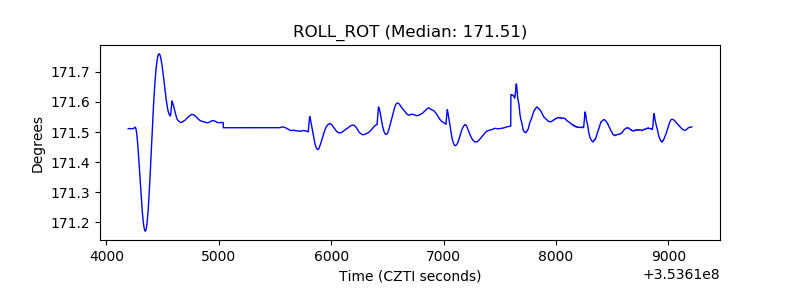 |
| _Roll_DEC |  |
| _Roll_RA | 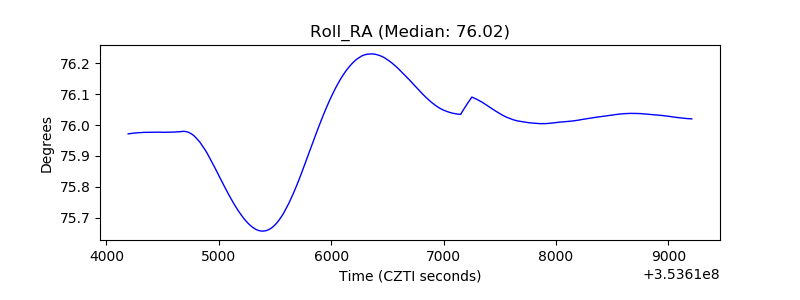 |
| Veto Counter | 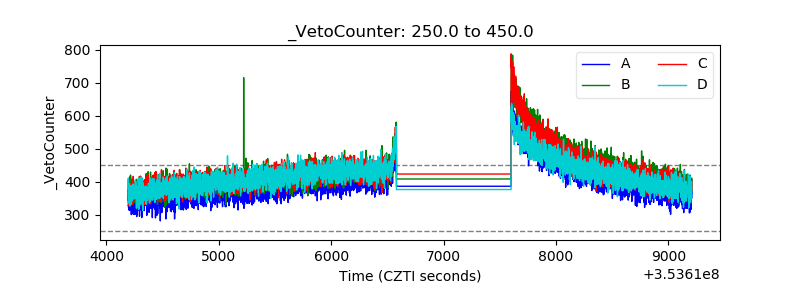 |