| Param | Original file | Final file |
|---|---|---|
| Filename | modeM0/AS1A10_094T12_9000004260_29553cztM0_level2.evt | modeM0/AS1A10_094T12_9000004260_29553cztM0_level2_quad_clean.evt |
| Size (bytes) | 346,947,840 | 57,533,760 |
| Size | 330.9 MB | 54.9 MB |
| Events in quadrant A | 1,880,743 | 381,055 |
| Events in quadrant B | 1,957,632 | 388,875 |
| Events in quadrant C | 2,120,793 | 356,301 |
| Events in quadrant D | 4,288,236 | 346,271 |
| Mode M0 | |||
|---|---|---|---|
| Quadrant | BADHDUFLAG | Total packets | Discarded packets |
| A | 0 | 7955 | 1 |
| B | 0 | 8150 | 1 |
| C | 0 | 8676 | 1 |
| D | 0 | 15433 | 1 |
| Mode M9 | |||
|---|---|---|---|
| Quadrant | BADHDUFLAG | Total packets | Discarded packets |
| A | 0 | 10 | 0 |
| B | 0 | 10 | 0 |
| C | 0 | 10 | 0 |
| D | 0 | 10 | 0 |
| Mode SS | |||
|---|---|---|---|
| Quadrant | BADHDUFLAG | Total packets | Discarded packets |
| A | 0 | 78 | 0 |
| B | 0 | 78 | 0 |
| C | 0 | 78 | 0 |
| D | 0 | 78 | 0 |
| Quadrant | Total seconds | Saturated seconds | Saturation percentage |
|---|---|---|---|
| A | 3814 | 10 | 0.262192% |
| B | 3814 | 19 | 0.498165% |
| C | 3814 | 597 | 15.652858% |
| D | 3814 | 80 | 2.097535% |
Noise dominated data is calculated using 1-second bins in cleaned event files. If a bin has >2000 counts, and if more than 50% of those come from <1% of pixels, then it is considered to be noise-dominated and hence unusable.
| Quadrant | # 1 sec bins | Bins with >0 counts | Bins with >2000 counts | High rate bins dominated by noise | Noise dominated (total time) | Noise dominated (detector-on time) | Marked lightcurve |
|---|---|---|---|---|---|---|---|
| A | 4834 | 3815 | 0 | 0 | 0.00% | 0.00% | 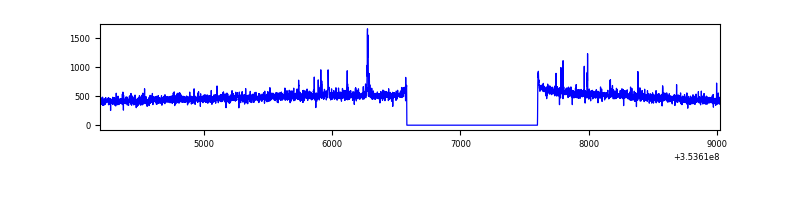 |
| B | 4834 | 3815 | 6 | 6 | 0.12% | 0.16% | 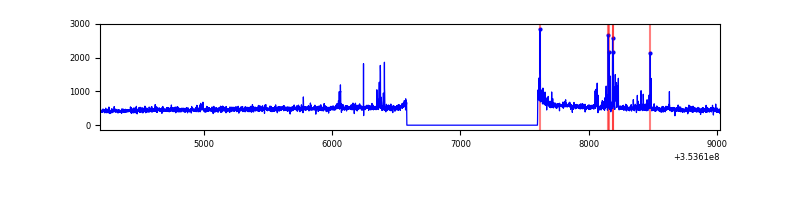 |
| C | 4834 | 3815 | 0 | 0 | 0.00% | 0.00% | 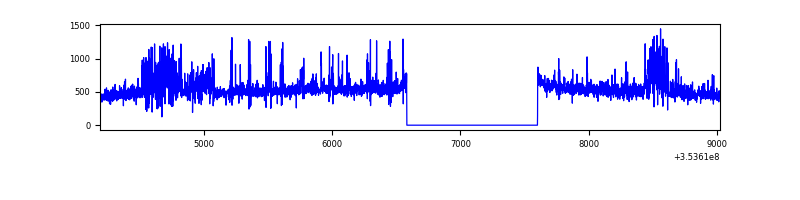 |
| D | 4834 | 3815 | 70 | 70 | 1.45% | 1.83% | 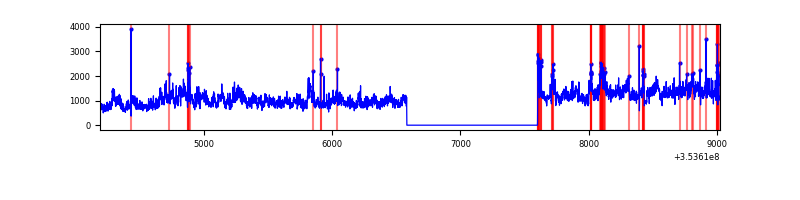 |
Top three noisy pixels from each quadrant. If the there are fewer than three noisy pixels in the level2.evt file, extra rows are filled as -1
| Pixel properties | Quadrant properties | ||||||
|---|---|---|---|---|---|---|---|
| Quadrant | DetID | PixID | Counts | Sigma | Mean | Median | Sigma |
| A | 0 | 13 | 42543 | 433.43 | 475 | 466 | 97.1 |
| A | 13 | 254 | 8011 | 77.72 | 475 | 466 | 97.1 |
| A | 3 | 137 | 4782 | 44.46 | 475 | 466 | 97.1 |
| B | 5 | 255 | 37973 | 408.5 | 472 | 459 | 91.8 |
| B | 5 | 172 | 28286 | 303.01 | 472 | 459 | 91.8 |
| B | 0 | 190 | 16219 | 171.61 | 472 | 459 | 91.8 |
| C | 14 | 238 | 213984 | 2171.78 | 419 | 421 | 98.3 |
| C | 14 | 254 | 210107 | 2132.35 | 419 | 421 | 98.3 |
| C | 3 | 233 | 46744 | 471.07 | 419 | 421 | 98.3 |
| D | 8 | 195 | 2375210 | 22024.33 | 451 | 439 | 107.8 |
| D | 13 | 153 | 108232 | 999.7 | 451 | 439 | 107.8 |
| D | 7 | 238 | 33960 | 310.88 | 451 | 439 | 107.8 |
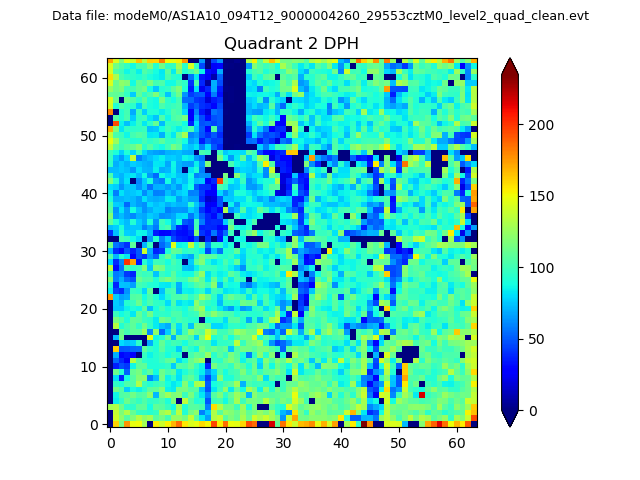
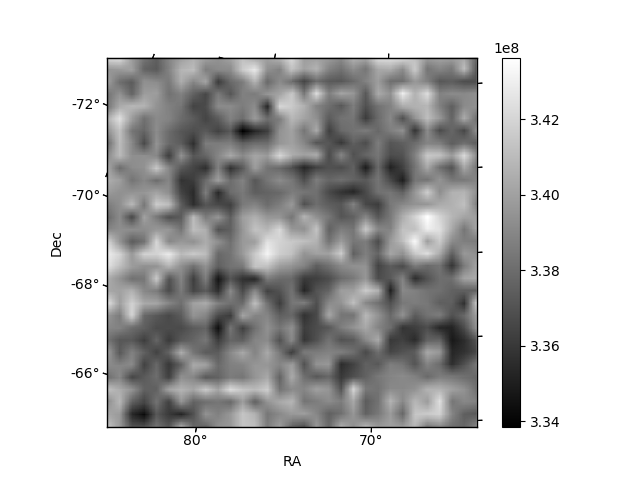
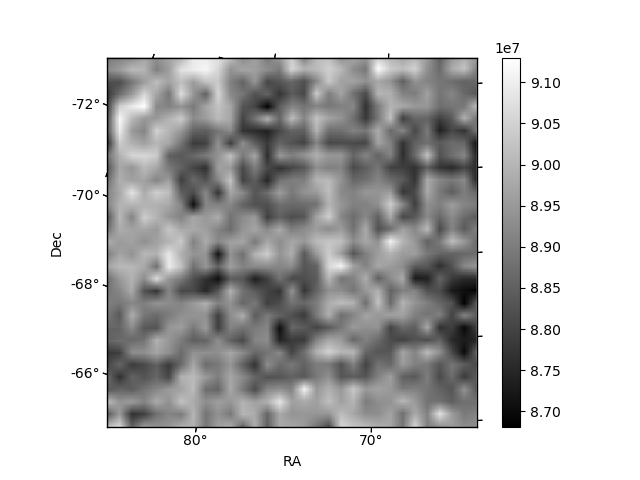
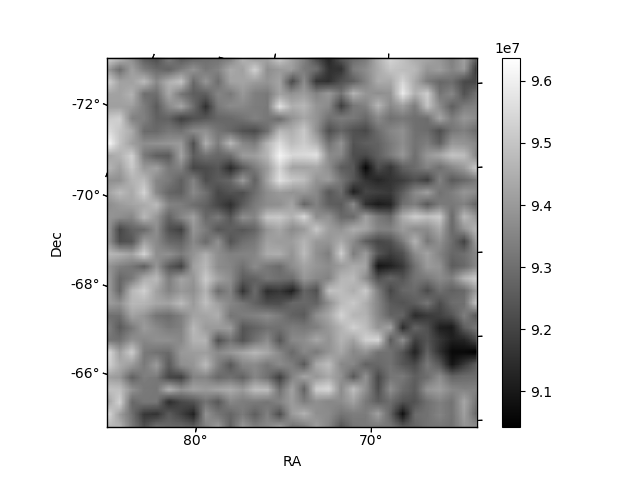
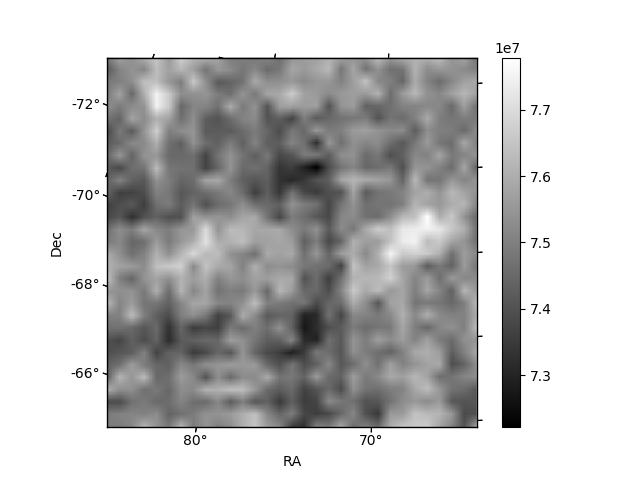
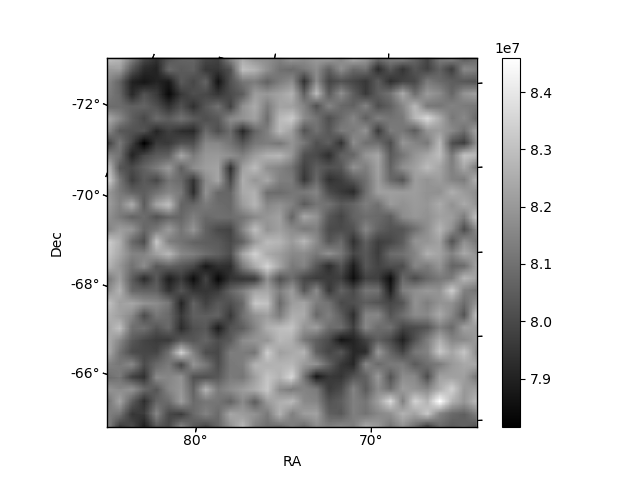
Histogram calculated using DETX and DETY for each event in the final _common_clean file
| Quadrant A | 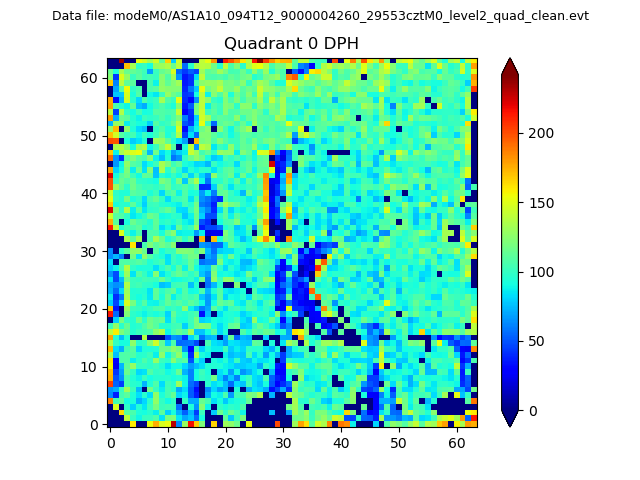 |
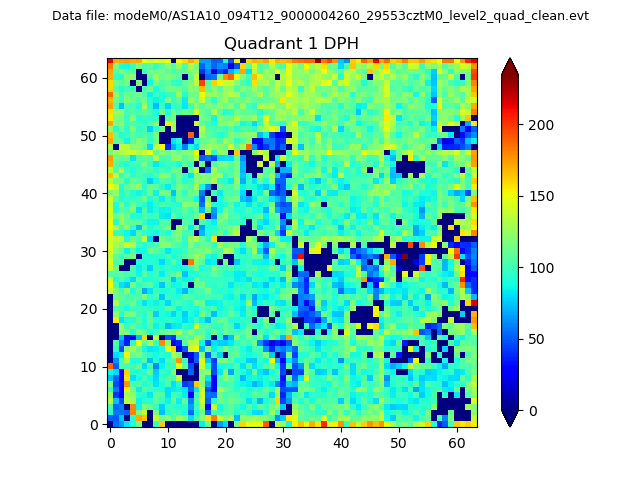 |
Quadrant B |
|---|---|---|---|
| Quadrant D | 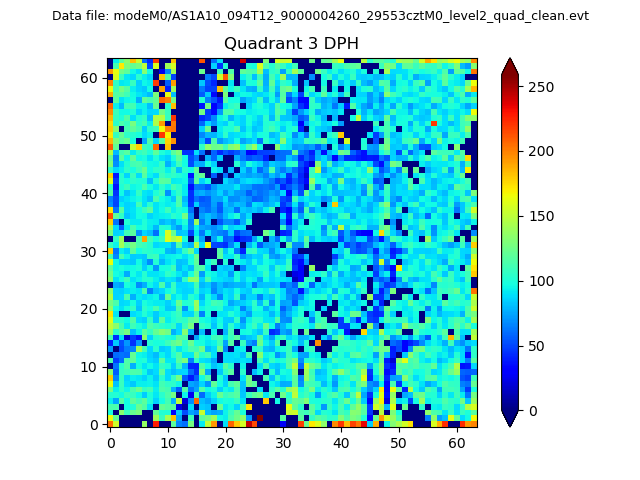 |
 |
Quadrant C |
| Plot type | Count rate plots | Images |
|---|---|---|
| Comparison with Poisson distribution Blue bars denote a histogram of data divided into 1 sec bins. Red curve is a Poisson curve with rate = median count rate of data. |
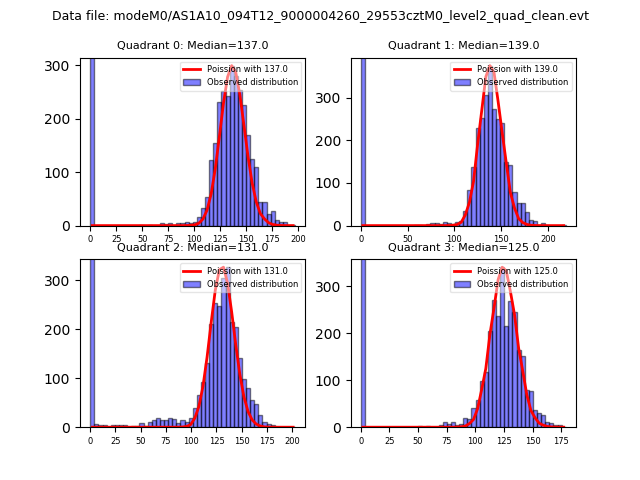 |
 |
| Quadrant-wise count rates Data is divided into 100 sec bins |
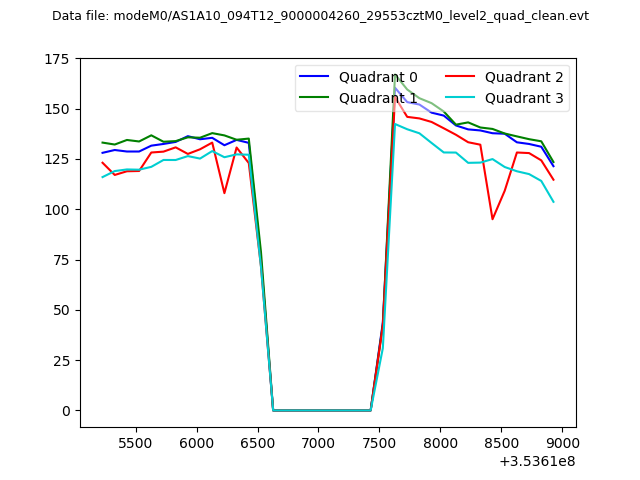 |
|
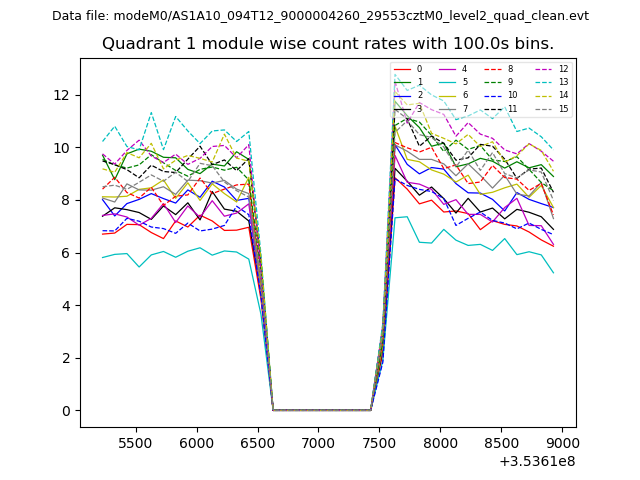
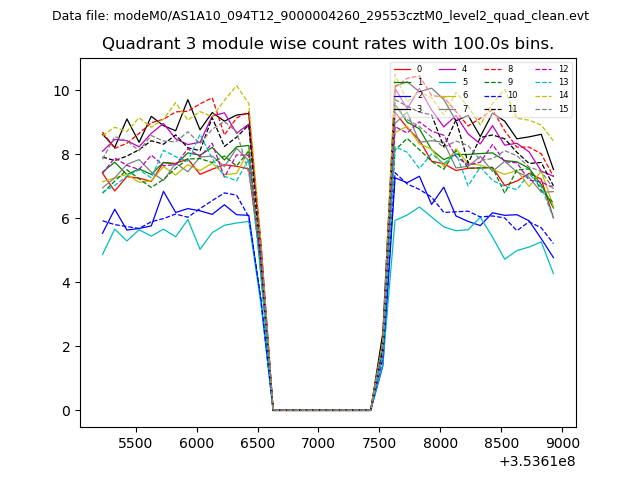
| Module-wise count rates for Quadrant A Data is divided into 100 sec bins |
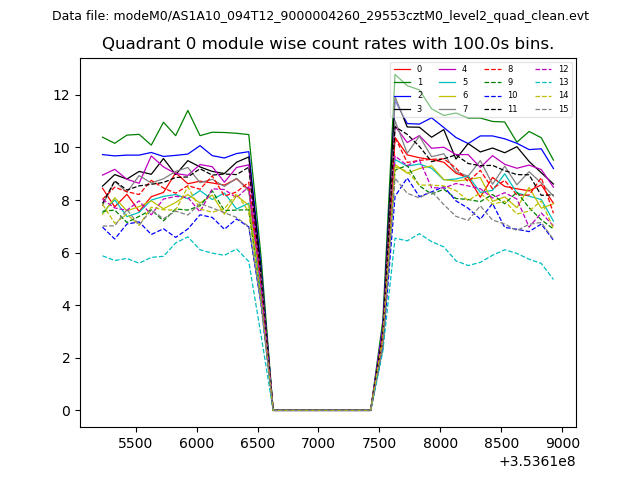 |
 |
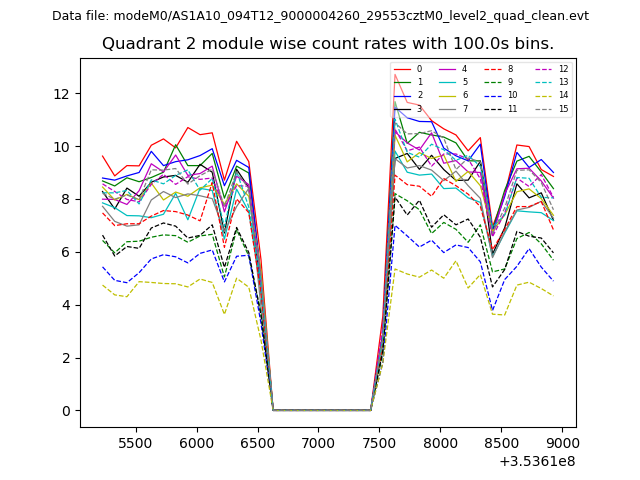
| Module-wise count rates for Quadrant B Data is divided into 100 sec bins |
 |
 |
| Module-wise count rates for Quadrant C Data is divided into 100 sec bins |
 |
 |
| Module-wise count rates for Quadrant D Data is divided into 100 sec bins |
 |
 |
| Parameter | Plot |
|---|---|
| CZT HV Monitor |  |
| D_VDD | 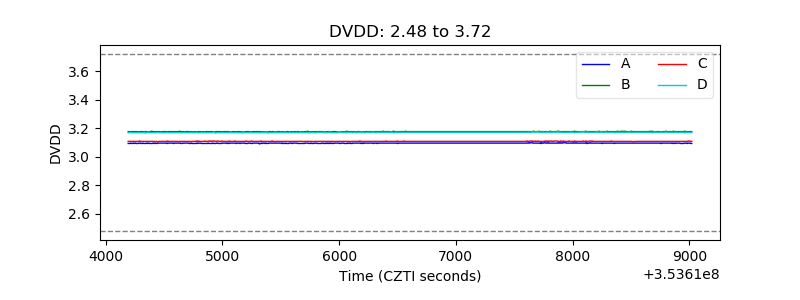 |
| Temperature 1 | 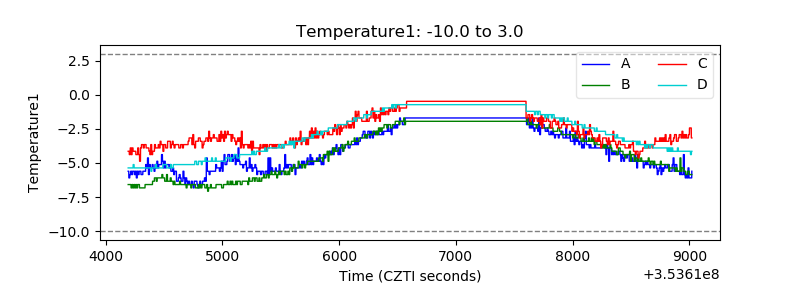 |
| Veto HV Monitor | 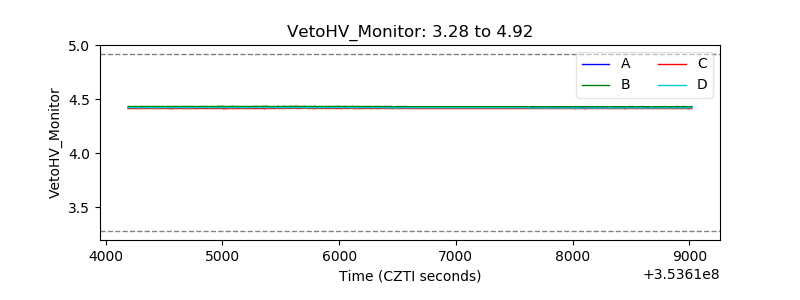 |
| Veto LLD | 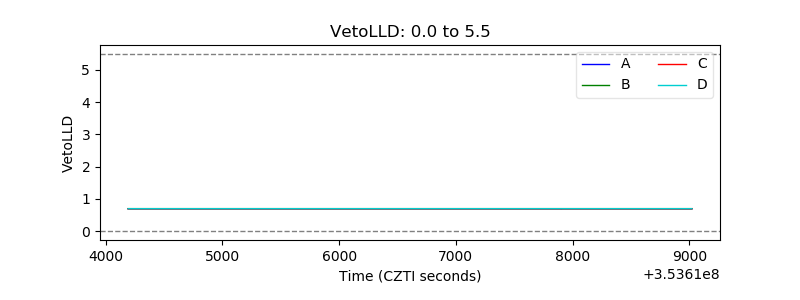 |
| Alpha Counter | 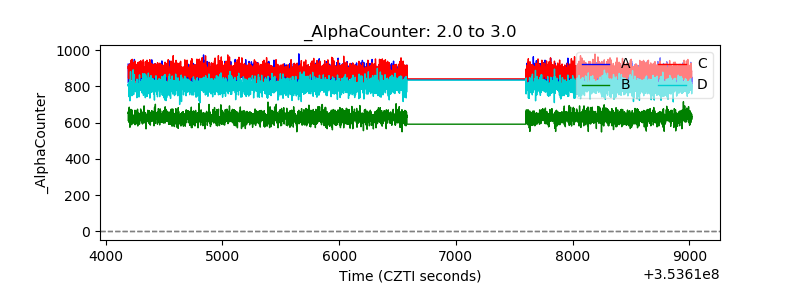 |
| _CPM_Rate | 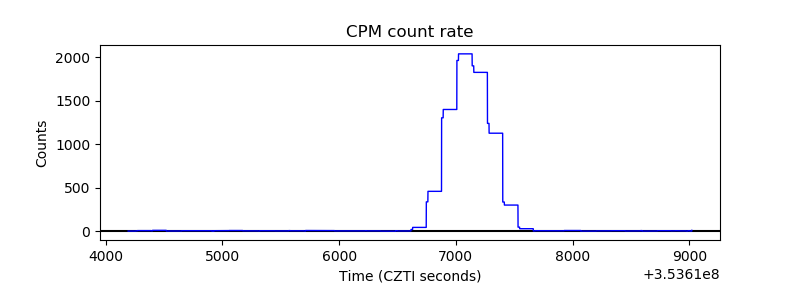 |
| CZT Counter | 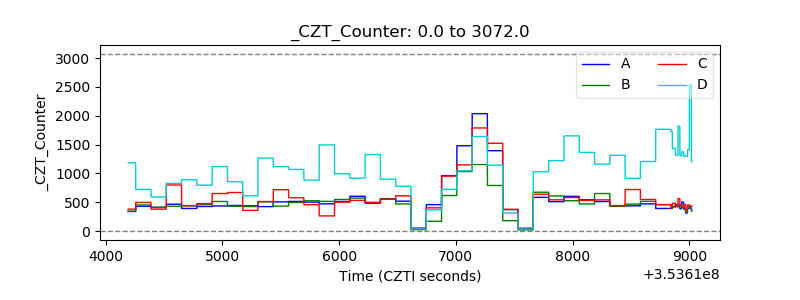 |
| +2.5 Volts monitor |  |
| +5 Volts monitor |  |
| _ROLL_ROT | 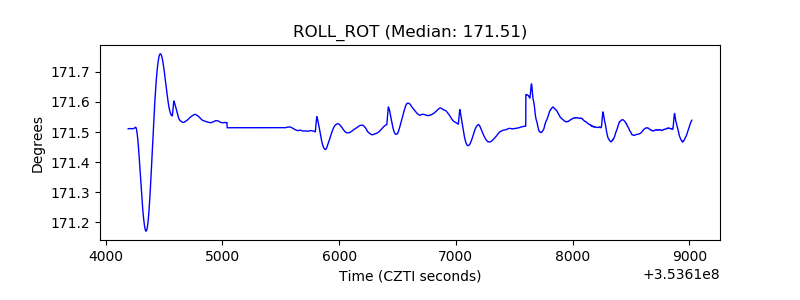 |
| _Roll_DEC | 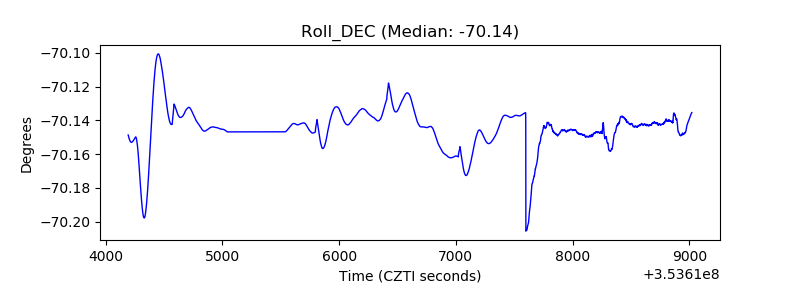 |
| _Roll_RA | 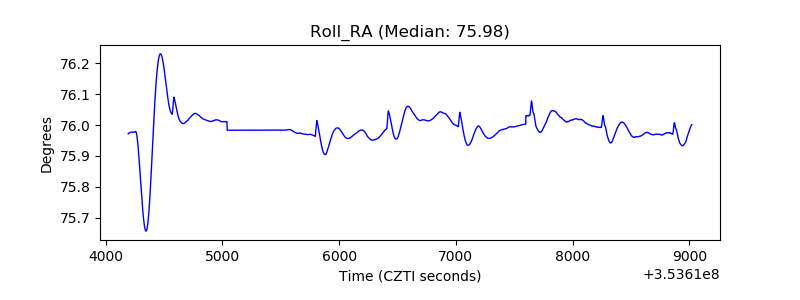 |
| Veto Counter | 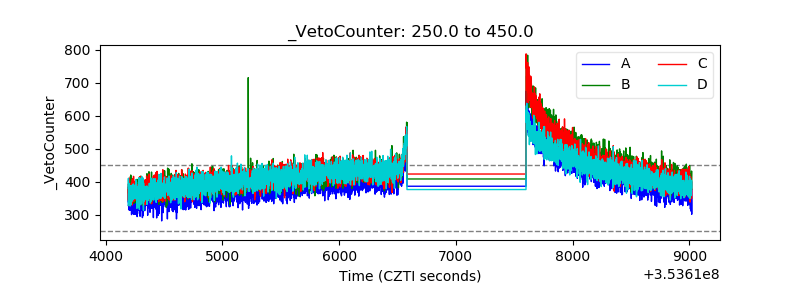 |