| Param | Original file | Final file |
|---|---|---|
| Filename | modeM0/AS1A10_094T12_9000004260_29555cztM0_level2.evt | modeM0/AS1A10_094T12_9000004260_29555cztM0_level2_quad_clean.evt |
| Size (bytes) | 162,624,960 | 32,443,200 |
| Size | 155.1 MB | 30.9 MB |
| Events in quadrant A | 800,770 | 226,064 |
| Events in quadrant B | 874,576 | 229,736 |
| Events in quadrant C | 871,512 | 209,538 |
| Events in quadrant D | 2,266,795 | 198,182 |
| Mode M0 | |||
|---|---|---|---|
| Quadrant | BADHDUFLAG | Total packets | Discarded packets |
| A | 0 | 3408 | 1 |
| B | 0 | 3623 | 1 |
| C | 0 | 3606 | 1 |
| D | 0 | 7870 | 1 |
| Mode M9 | |||
|---|---|---|---|
| Quadrant | BADHDUFLAG | Total packets | Discarded packets |
| A | 0 | 1 | 0 |
| B | 0 | 2 | 0 |
| C | 0 | 2 | 0 |
| D | 0 | 2 | 0 |
| Mode SS | |||
|---|---|---|---|
| Quadrant | BADHDUFLAG | Total packets | Discarded packets |
| A | 0 | 32 | 0 |
| B | 0 | 32 | 0 |
| C | 0 | 32 | 0 |
| D | 0 | 32 | 0 |
| Quadrant | Total seconds | Saturated seconds | Saturation percentage |
|---|---|---|---|
| A | 1609 | 1 | 0.062150% |
| B | 1609 | 14 | 0.870106% |
| C | 1609 | 121 | 7.520199% |
| D | 1609 | 73 | 4.536979% |
Noise dominated data is calculated using 1-second bins in cleaned event files. If a bin has >2000 counts, and if more than 50% of those come from <1% of pixels, then it is considered to be noise-dominated and hence unusable.
| Quadrant | # 1 sec bins | Bins with >0 counts | Bins with >2000 counts | High rate bins dominated by noise | Noise dominated (total time) | Noise dominated (detector-on time) | Marked lightcurve |
|---|---|---|---|---|---|---|---|
| A | 1609 | 1609 | 0 | 0 | 0.00% | 0.00% | 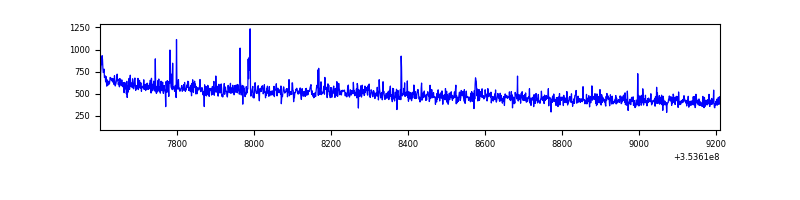 |
| B | 1609 | 1609 | 6 | 6 | 0.37% | 0.37% | 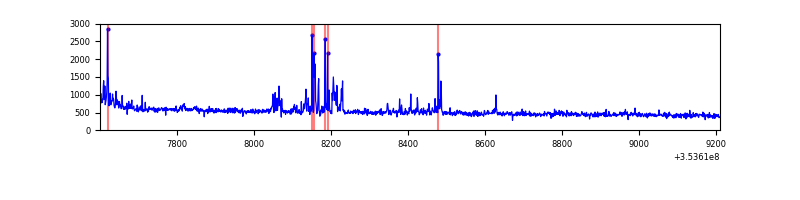 |
| C | 1609 | 1609 | 0 | 0 | 0.00% | 0.00% | 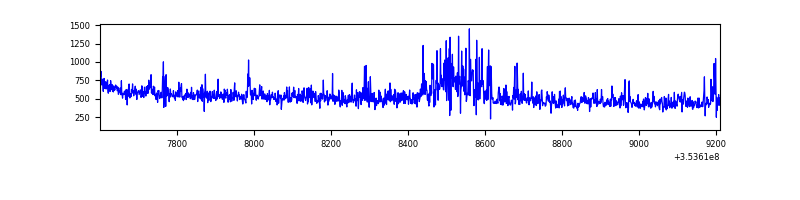 |
| D | 1609 | 1609 | 103 | 103 | 6.40% | 6.40% | 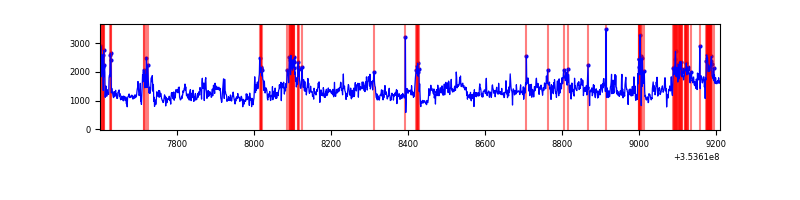 |
Top three noisy pixels from each quadrant. If the there are fewer than three noisy pixels in the level2.evt file, extra rows are filled as -1
| Pixel properties | Quadrant properties | ||||||
|---|---|---|---|---|---|---|---|
| Quadrant | DetID | PixID | Counts | Sigma | Mean | Median | Sigma |
| A | 0 | 13 | 19783 | 458.72 | 202 | 198 | 42.7 |
| A | 13 | 254 | 3571 | 79.0 | 202 | 198 | 42.7 |
| A | 3 | 137 | 1975 | 41.62 | 202 | 198 | 42.7 |
| B | 5 | 255 | 33674 | 820.46 | 202 | 197 | 40.8 |
| B | 5 | 172 | 27829 | 677.21 | 202 | 197 | 40.8 |
| B | 0 | 199 | 6895 | 164.16 | 202 | 197 | 40.8 |
| C | 14 | 238 | 68673 | 1552.03 | 182 | 183 | 44.1 |
| C | 14 | 254 | 53785 | 1214.66 | 182 | 183 | 44.1 |
| C | 3 | 233 | 30245 | 681.23 | 182 | 183 | 44.1 |
| D | 8 | 195 | 1426731 | 30989.16 | 184 | 179 | 46.0 |
| D | 13 | 153 | 70443 | 1526.35 | 184 | 179 | 46.0 |
| D | 7 | 238 | 26817 | 578.66 | 184 | 179 | 46.0 |
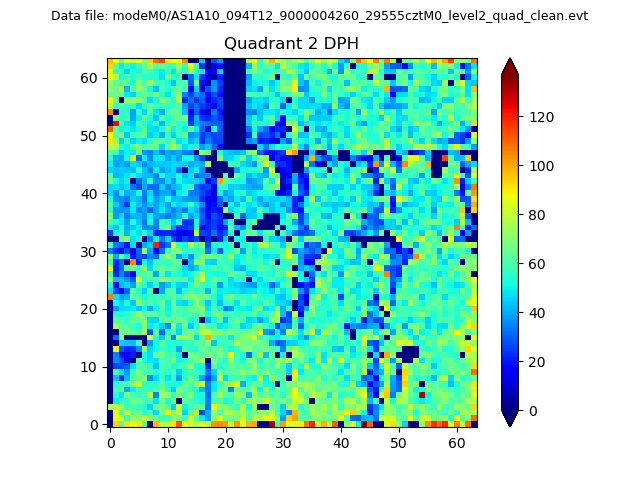
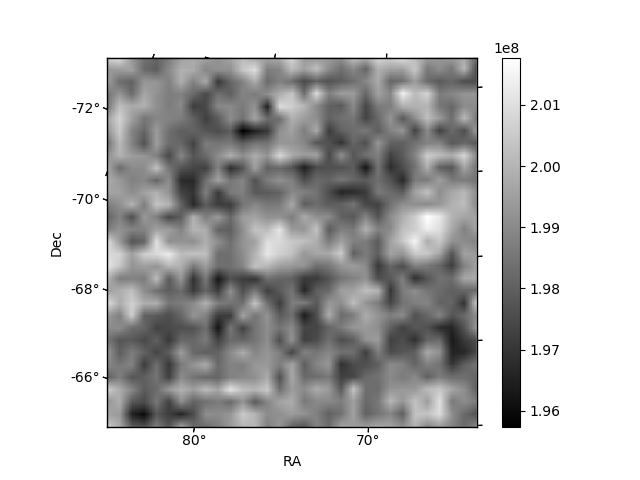
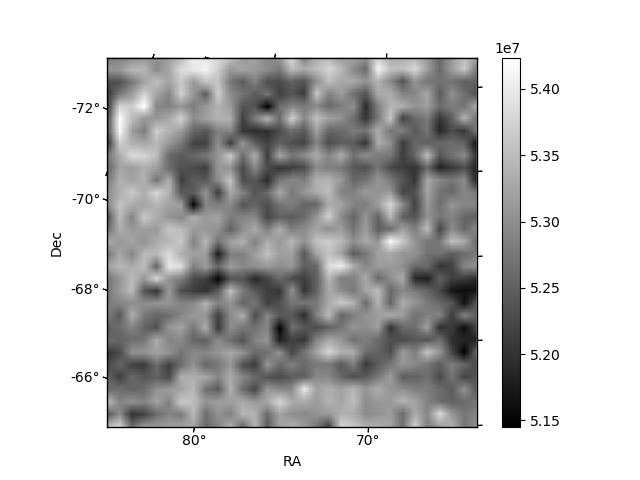
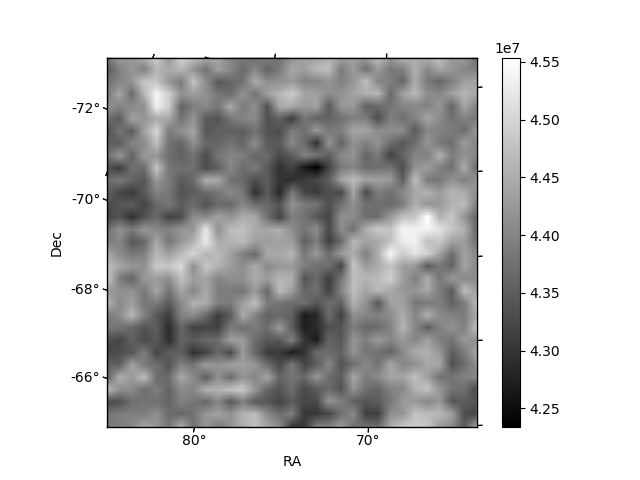
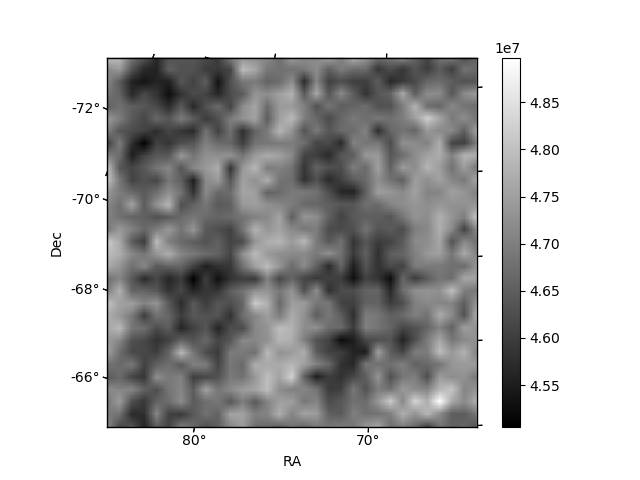
Histogram calculated using DETX and DETY for each event in the final _common_clean file
| Quadrant A | 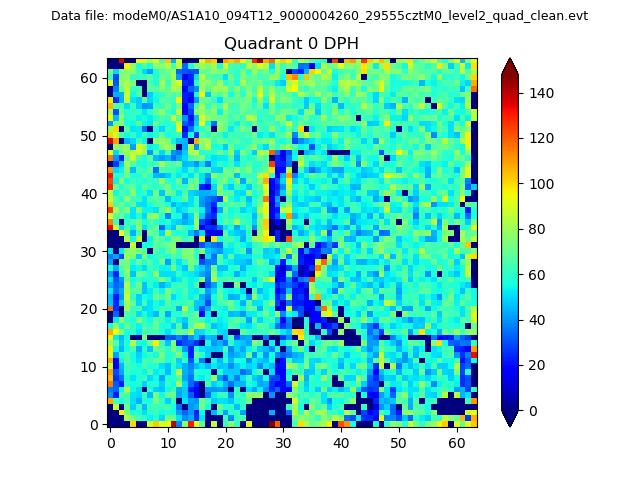 |
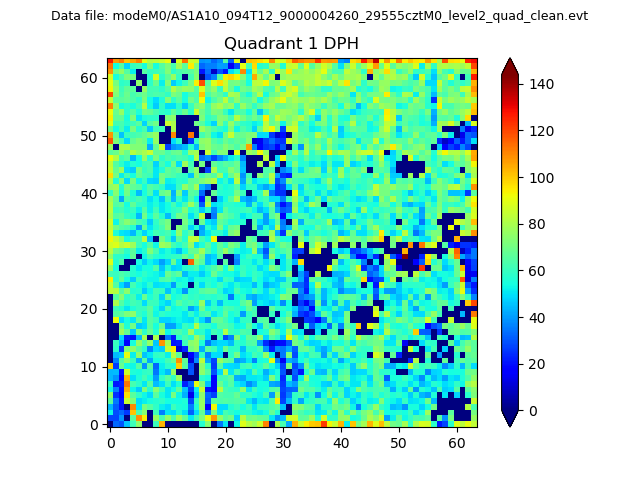 |
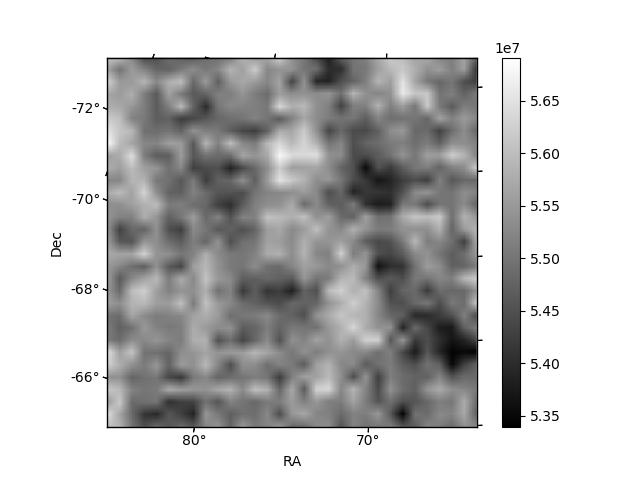
Quadrant B |
|---|---|---|---|
| Quadrant D | 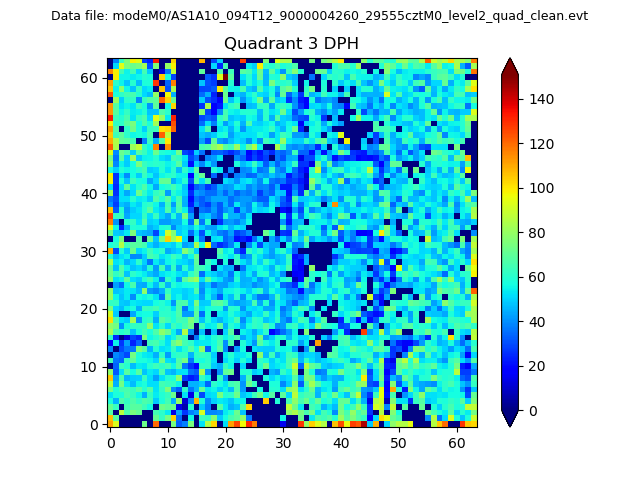 |
 |
Quadrant C |
| Plot type | Count rate plots | Images |
|---|---|---|
| Comparison with Poisson distribution Blue bars denote a histogram of data divided into 1 sec bins. Red curve is a Poisson curve with rate = median count rate of data. |
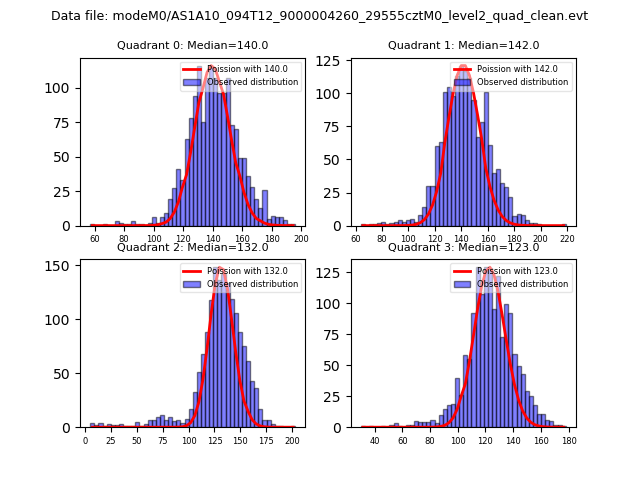 |
 |
| Quadrant-wise count rates Data is divided into 100 sec bins |
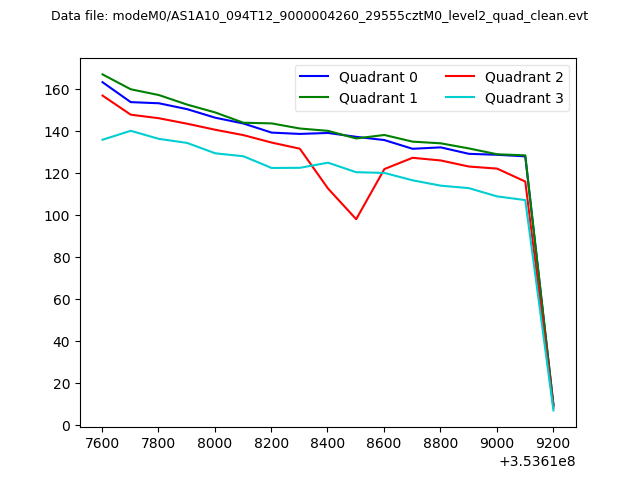 |
|
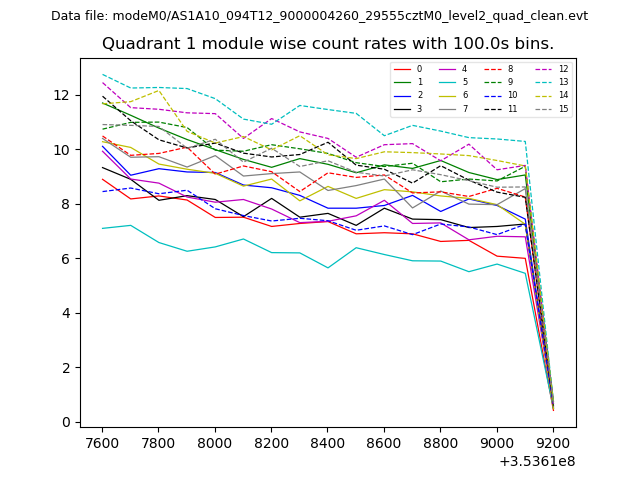
| Module-wise count rates for Quadrant A Data is divided into 100 sec bins |
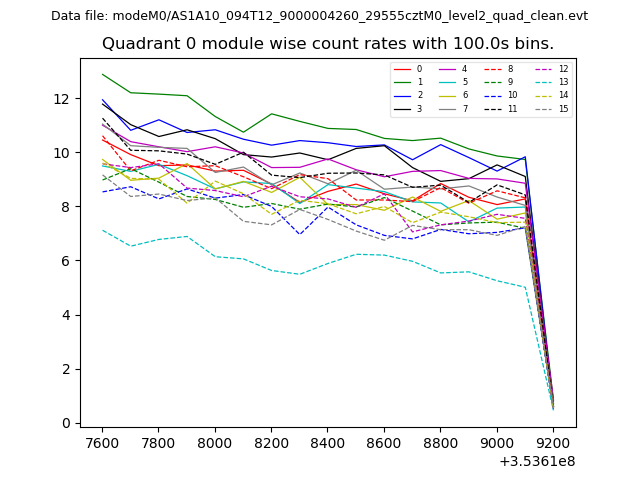 |
 |
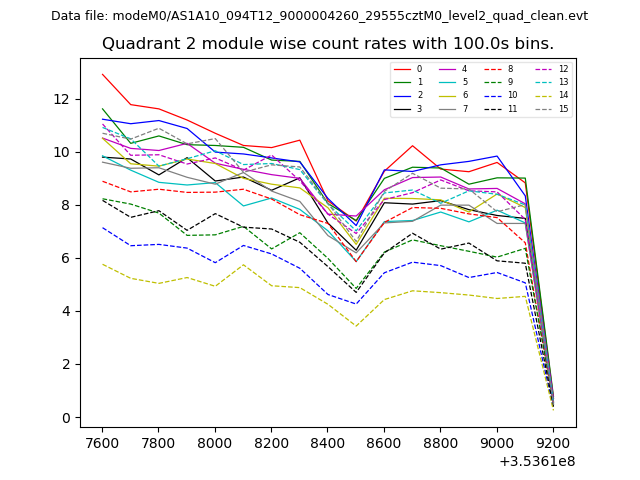
| Module-wise count rates for Quadrant B Data is divided into 100 sec bins |
 |
 |
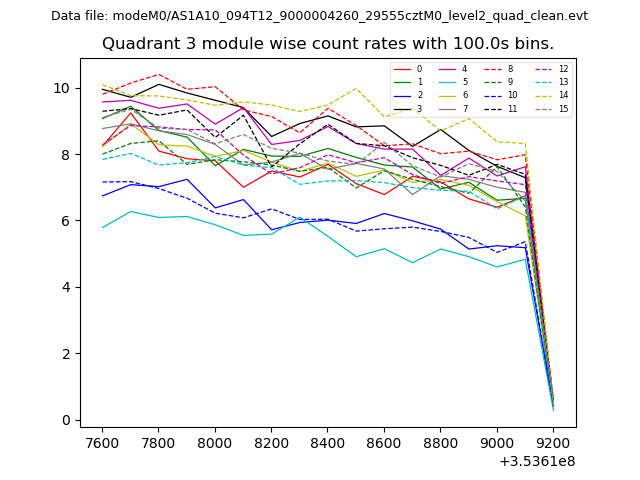
| Module-wise count rates for Quadrant C Data is divided into 100 sec bins |
 |
 |
| Module-wise count rates for Quadrant D Data is divided into 100 sec bins |
 |
 |
| Parameter | Plot |
|---|---|
| CZT HV Monitor | 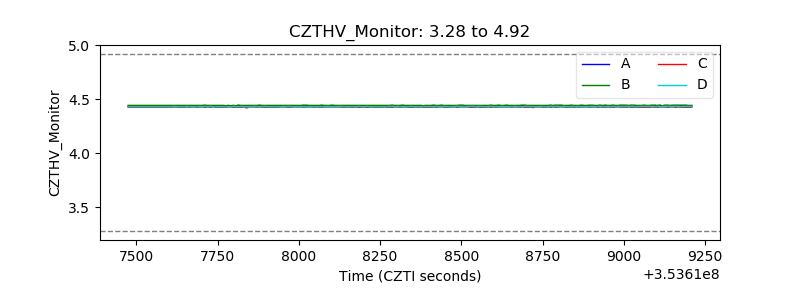 |
| D_VDD | 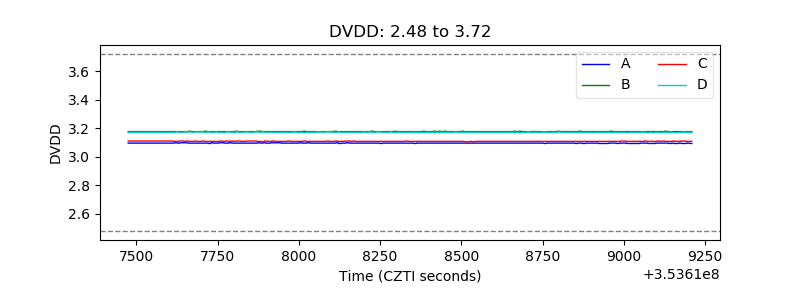 |
| Temperature 1 | 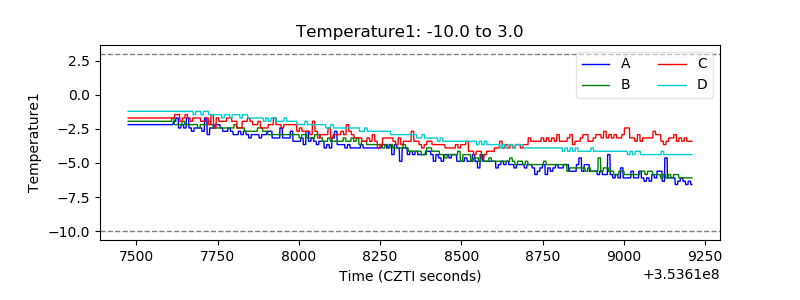 |
| Veto HV Monitor | 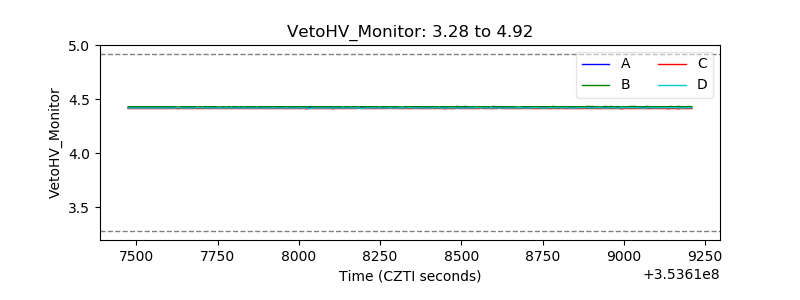 |
| Veto LLD | 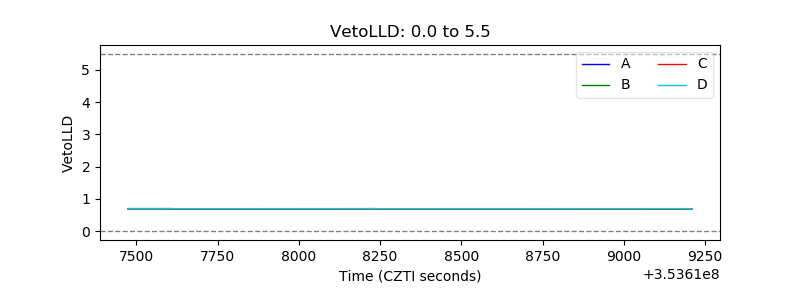 |
| Alpha Counter | 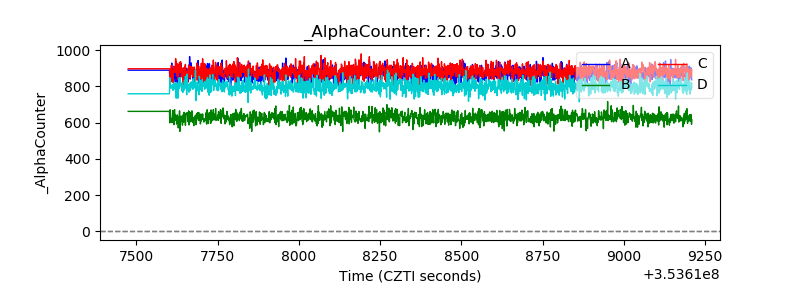 |
| _CPM_Rate | 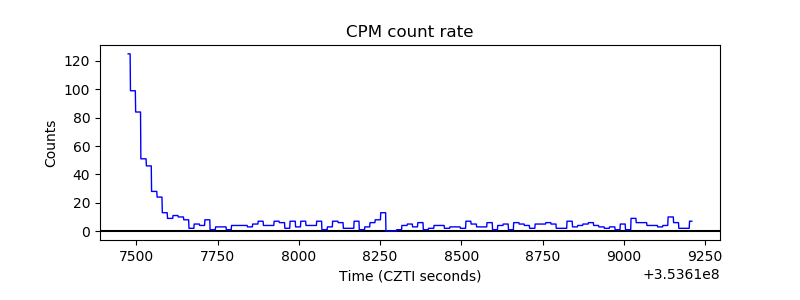 |
| CZT Counter | 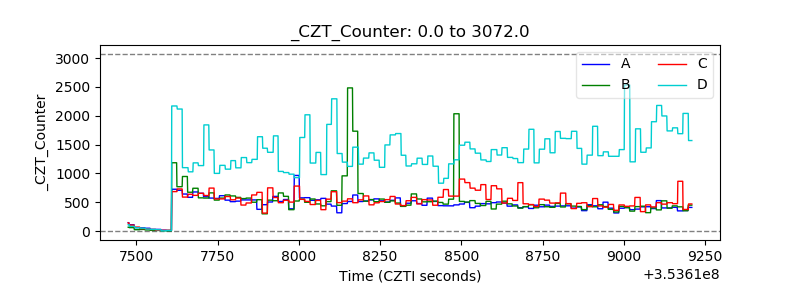 |
| +2.5 Volts monitor |  |
| +5 Volts monitor |  |
| _ROLL_ROT | 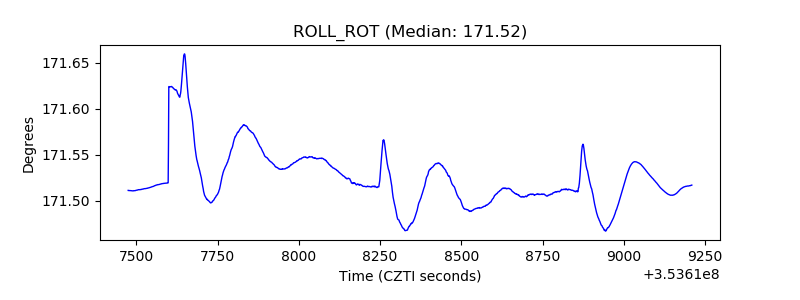 |
| _Roll_DEC | 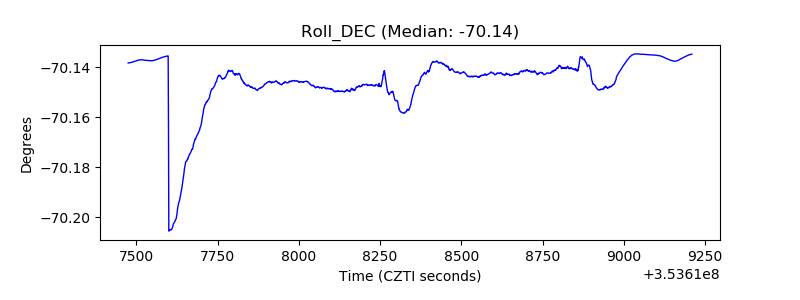 |
| _Roll_RA | 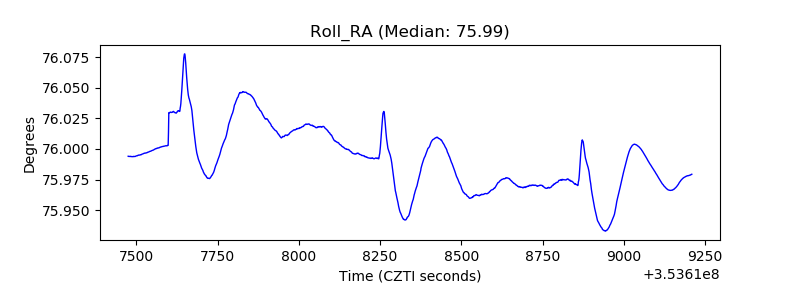 |
| Veto Counter | 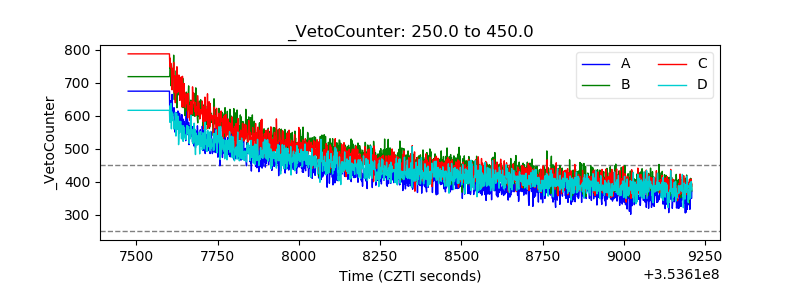 |