| Param | Original file | Final file |
|---|---|---|
| Filename | modeM0/AS1A10_104T02_9000004258cztM0_level2.fits | modeM0/AS1A10_104T02_9000004258cztM0_level2_quad_clean.evt |
| Size (bytes) | 122,109,120 | 164,134,080 |
| Size | 116.5 MB | 156.5 MB |
| Events in quadrant A | 755,714 | 1,098,340 |
| Events in quadrant B | 726,374 | 1,115,601 |
| Events in quadrant C | 711,932 | 1,007,897 |
| Events in quadrant D | 585,306 | 831,249 |
| Mode M0 | |||
|---|---|---|---|
| Quadrant | BADHDUFLAG | Total packets | Discarded packets |
| A | 0 | 27210 | 0 |
| B | 0 | 28627 | 0 |
| C | 0 | 28865 | 0 |
| D | 0 | 69664 | 0 |
| Mode SS | |||
|---|---|---|---|
| Quadrant | BADHDUFLAG | Total packets | Discarded packets |
| A | 0 | 272 | 0 |
| B | 0 | 272 | 0 |
| C | 0 | 272 | 0 |
| D | 0 | 272 | 0 |
| Mode M9 | |||
|---|---|---|---|
| Quadrant | BADHDUFLAG | Total packets | Discarded packets |
| A | 0 | 19 | 0 |
| B | 0 | 19 | 0 |
| C | 0 | 19 | 0 |
| D | 0 | 19 | 0 |
| Quadrant | Total seconds | Saturated seconds | Saturation percentage |
|---|---|---|---|
| A | 13277 | 124 | 0.933946% |
| B | 13277 | 239 | 1.800105% |
| C | 13277 | 1143 | 8.608872% |
| D | 13277 | 2402 | 18.091436% |
Noise dominated data is calculated using 1-second bins in cleaned event files. If a bin has >2000 counts, and if more than 50% of those come from <1% of pixels, then it is considered to be noise-dominated and hence unusable.
| Quadrant | # 1 sec bins | Bins with >0 counts | Bins with >2000 counts | High rate bins dominated by noise | Noise dominated (total time) | Noise dominated (detector-on time) | Marked lightcurve |
|---|---|---|---|---|---|---|---|
| A | 15207 | 13276 | 0 | 0 | 0.00% | 0.00% |  |
| B | 15207 | 13277 | 0 | 0 | 0.00% | 0.00% |  |
| C | 15207 | 13255 | 0 | 0 | 0.00% | 0.00% |  |
| D | 15207 | 13274 | 0 | 0 | 0.00% | 0.00% |  |
Top three noisy pixels from each quadrant. If the there are fewer than three noisy pixels in the level2.evt file, extra rows are filled as -1
| Pixel properties | Quadrant properties | ||||||
|---|---|---|---|---|---|---|---|
| Quadrant | DetID | PixID | Counts | Sigma | Mean | Median | Sigma |
| A | 0 | 29 | 647 | 9.05 | 196 | 185 | 51.1 |
| A | 7 | 110 | 621 | 8.54 | 196 | 185 | 51.1 |
| A | 0 | 30 | 595 | 8.03 | 196 | 185 | 51.1 |
| B | 2 | 9 | 628 | 11.0 | 192 | 184 | 40.4 |
| B | 2 | 8 | 514 | 8.17 | 192 | 184 | 40.4 |
| B | 3 | 17 | 496 | 7.73 | 192 | 184 | 40.4 |
| C | 1 | 81 | 575 | 8.08 | 188 | 175 | 49.5 |
| C | 1 | 80 | 546 | 7.5 | 188 | 175 | 49.5 |
| C | 3 | 126 | 495 | 6.46 | 188 | 175 | 49.5 |
| D | 15 | 46 | 457 | 6.56 | 167 | 152 | 46.5 |
| D | 7 | 3 | 440 | 6.2 | 167 | 152 | 46.5 |
| D | 6 | 67 | 416 | 5.68 | 167 | 152 | 46.5 |
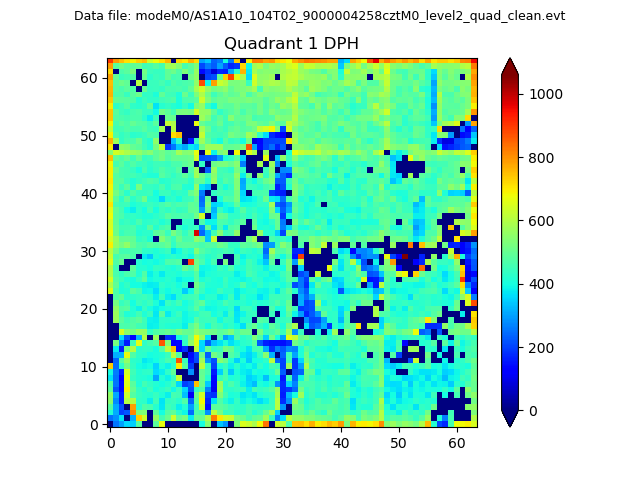
Histogram calculated using DETX and DETY for each event in the final _common_clean file
| Quadrant A |  |
 |
Quadrant B |
|---|---|---|---|
| Quadrant D | 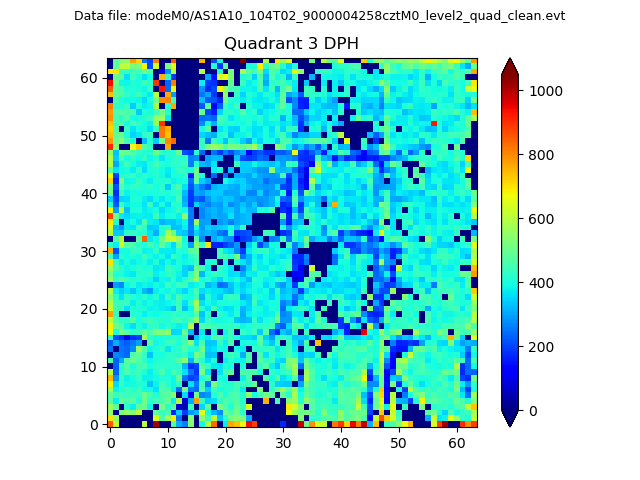 |
 |
Quadrant C |
| Plot type | Count rate plots | Images |
|---|---|---|
| Comparison with Poisson distribution Blue bars denote a histogram of data divided into 1 sec bins. Red curve is a Poisson curve with rate = median count rate of data. |
 |
 |
| Quadrant-wise count rates Data is divided into 100 sec bins |
 |
|
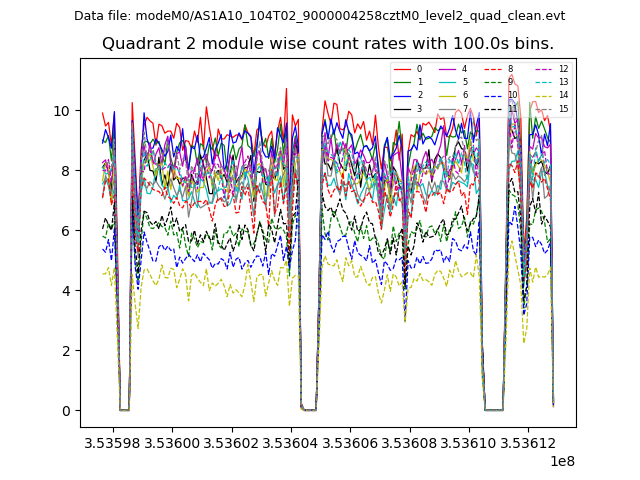
| Module-wise count rates for Quadrant A Data is divided into 100 sec bins |
 |
 |
| Module-wise count rates for Quadrant B Data is divided into 100 sec bins |
 |
 |
| Module-wise count rates for Quadrant C Data is divided into 100 sec bins |
 |
 |
| Module-wise count rates for Quadrant D Data is divided into 100 sec bins |
 |
 |
| Parameter | Plot |
|---|---|
| CZT HV Monitor |  |
| D_VDD |  |
| Temperature 1 | 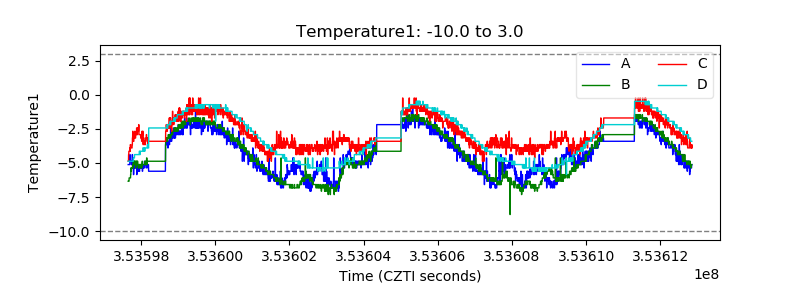 |
| Veto HV Monitor |  |
| Veto LLD |  |
| Alpha Counter |  |
| _CPM_Rate |  |
| CZT Counter |  |
| +2.5 Volts monitor |  |
| +5 Volts monitor | 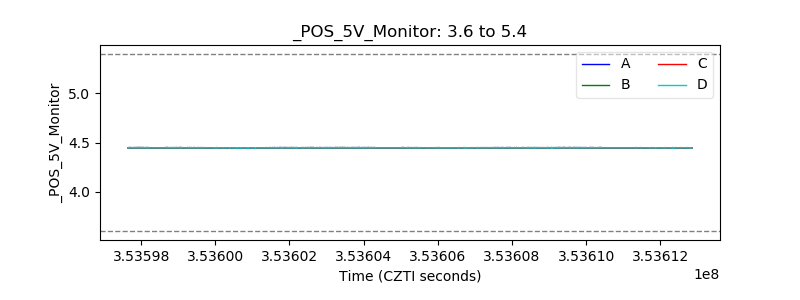 |
| _ROLL_ROT |  |
| _Roll_DEC | 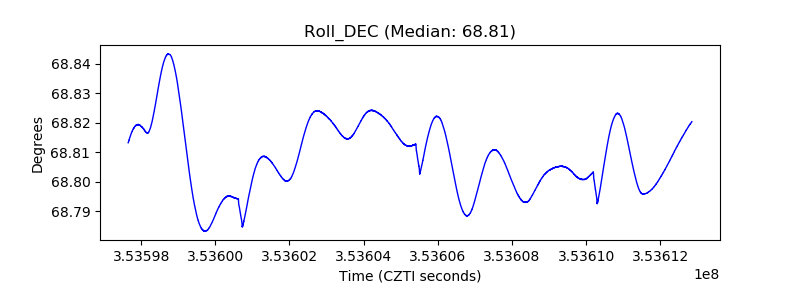 |
| _Roll_RA |  |
| Veto Counter |  |