| Param | Original file | Final file |
|---|---|---|
| Filename | modeM0/AS1A10_104T02_9000004258_29551cztM0_level2.evt | modeM0/AS1A10_104T02_9000004258_29551cztM0_level2_quad_clean.evt |
| Size (bytes) | 204,050,880 | 33,528,960 |
| Size | 194.6 MB | 32.0 MB |
| Events in quadrant A | 934,507 | 231,873 |
| Events in quadrant B | 1,042,869 | 240,319 |
| Events in quadrant C | 1,042,988 | 214,364 |
| Events in quadrant D | 3,034,545 | 195,890 |
| Mode M0 | |||
|---|---|---|---|
| Quadrant | BADHDUFLAG | Total packets | Discarded packets |
| A | 0 | 3826 | 1 |
| B | 0 | 4182 | 1 |
| C | 0 | 4206 | 1 |
| D | 0 | 10259 | 1 |
| Mode SS | |||
|---|---|---|---|
| Quadrant | BADHDUFLAG | Total packets | Discarded packets |
| A | 0 | 40 | 0 |
| B | 0 | 40 | 0 |
| C | 0 | 40 | 0 |
| D | 0 | 40 | 0 |
| Mode M9 | |||
|---|---|---|---|
| Quadrant | BADHDUFLAG | Total packets | Discarded packets |
| A | 0 | 4 | 0 |
| B | 0 | 4 | 0 |
| C | 0 | 4 | 0 |
| D | 0 | 4 | 0 |
| Quadrant | Total seconds | Saturated seconds | Saturation percentage |
|---|---|---|---|
| A | 1802 | 45 | 2.497225% |
| B | 1802 | 68 | 3.773585% |
| C | 1802 | 298 | 16.537181% |
| D | 1802 | 519 | 28.801332% |
Noise dominated data is calculated using 1-second bins in cleaned event files. If a bin has >2000 counts, and if more than 50% of those come from <1% of pixels, then it is considered to be noise-dominated and hence unusable.
| Quadrant | # 1 sec bins | Bins with >0 counts | Bins with >2000 counts | High rate bins dominated by noise | Noise dominated (total time) | Noise dominated (detector-on time) | Marked lightcurve |
|---|---|---|---|---|---|---|---|
| A | 2252 | 1803 | 1 | 1 | 0.04% | 0.06% | 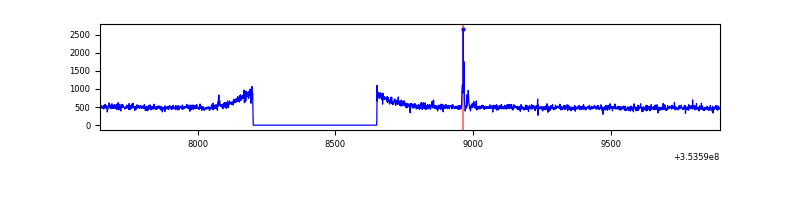 |
| B | 2252 | 1803 | 12 | 12 | 0.53% | 0.67% | 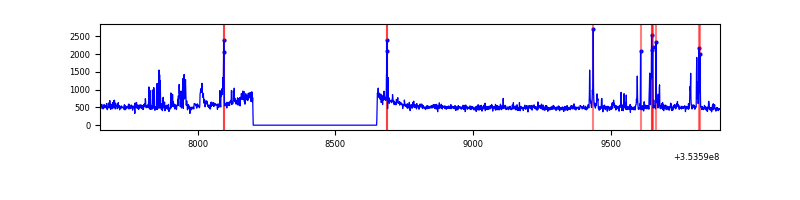 |
| C | 2252 | 1803 | 0 | 0 | 0.00% | 0.00% | 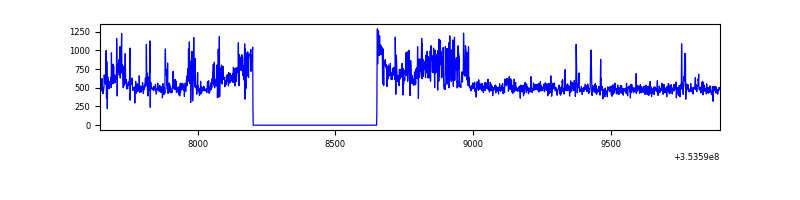 |
| D | 2252 | 1803 | 323 | 323 | 14.34% | 17.91% | 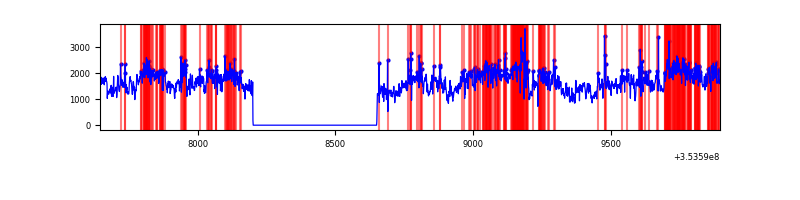 |
Top three noisy pixels from each quadrant. If the there are fewer than three noisy pixels in the level2.evt file, extra rows are filled as -1
| Pixel properties | Quadrant properties | ||||||
|---|---|---|---|---|---|---|---|
| Quadrant | DetID | PixID | Counts | Sigma | Mean | Median | Sigma |
| A | 0 | 13 | 16919 | 330.61 | 237 | 231 | 50.5 |
| A | 13 | 254 | 3206 | 58.94 | 237 | 231 | 50.5 |
| A | 3 | 137 | 2590 | 46.73 | 237 | 231 | 50.5 |
| B | 5 | 255 | 59176 | 1241.67 | 232 | 225 | 47.5 |
| B | 0 | 156 | 37353 | 782.02 | 232 | 225 | 47.5 |
| B | 0 | 230 | 12448 | 257.45 | 232 | 225 | 47.5 |
| C | 14 | 238 | 95092 | 1835.5 | 212 | 212 | 51.7 |
| C | 14 | 254 | 77495 | 1495.08 | 212 | 212 | 51.7 |
| C | 7 | 247 | 22082 | 423.09 | 212 | 212 | 51.7 |
| D | 8 | 195 | 1993699 | 37305.92 | 216 | 209 | 53.4 |
| D | 7 | 80 | 104614 | 1953.82 | 216 | 209 | 53.4 |
| D | 13 | 153 | 89321 | 1667.63 | 216 | 209 | 53.4 |
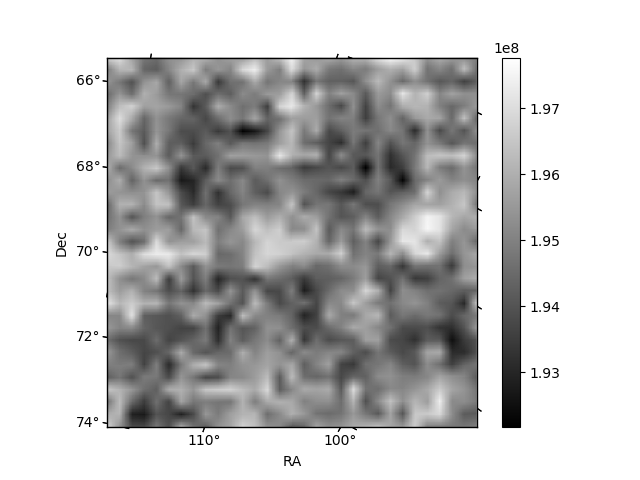
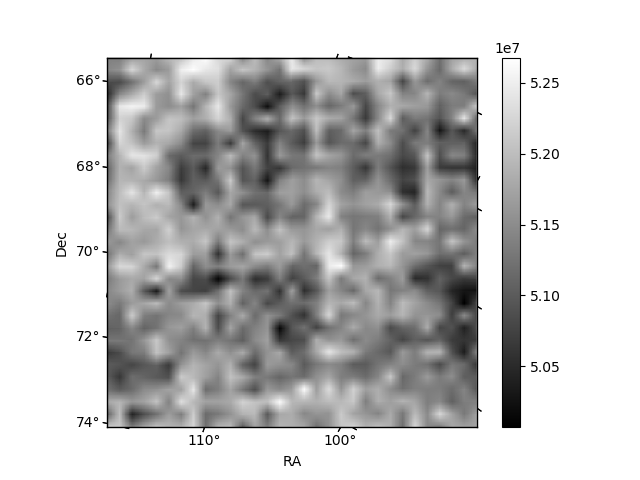
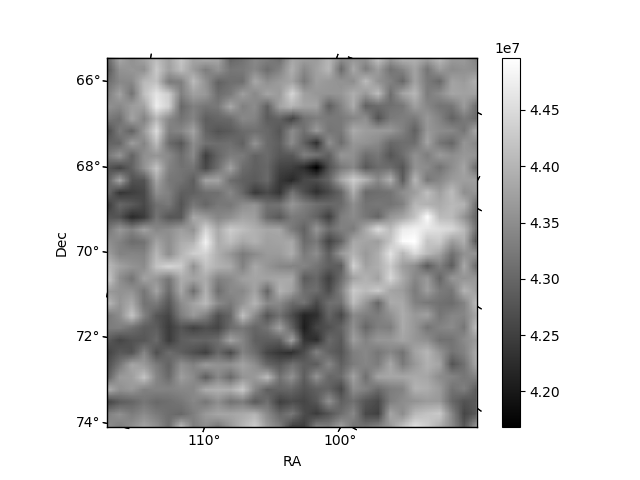
Histogram calculated using DETX and DETY for each event in the final _common_clean file
| Quadrant A | 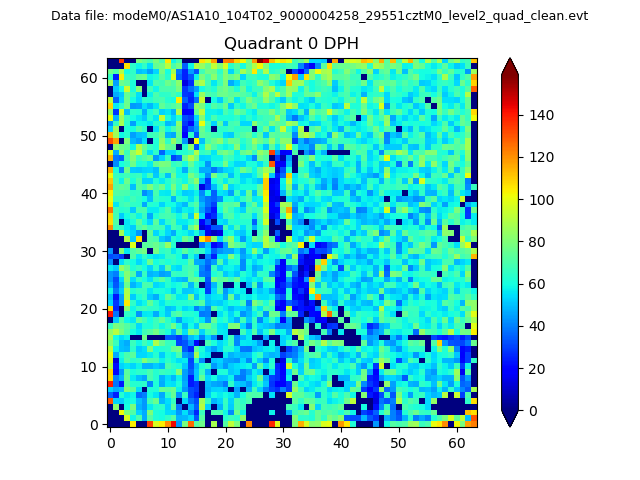 |
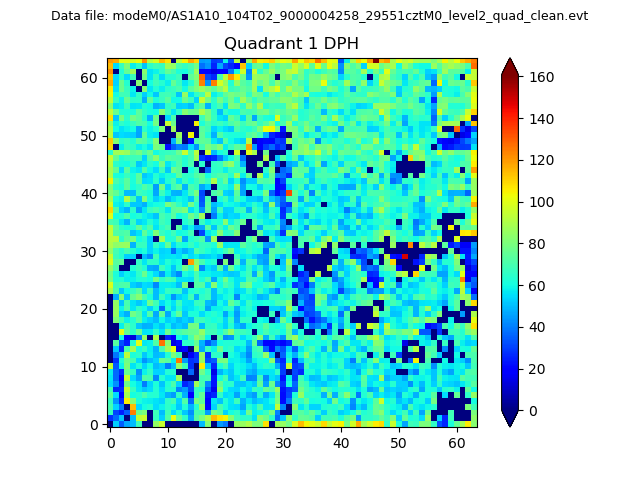 |
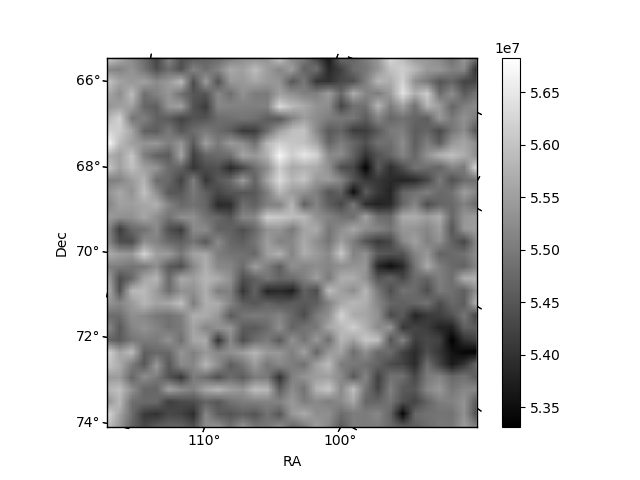
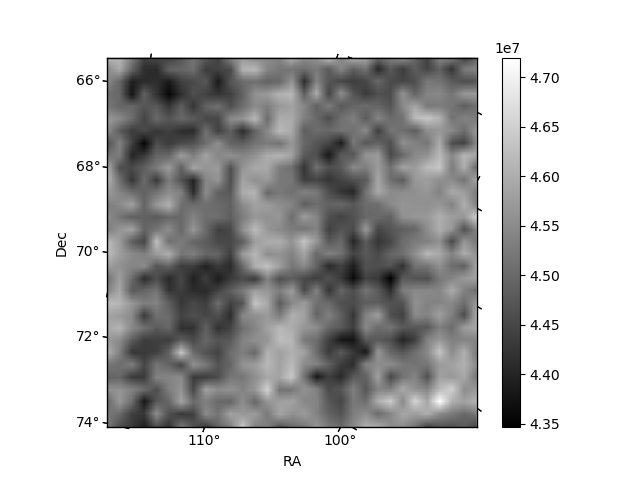
Quadrant B |
|---|---|---|---|
| Quadrant D | 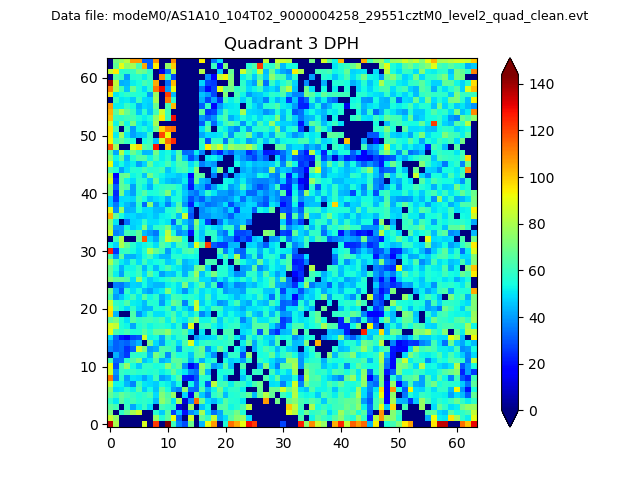 |
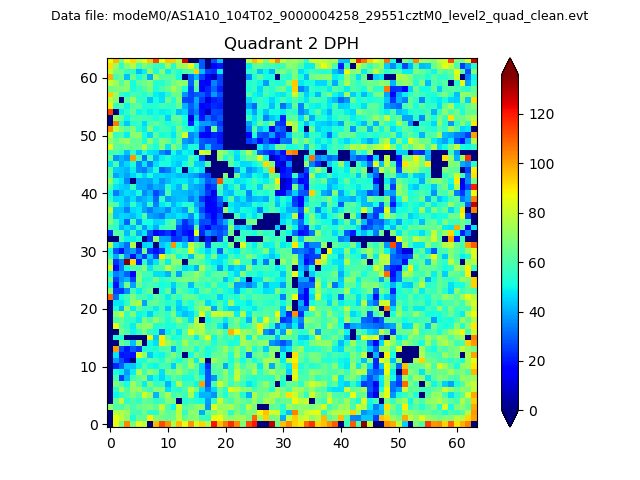 |
Quadrant C |
| Plot type | Count rate plots | Images |
|---|---|---|
| Comparison with Poisson distribution Blue bars denote a histogram of data divided into 1 sec bins. Red curve is a Poisson curve with rate = median count rate of data. |
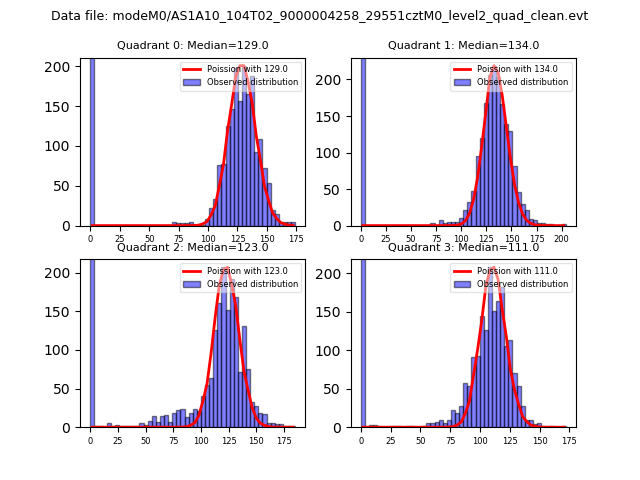 |
 |
| Quadrant-wise count rates Data is divided into 100 sec bins |
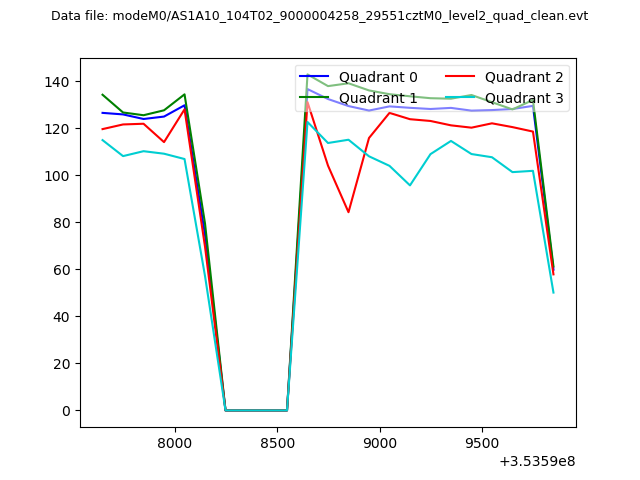 |
|
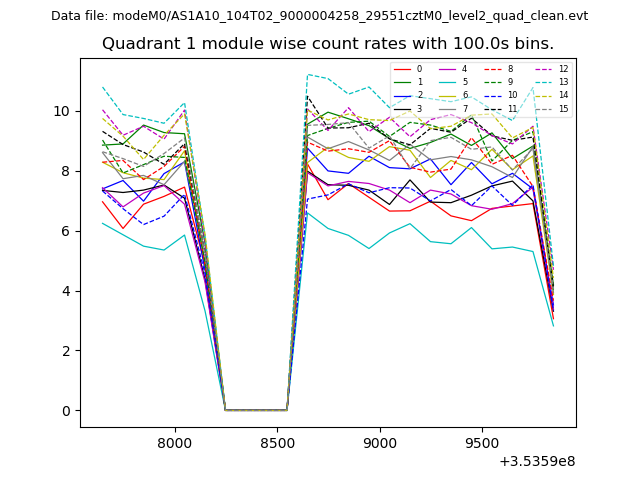
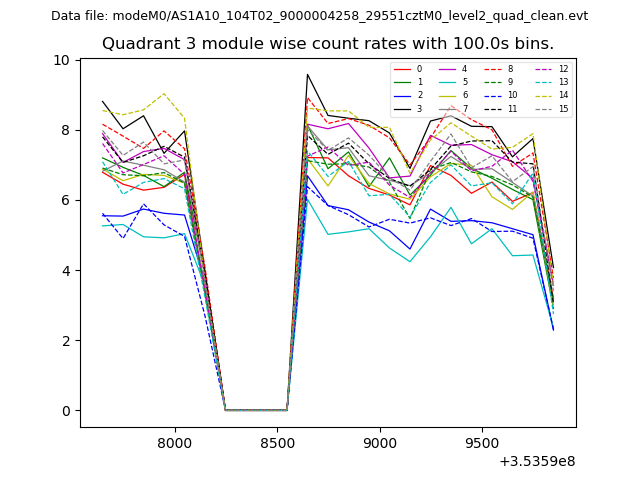
| Module-wise count rates for Quadrant A Data is divided into 100 sec bins |
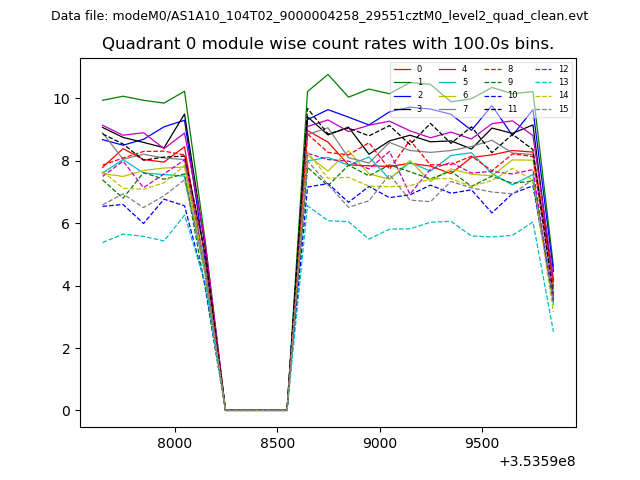 |
 |
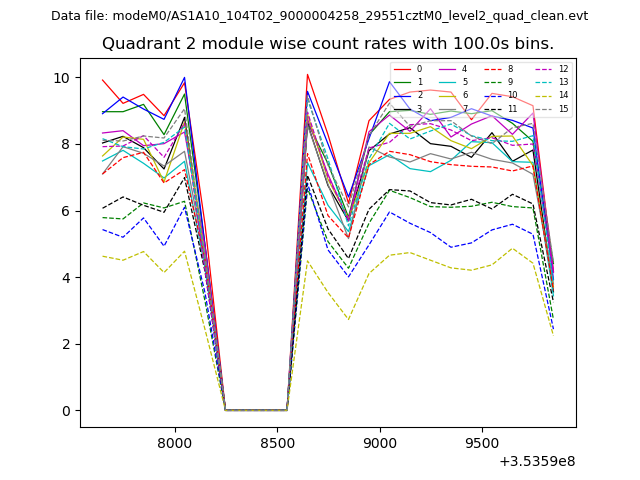
| Module-wise count rates for Quadrant B Data is divided into 100 sec bins |
 |
 |
| Module-wise count rates for Quadrant C Data is divided into 100 sec bins |
 |
 |
| Module-wise count rates for Quadrant D Data is divided into 100 sec bins |
 |
 |
| Parameter | Plot |
|---|---|
| CZT HV Monitor | 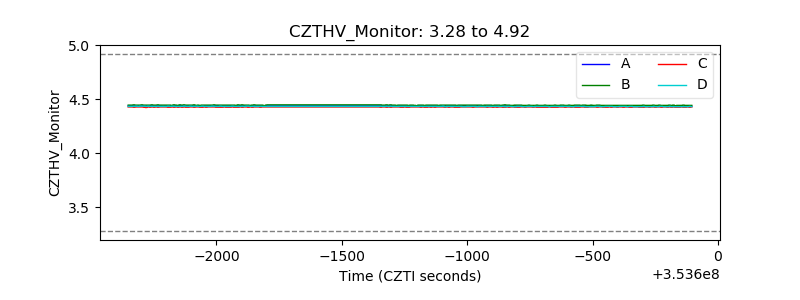 |
| D_VDD | 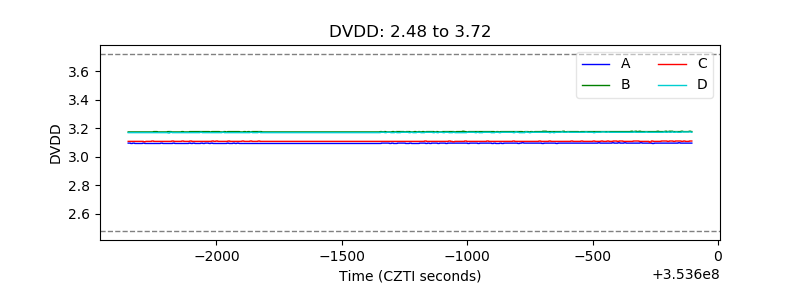 |
| Temperature 1 | 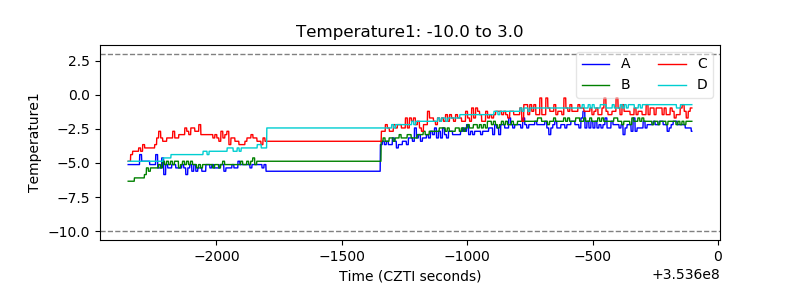 |
| Veto HV Monitor | 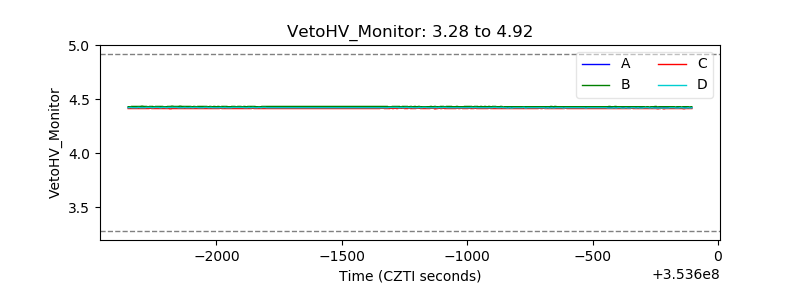 |
| Veto LLD | 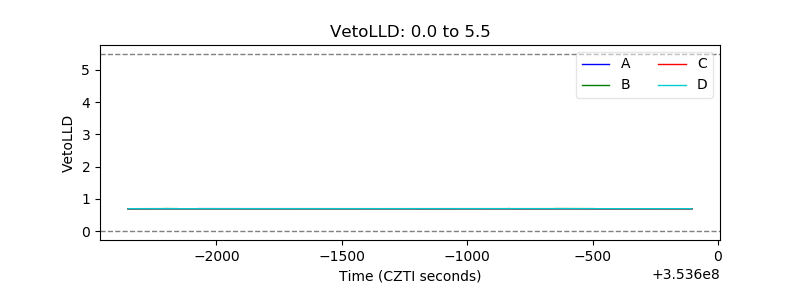 |
| Alpha Counter | 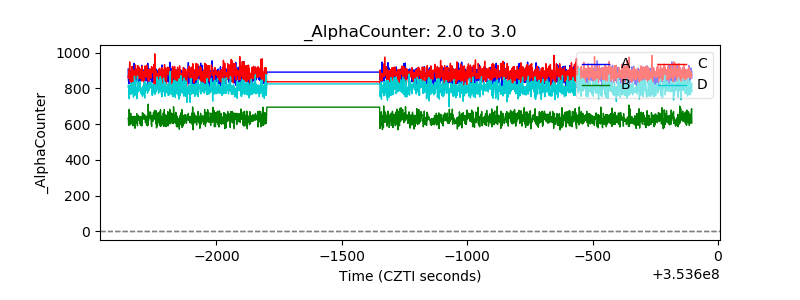 |
| _CPM_Rate | 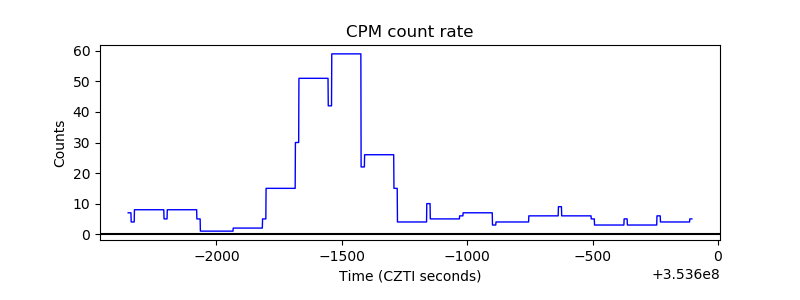 |
| CZT Counter | 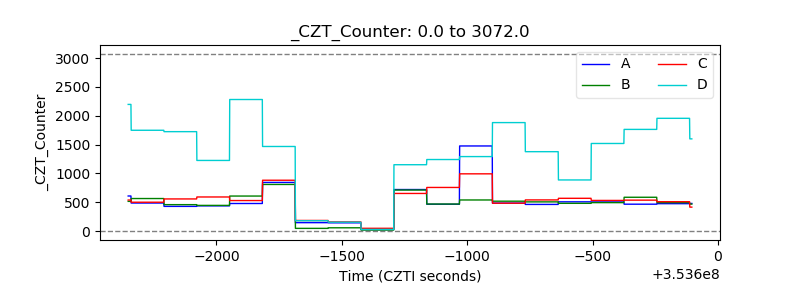 |
| +2.5 Volts monitor |  |
| +5 Volts monitor |  |
| _ROLL_ROT | 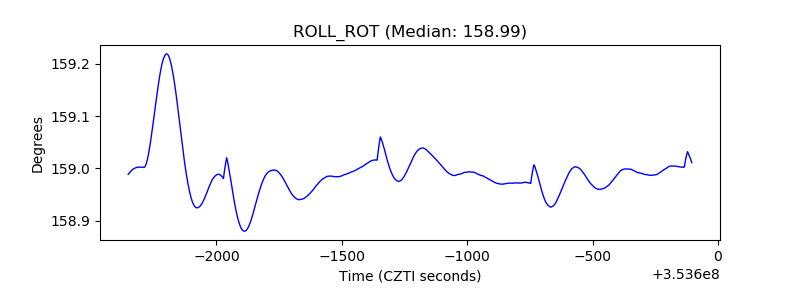 |
| _Roll_DEC | 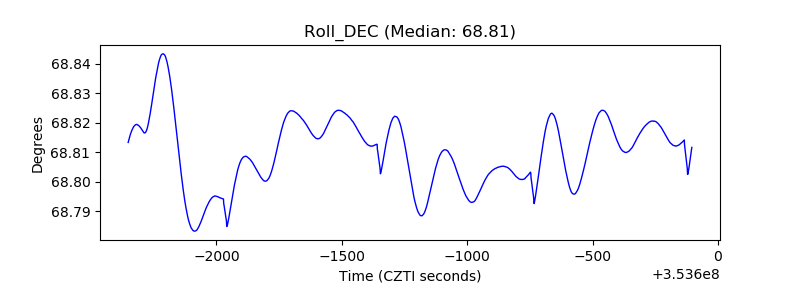 |
| _Roll_RA | 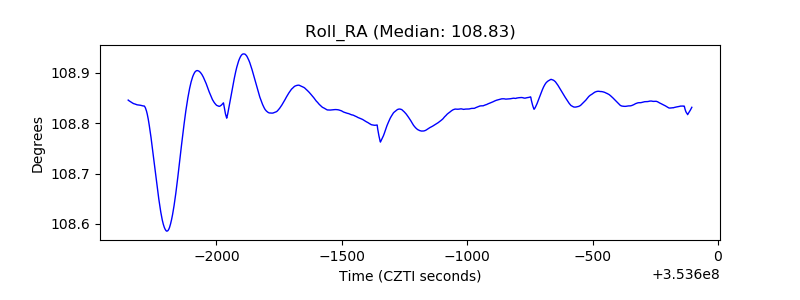 |
| Veto Counter | 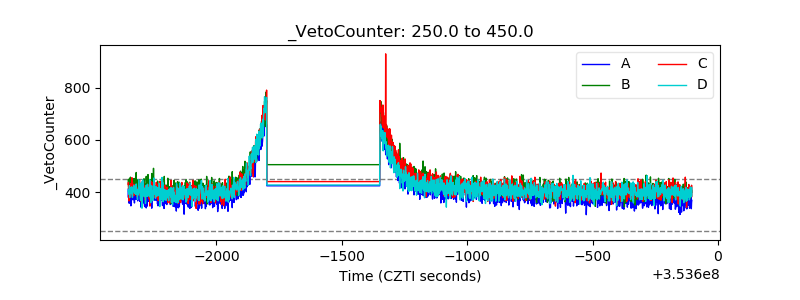 |