| Param | Original file | Final file |
|---|---|---|
| Filename | modeM0/AS1A10_104T02_9000004258_29552cztM0_level2.evt | modeM0/AS1A10_104T02_9000004258_29552cztM0_level2_quad_clean.evt |
| Size (bytes) | 386,665,920 | 67,484,160 |
| Size | 368.8 MB | 64.4 MB |
| Events in quadrant A | 1,607,763 | 462,106 |
| Events in quadrant B | 1,824,758 | 471,876 |
| Events in quadrant C | 1,791,215 | 441,040 |
| Events in quadrant D | 6,229,615 | 401,224 |
| Mode M0 | |||
|---|---|---|---|
| Quadrant | BADHDUFLAG | Total packets | Discarded packets |
| A | 0 | 7565 | 0 |
| B | 0 | 8076 | 0 |
| C | 0 | 7811 | 0 |
| D | 0 | 21106 | 0 |
| Mode SS | |||
|---|---|---|---|
| Quadrant | BADHDUFLAG | Total packets | Discarded packets |
| A | 0 | 76 | 0 |
| B | 0 | 76 | 0 |
| C | 0 | 76 | 0 |
| D | 0 | 76 | 0 |
| Quadrant | Total seconds | Saturated seconds | Saturation percentage |
|---|---|---|---|
| A | 3777 | 0 | 0.000000% |
| B | 3778 | 43 | 1.138168% |
| C | 3778 | 140 | 3.705664% |
| D | 3778 | 581 | 15.378507% |
Noise dominated data is calculated using 1-second bins in cleaned event files. If a bin has >2000 counts, and if more than 50% of those come from <1% of pixels, then it is considered to be noise-dominated and hence unusable.
| Quadrant | # 1 sec bins | Bins with >0 counts | Bins with >2000 counts | High rate bins dominated by noise | Noise dominated (total time) | Noise dominated (detector-on time) | Marked lightcurve |
|---|---|---|---|---|---|---|---|
| A | 3777 | 3777 | 0 | 0 | 0.00% | 0.00% | 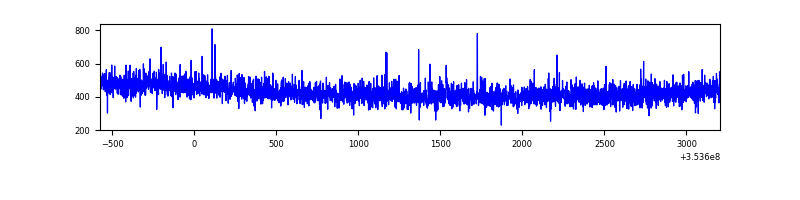 |
| B | 3778 | 3778 | 27 | 27 | 0.71% | 0.71% | 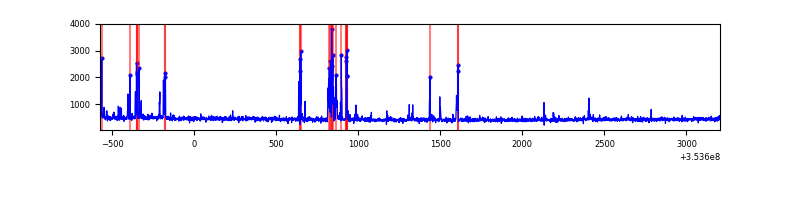 |
| C | 3778 | 3778 | 0 | 0 | 0.00% | 0.00% | 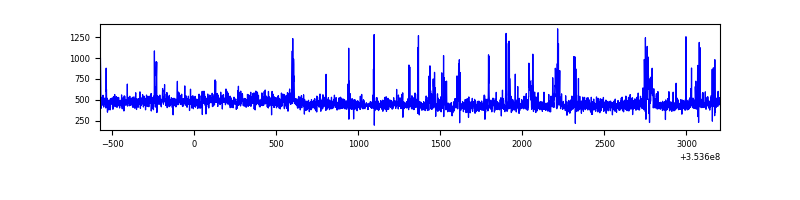 |
| D | 3778 | 3778 | 676 | 676 | 17.89% | 17.89% | 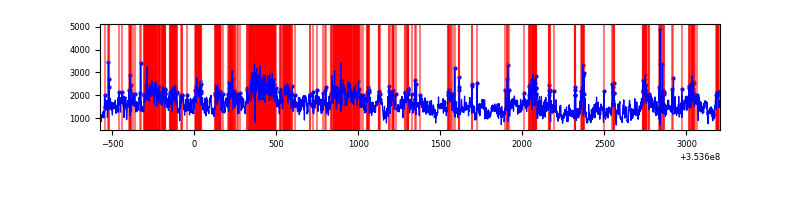 |
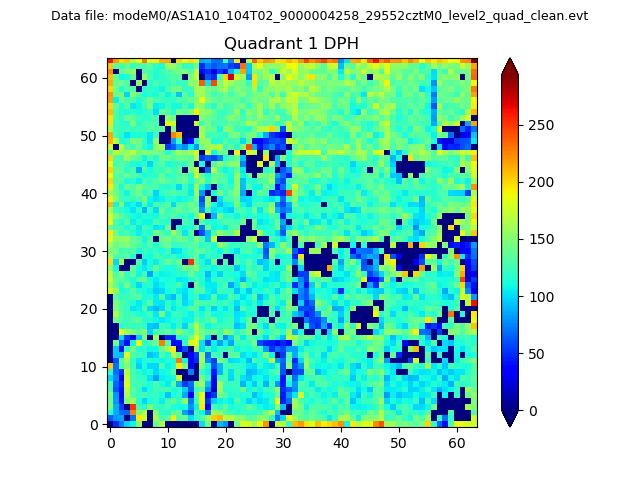
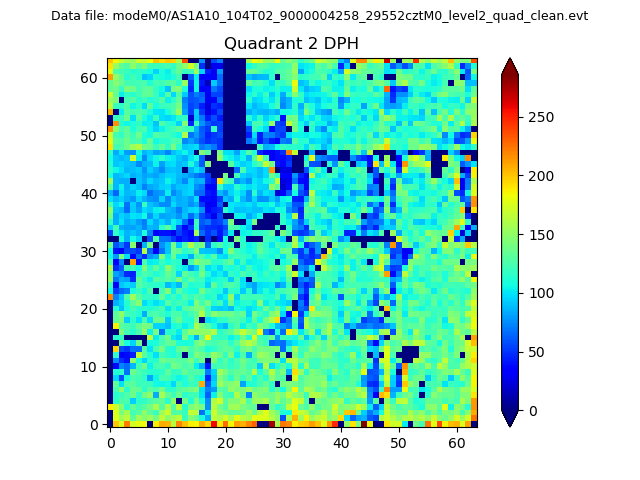
Top three noisy pixels from each quadrant. If the there are fewer than three noisy pixels in the level2.evt file, extra rows are filled as -1
| Pixel properties | Quadrant properties | ||||||
|---|---|---|---|---|---|---|---|
| Quadrant | DetID | PixID | Counts | Sigma | Mean | Median | Sigma |
| A | 13 | 254 | 7691 | 86.14 | 413 | 405 | 84.6 |
| A | 0 | 13 | 5531 | 60.6 | 413 | 405 | 84.6 |
| A | 3 | 137 | 4050 | 43.09 | 413 | 405 | 84.6 |
| B | 5 | 255 | 142949 | 1804.23 | 414 | 404 | 79.0 |
| B | 0 | 156 | 34859 | 436.11 | 414 | 404 | 79.0 |
| B | 12 | 111 | 9487 | 114.97 | 414 | 404 | 79.0 |
| C | 14 | 238 | 114175 | 1209.87 | 397 | 399 | 94.0 |
| C | 14 | 254 | 71308 | 754.03 | 397 | 399 | 94.0 |
| C | 3 | 233 | 29978 | 314.54 | 397 | 399 | 94.0 |
| D | 8 | 195 | 4229541 | 45248.4 | 390 | 379 | 93.5 |
| D | 7 | 80 | 219301 | 2342.27 | 390 | 379 | 93.5 |
| D | 12 | 33 | 177074 | 1890.48 | 390 | 379 | 93.5 |
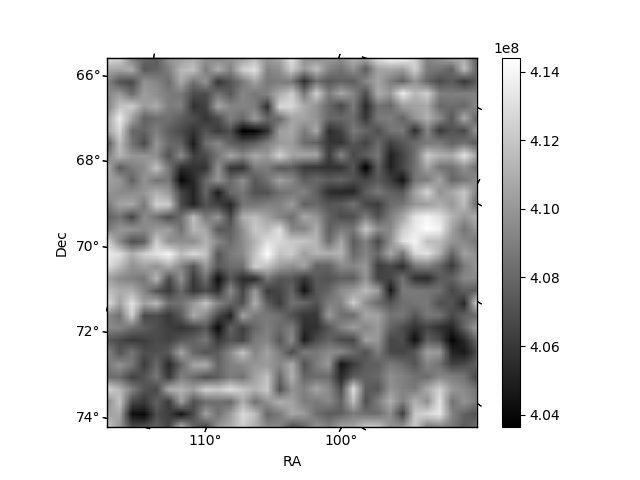
Histogram calculated using DETX and DETY for each event in the final _common_clean file
| Quadrant A | 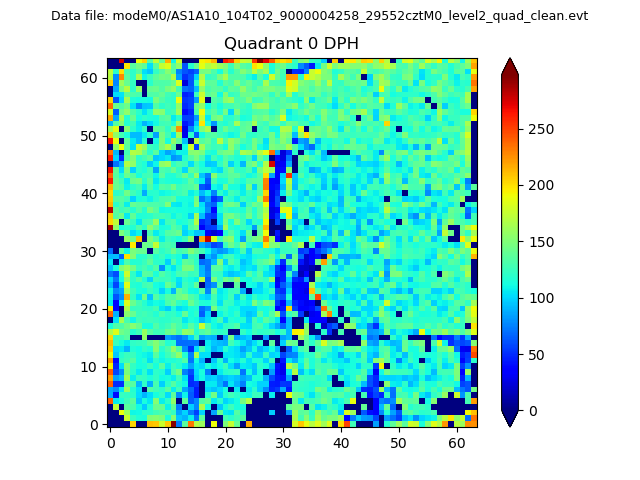 |
 |
Quadrant B |
|---|---|---|---|
| Quadrant D | 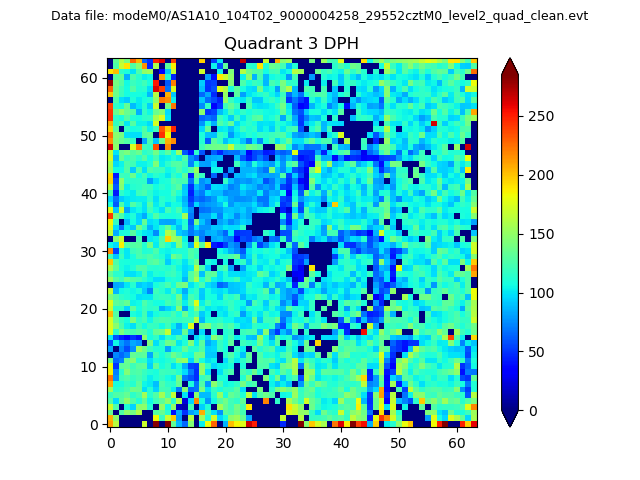 |
 |
Quadrant C |
| Plot type | Count rate plots | Images |
|---|---|---|
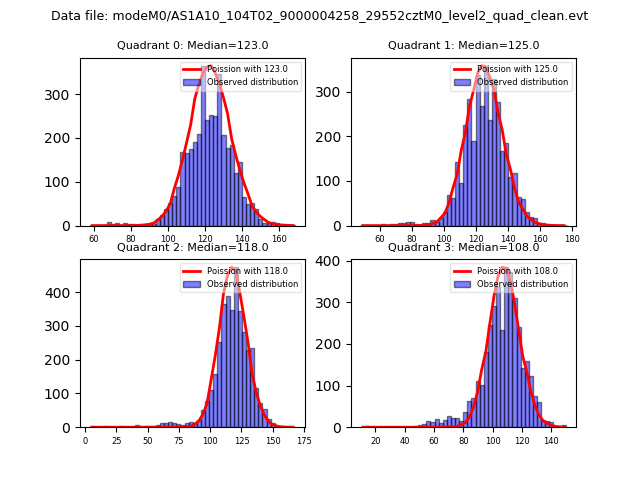
| Comparison with Poisson distribution Blue bars denote a histogram of data divided into 1 sec bins. Red curve is a Poisson curve with rate = median count rate of data. |
 |
 |
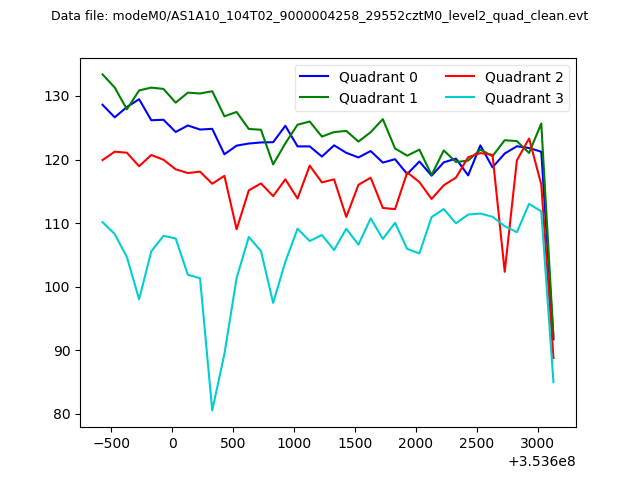
| Quadrant-wise count rates Data is divided into 100 sec bins |
 |
|
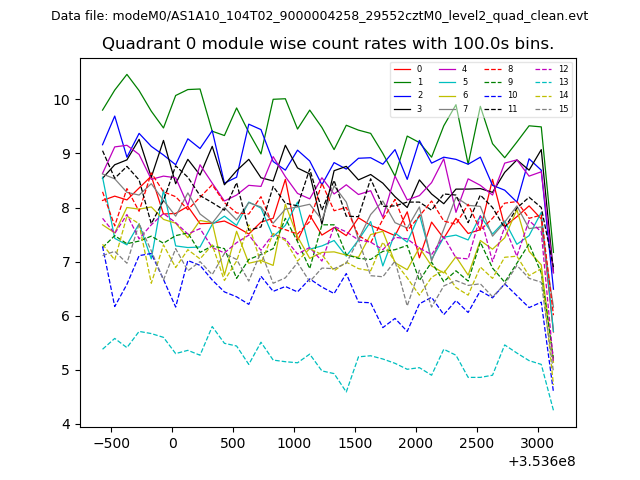
| Module-wise count rates for Quadrant A Data is divided into 100 sec bins |
 |
 |
| Module-wise count rates for Quadrant B Data is divided into 100 sec bins |
 |
 |
| Module-wise count rates for Quadrant C Data is divided into 100 sec bins |
 |
 |
| Module-wise count rates for Quadrant D Data is divided into 100 sec bins |
 |
 |
| Parameter | Plot |
|---|---|
| CZT HV Monitor | 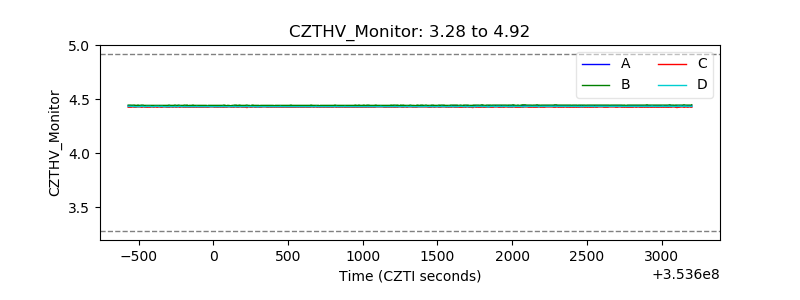 |
| D_VDD | 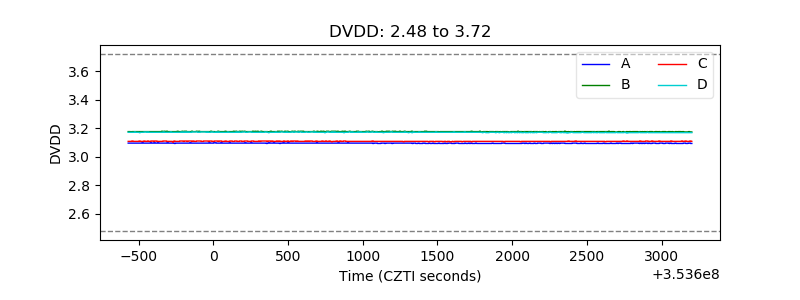 |
| Temperature 1 |  |
| Veto HV Monitor | 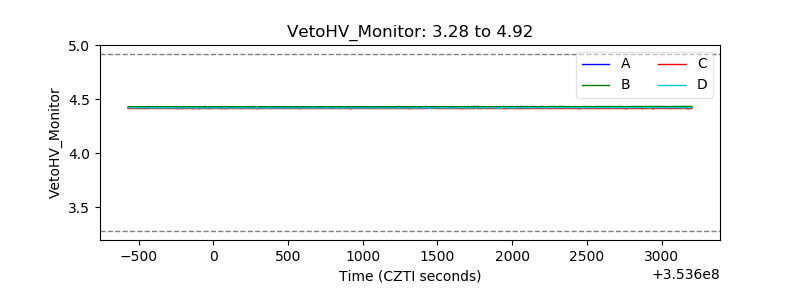 |
| Veto LLD |  |
| Alpha Counter | 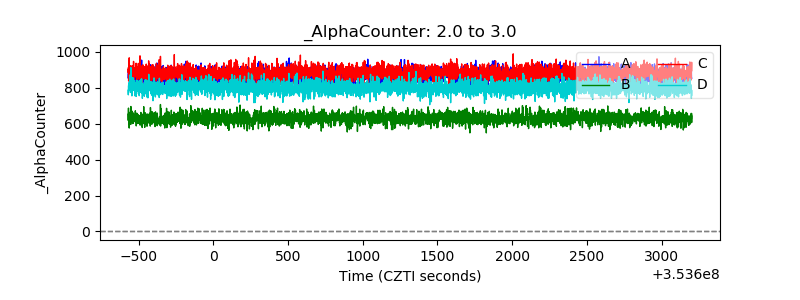 |
| _CPM_Rate | 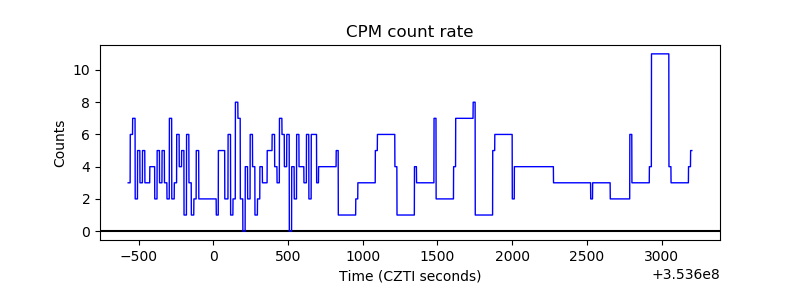 |
| CZT Counter | 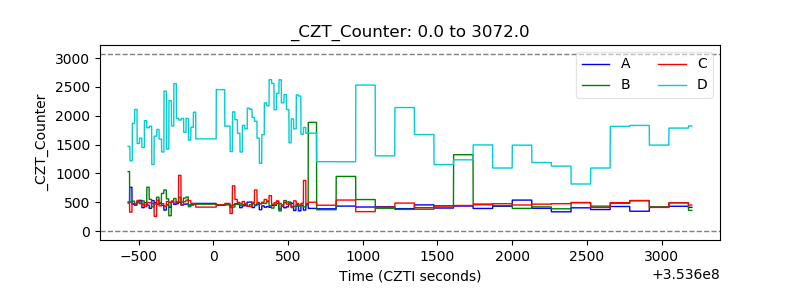 |
| +2.5 Volts monitor |  |
| +5 Volts monitor |  |
| _ROLL_ROT | 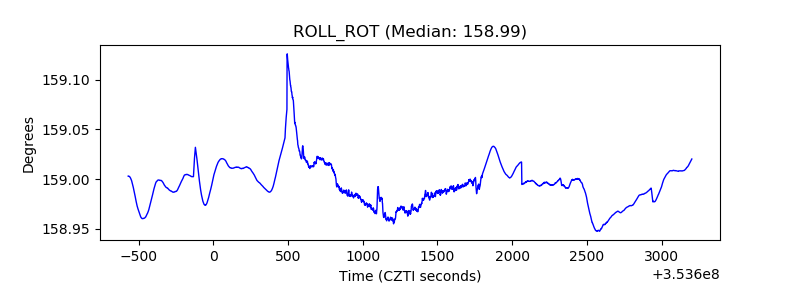 |
| _Roll_DEC | 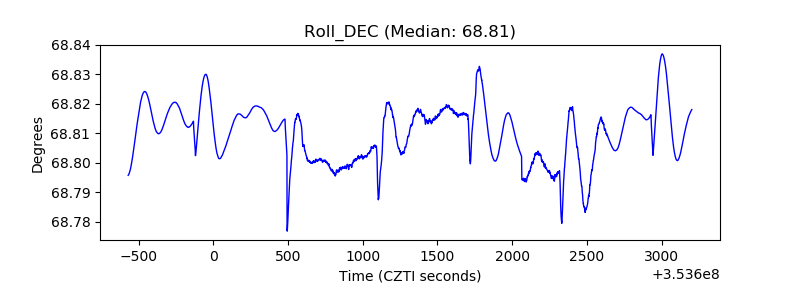 |
| _Roll_RA | 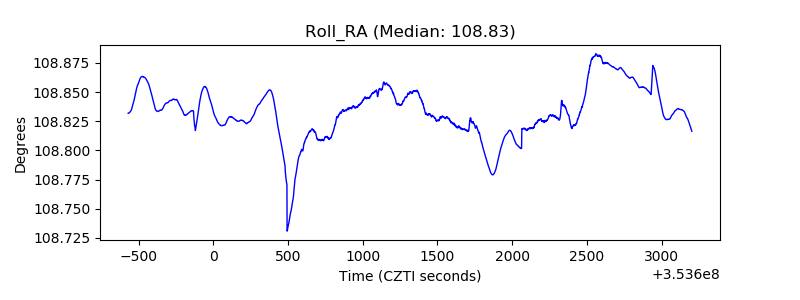 |
| Veto Counter | 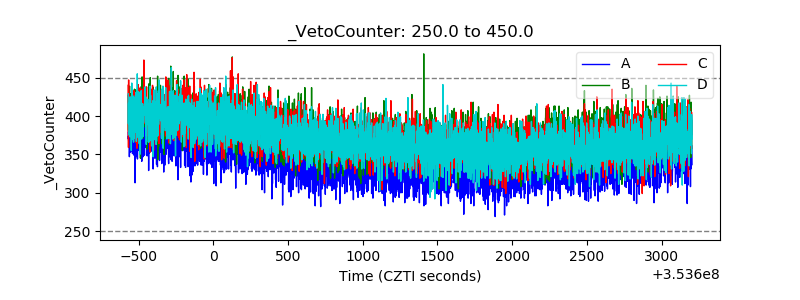 |