| Param | Original file | Final file |
|---|---|---|
| Filename | modeM0/AS1A10_104T02_9000004258_29553cztM0_level2.evt | modeM0/AS1A10_104T02_9000004258_29553cztM0_level2_quad_clean.evt |
| Size (bytes) | 863,262,720 | 158,855,040 |
| Size | 823.3 MB | 151.5 MB |
| Events in quadrant A | 4,054,184 | 1,095,893 |
| Events in quadrant B | 4,332,753 | 1,130,839 |
| Events in quadrant C | 4,541,866 | 1,031,618 |
| Events in quadrant D | 12,632,583 | 953,013 |
| Mode M0 | |||
|---|---|---|---|
| Quadrant | BADHDUFLAG | Total packets | Discarded packets |
| A | 0 | 17695 | 2 |
| B | 0 | 18421 | 2 |
| C | 0 | 18817 | 2 |
| D | 0 | 43621 | 2 |
| Mode SS | |||
|---|---|---|---|
| Quadrant | BADHDUFLAG | Total packets | Discarded packets |
| A | 0 | 176 | 0 |
| B | 0 | 176 | 0 |
| C | 0 | 176 | 0 |
| D | 0 | 176 | 0 |
| Mode M9 | |||
|---|---|---|---|
| Quadrant | BADHDUFLAG | Total packets | Discarded packets |
| A | 0 | 15 | 0 |
| B | 0 | 15 | 0 |
| C | 0 | 15 | 0 |
| D | 0 | 15 | 0 |
| Quadrant | Total seconds | Saturated seconds | Saturation percentage |
|---|---|---|---|
| A | 8633 | 79 | 0.915093% |
| B | 8634 | 141 | 1.633079% |
| C | 8634 | 763 | 8.837155% |
| D | 8634 | 1473 | 17.060459% |
Noise dominated data is calculated using 1-second bins in cleaned event files. If a bin has >2000 counts, and if more than 50% of those come from <1% of pixels, then it is considered to be noise-dominated and hence unusable.
| Quadrant | # 1 sec bins | Bins with >0 counts | Bins with >2000 counts | High rate bins dominated by noise | Noise dominated (total time) | Noise dominated (detector-on time) | Marked lightcurve |
|---|---|---|---|---|---|---|---|
| A | 10113 | 8634 | 0 | 0 | 0.00% | 0.00% | 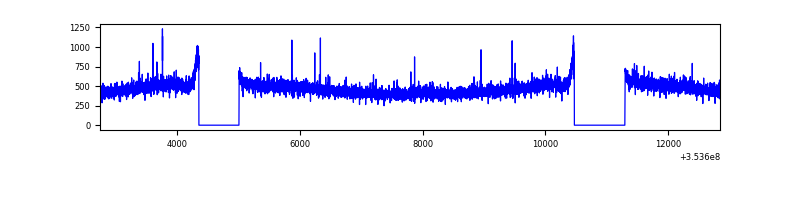 |
| B | 10114 | 8636 | 32 | 32 | 0.32% | 0.37% | 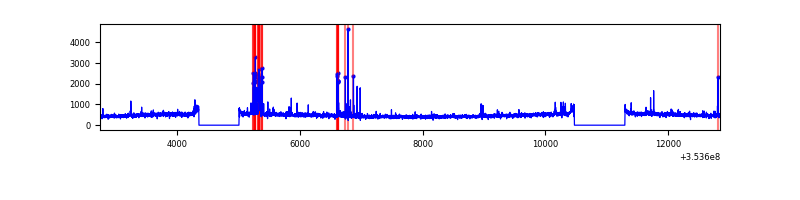 |
| C | 10114 | 8635 | 0 | 0 | 0.00% | 0.00% | 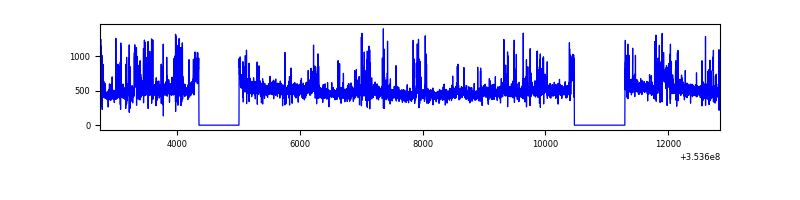 |
| D | 10114 | 8634 | 1018 | 1018 | 10.07% | 11.79% | 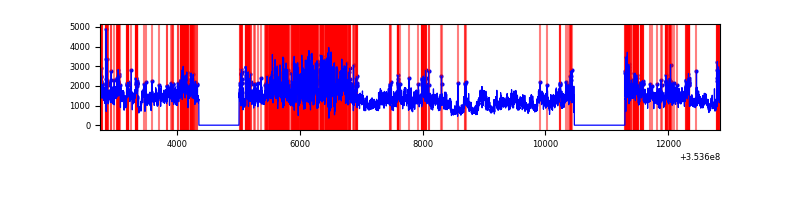 |
Top three noisy pixels from each quadrant. If the there are fewer than three noisy pixels in the level2.evt file, extra rows are filled as -1
| Pixel properties | Quadrant properties | ||||||
|---|---|---|---|---|---|---|---|
| Quadrant | DetID | PixID | Counts | Sigma | Mean | Median | Sigma |
| A | 0 | 13 | 36290 | 167.06 | 1041 | 1017 | 211.1 |
| A | 13 | 254 | 17146 | 76.39 | 1041 | 1017 | 211.1 |
| A | 3 | 137 | 10435 | 44.61 | 1041 | 1017 | 211.1 |
| B | 0 | 156 | 93048 | 465.73 | 1036 | 1008 | 197.6 |
| B | 5 | 255 | 73998 | 369.34 | 1036 | 1008 | 197.6 |
| B | 0 | 189 | 38749 | 190.97 | 1036 | 1008 | 197.6 |
| C | 14 | 238 | 353794 | 1564.04 | 964 | 969 | 225.6 |
| C | 14 | 254 | 274689 | 1213.38 | 964 | 969 | 225.6 |
| C | 7 | 247 | 93776 | 411.41 | 964 | 969 | 225.6 |
| D | 8 | 195 | 6947419 | 30353.19 | 959 | 933 | 228.9 |
| D | 7 | 80 | 1212402 | 5293.6 | 959 | 933 | 228.9 |
| D | 13 | 153 | 326012 | 1420.46 | 959 | 933 | 228.9 |
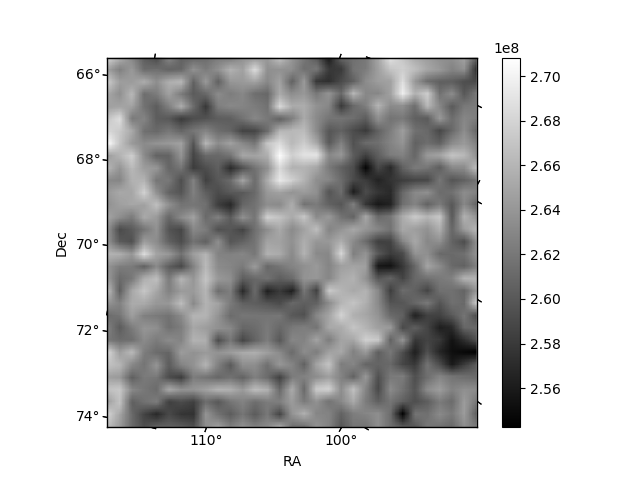
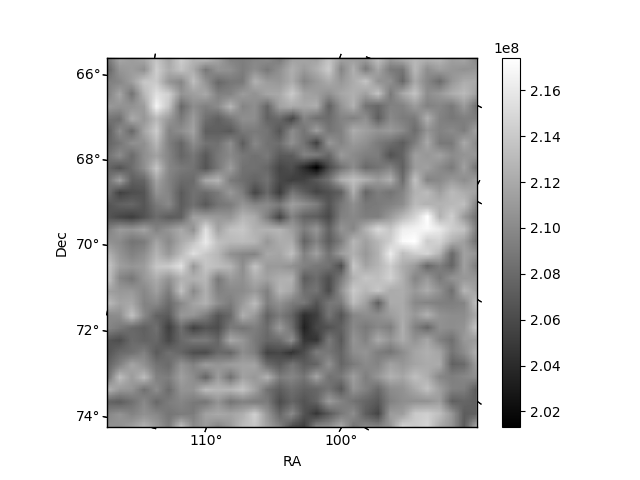
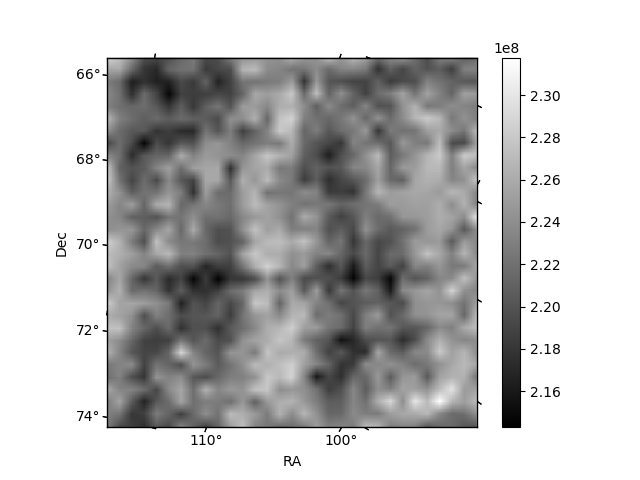
Histogram calculated using DETX and DETY for each event in the final _common_clean file
| Quadrant A |  |
 |
Quadrant B |
|---|---|---|---|
| Quadrant D |  |
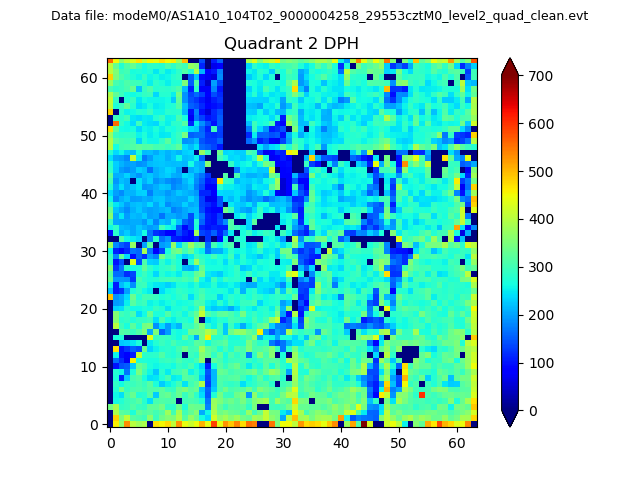 |
Quadrant C |
| Plot type | Count rate plots | Images |
|---|---|---|
| Comparison with Poisson distribution Blue bars denote a histogram of data divided into 1 sec bins. Red curve is a Poisson curve with rate = median count rate of data. |
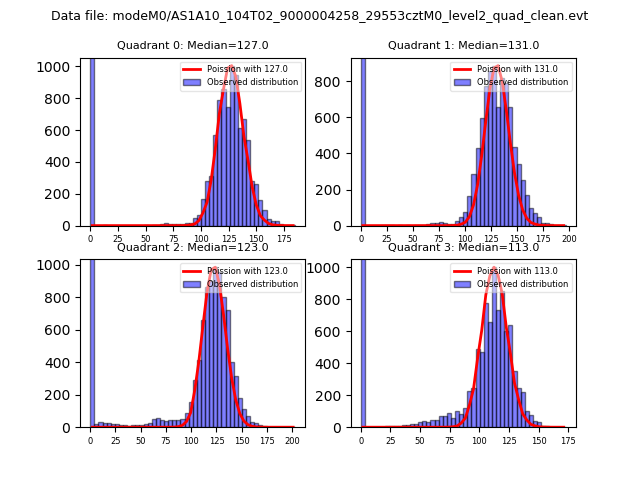 |
 |
| Quadrant-wise count rates Data is divided into 100 sec bins |
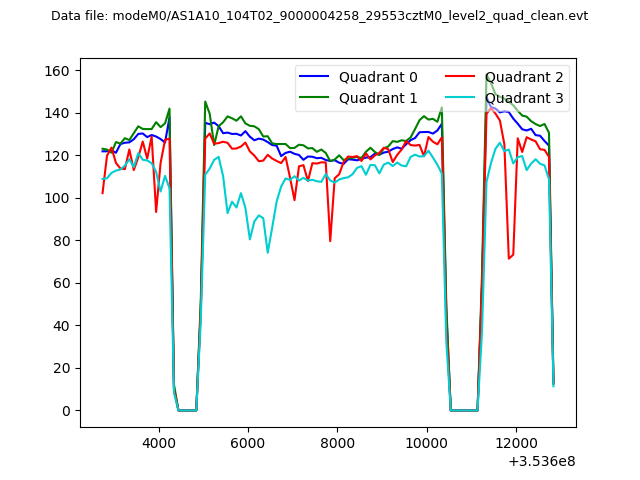 |
|
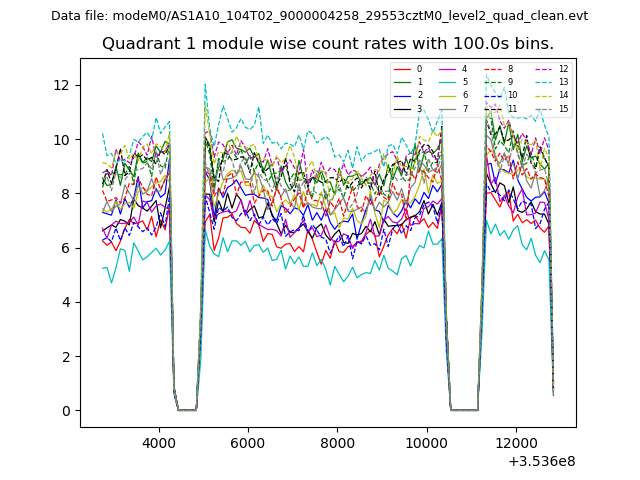
| Module-wise count rates for Quadrant A Data is divided into 100 sec bins |
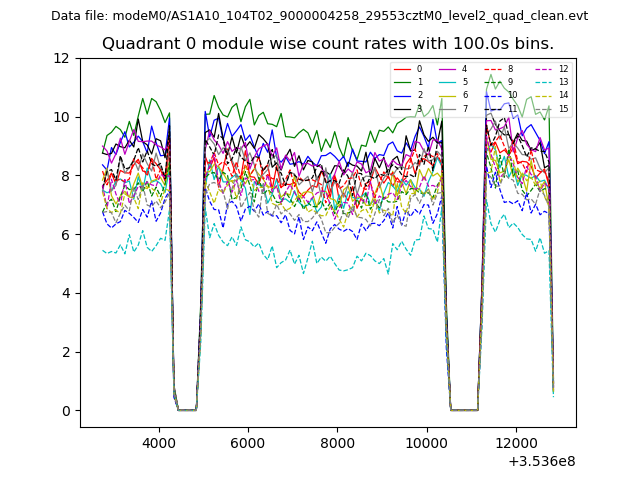 |
 |
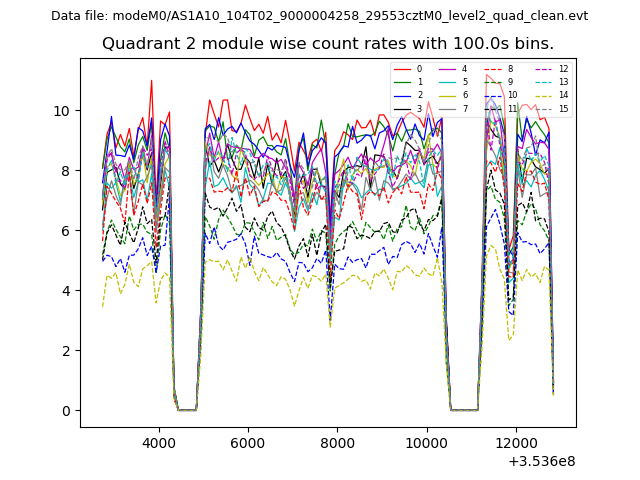
| Module-wise count rates for Quadrant B Data is divided into 100 sec bins |
 |
 |
| Module-wise count rates for Quadrant C Data is divided into 100 sec bins |
 |
 |
| Module-wise count rates for Quadrant D Data is divided into 100 sec bins |
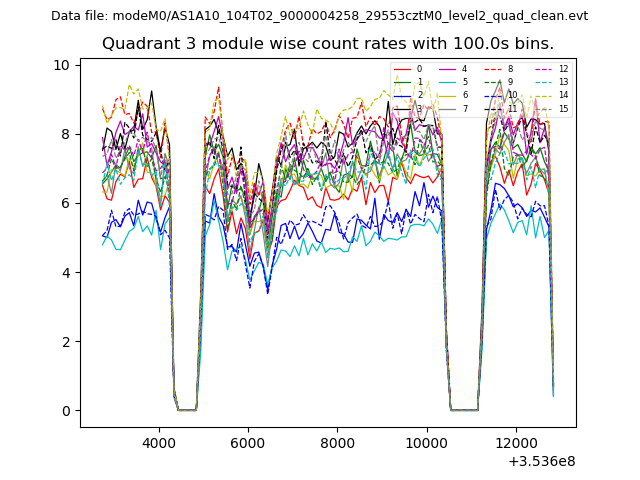 |
 |
| Parameter | Plot |
|---|---|
| CZT HV Monitor | 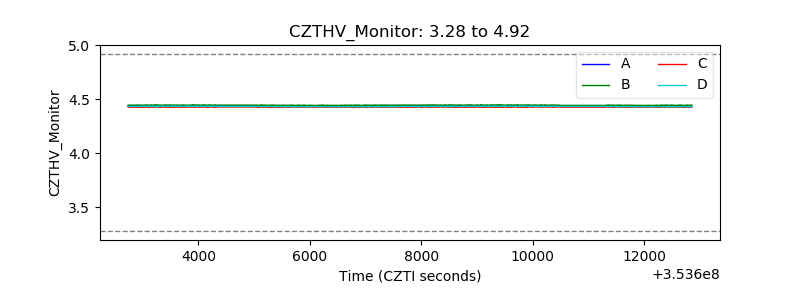 |
| D_VDD | 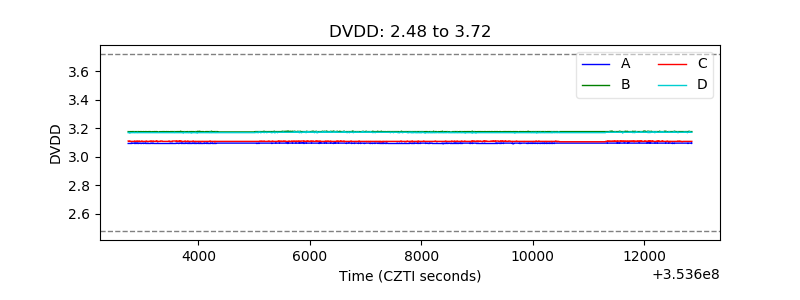 |
| Temperature 1 |  |
| Veto HV Monitor | 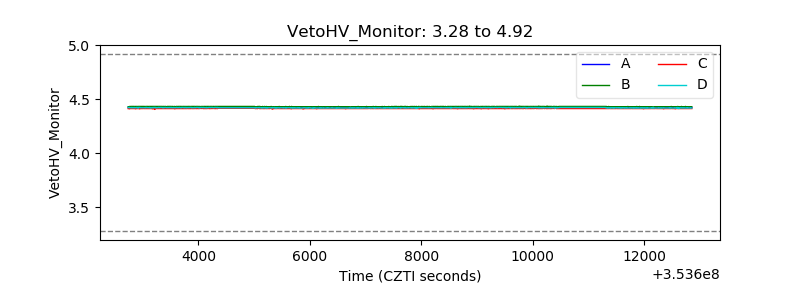 |
| Veto LLD |  |
| Alpha Counter | 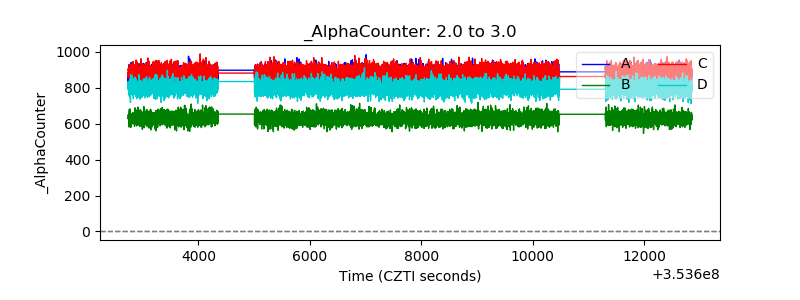 |
| _CPM_Rate | 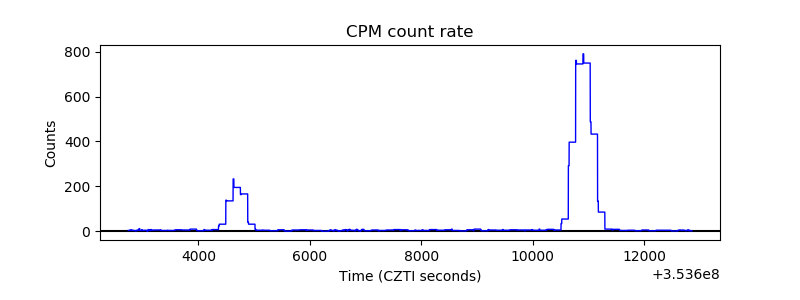 |
| CZT Counter |  |
| +2.5 Volts monitor |  |
| +5 Volts monitor | 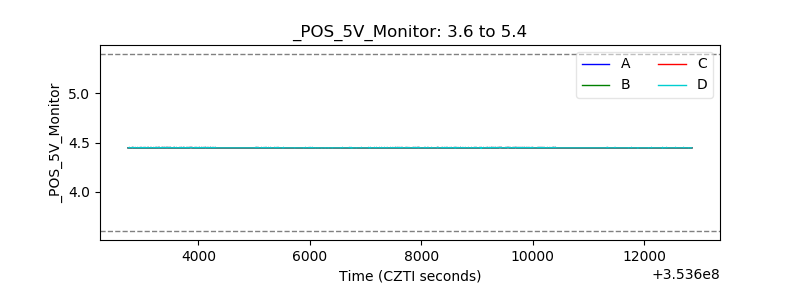 |
| _ROLL_ROT | 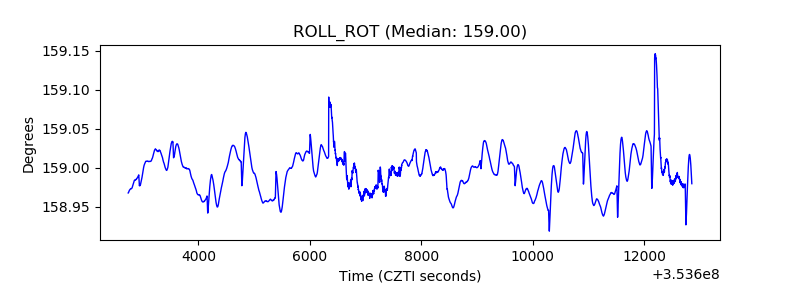 |
| _Roll_DEC | 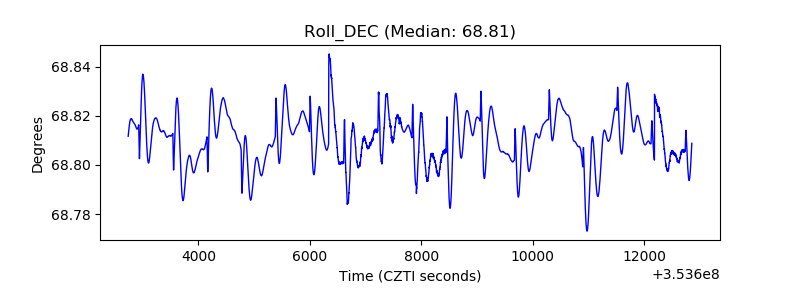 |
| _Roll_RA |  |
| Veto Counter | 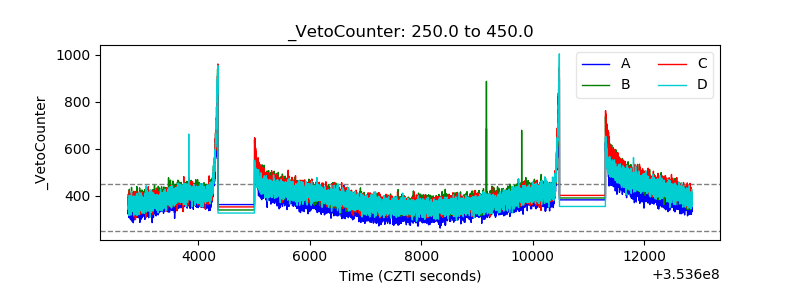 |