| Param | Original file | Final file |
|---|---|---|
| Filename | modeM0/AS1C05_019T01_9000004264_29557cztM0_level2.evt | modeM0/AS1C05_019T01_9000004264_29557cztM0_level2_quad_clean.evt |
| Size (bytes) | 556,240,320 | 115,565,760 |
| Size | 530.5 MB | 110.2 MB |
| Events in quadrant A | 3,025,251 | 801,341 |
| Events in quadrant B | 3,352,090 | 840,698 |
| Events in quadrant C | 3,392,436 | 755,599 |
| Events in quadrant D | 6,661,737 | 675,801 |
| Mode SS | |||
|---|---|---|---|
| Quadrant | BADHDUFLAG | Total packets | Discarded packets |
| A | 0 | 124 | 0 |
| B | 0 | 124 | 0 |
| C | 0 | 124 | 0 |
| D | 0 | 124 | 0 |
| Mode M0 | |||
|---|---|---|---|
| Quadrant | BADHDUFLAG | Total packets | Discarded packets |
| A | 0 | 12932 | 2 |
| B | 0 | 13916 | 2 |
| C | 0 | 14012 | 2 |
| D | 0 | 23856 | 3 |
| Mode M9 | |||
|---|---|---|---|
| Quadrant | BADHDUFLAG | Total packets | Discarded packets |
| A | 0 | 14 | 0 |
| B | 0 | 15 | 0 |
| C | 0 | 15 | 0 |
| D | 0 | 15 | 0 |
| Quadrant | Total seconds | Saturated seconds | Saturation percentage |
|---|---|---|---|
| A | 6101 | 18 | 0.295034% |
| B | 6101 | 41 | 0.672021% |
| C | 6101 | 657 | 10.768726% |
| D | 6100 | 1536 | 25.180328% |
Noise dominated data is calculated using 1-second bins in cleaned event files. If a bin has >2000 counts, and if more than 50% of those come from <1% of pixels, then it is considered to be noise-dominated and hence unusable.
| Quadrant | # 1 sec bins | Bins with >0 counts | Bins with >2000 counts | High rate bins dominated by noise | Noise dominated (total time) | Noise dominated (detector-on time) | Marked lightcurve |
|---|---|---|---|---|---|---|---|
| A | 7441 | 6103 | 0 | 0 | 0.00% | 0.00% | 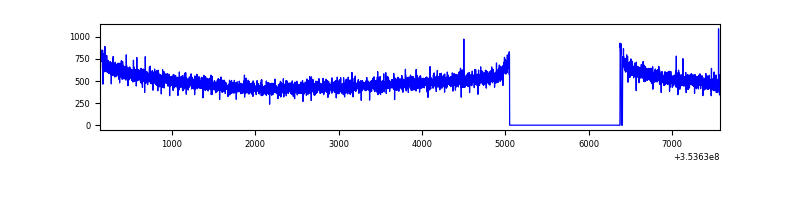 |
| B | 7441 | 6103 | 5 | 5 | 0.07% | 0.08% | 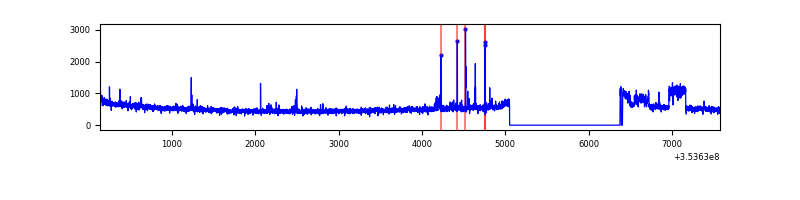 |
| C | 7441 | 6103 | 0 | 0 | 0.00% | 0.00% | 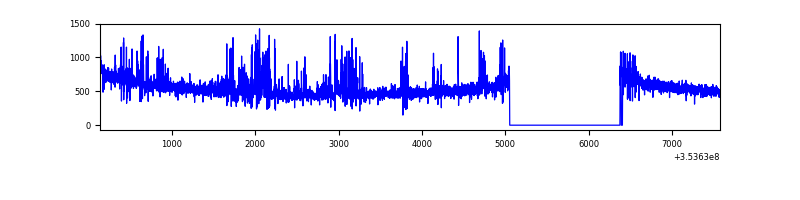 |
| D | 7440 | 6101 | 1374 | 1374 | 18.47% | 22.52% | 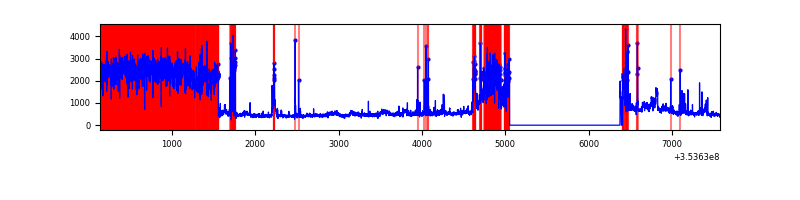 |
Top three noisy pixels from each quadrant. If the there are fewer than three noisy pixels in the level2.evt file, extra rows are filled as -1
| Pixel properties | Quadrant properties | ||||||
|---|---|---|---|---|---|---|---|
| Quadrant | DetID | PixID | Counts | Sigma | Mean | Median | Sigma |
| A | 13 | 254 | 12112 | 73.51 | 782 | 769 | 154.3 |
| A | 3 | 137 | 7174 | 41.51 | 782 | 769 | 154.3 |
| A | 0 | 226 | 6701 | 38.45 | 782 | 769 | 154.3 |
| B | 0 | 189 | 212167 | 1438.93 | 792 | 775 | 146.9 |
| B | 12 | 111 | 17011 | 110.52 | 792 | 775 | 146.9 |
| B | 11 | 111 | 15311 | 98.95 | 792 | 775 | 146.9 |
| C | 14 | 238 | 278226 | 1673.21 | 724 | 732 | 165.8 |
| C | 14 | 254 | 234214 | 1407.83 | 724 | 732 | 165.8 |
| C | 3 | 233 | 42060 | 249.2 | 724 | 732 | 165.8 |
| D | 8 | 195 | 2371189 | 14708.93 | 683 | 666 | 161.2 |
| D | 13 | 172 | 683253 | 4235.4 | 683 | 666 | 161.2 |
| D | 12 | 33 | 415802 | 2575.89 | 683 | 666 | 161.2 |
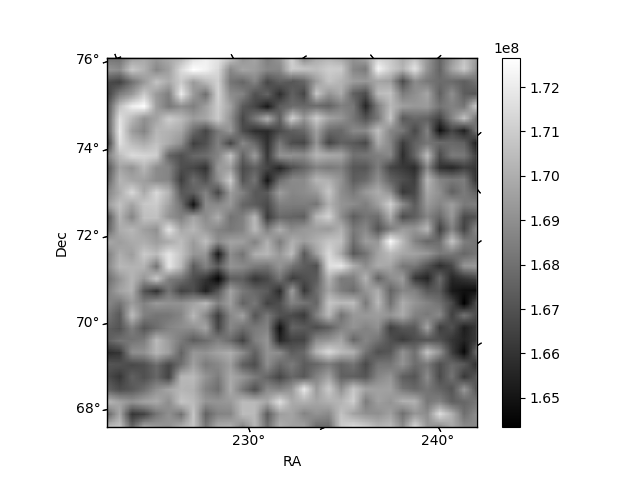
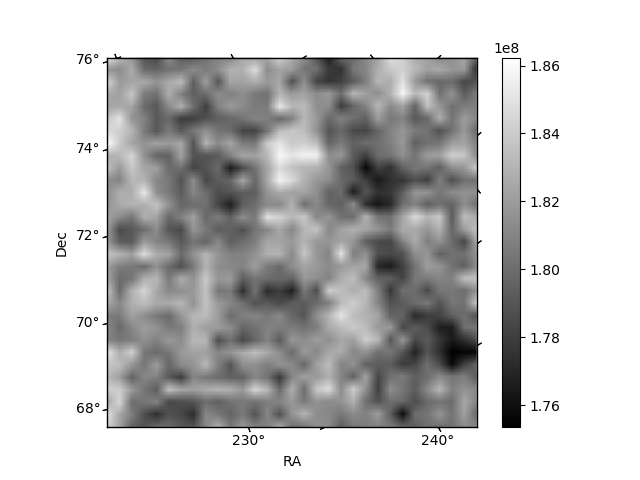
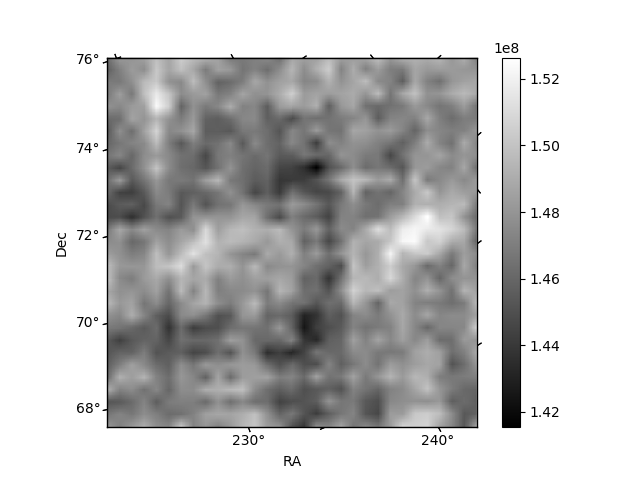
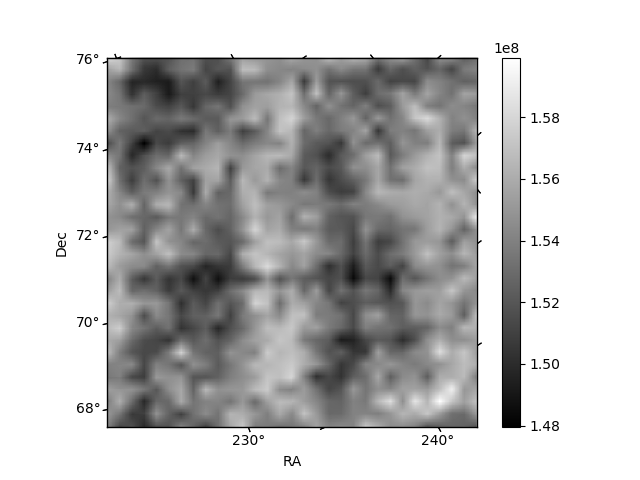
Histogram calculated using DETX and DETY for each event in the final _common_clean file
| Quadrant A | 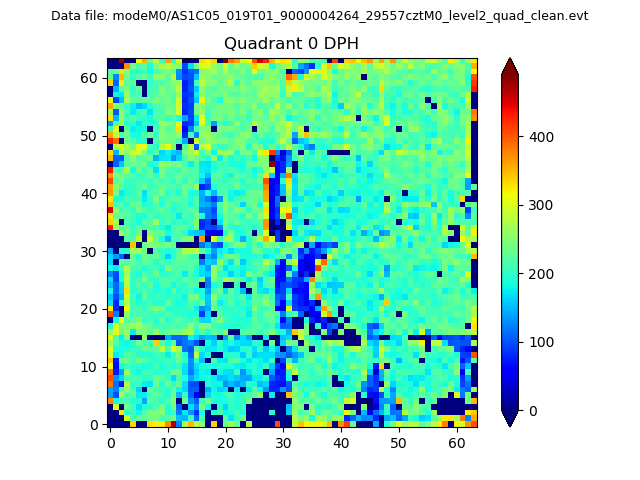 |
 |
Quadrant B |
|---|---|---|---|
| Quadrant D | 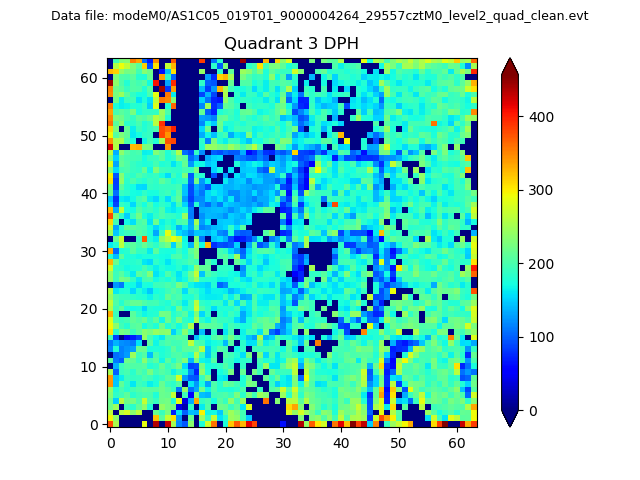 |
 |
Quadrant C |
| Plot type | Count rate plots | Images |
|---|---|---|
| Comparison with Poisson distribution Blue bars denote a histogram of data divided into 1 sec bins. Red curve is a Poisson curve with rate = median count rate of data. |
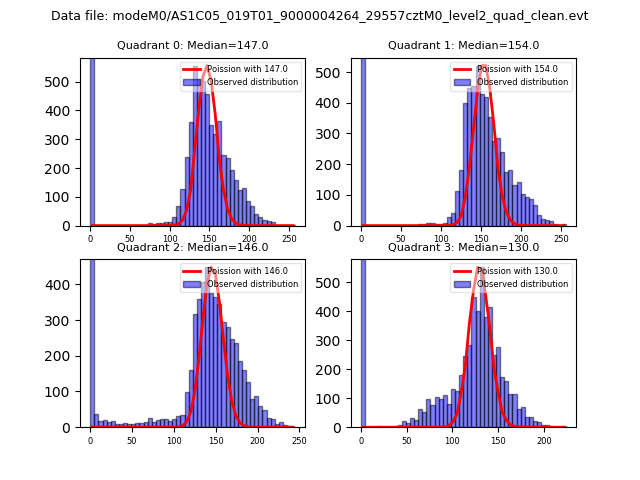 |
 |
| Quadrant-wise count rates Data is divided into 100 sec bins |
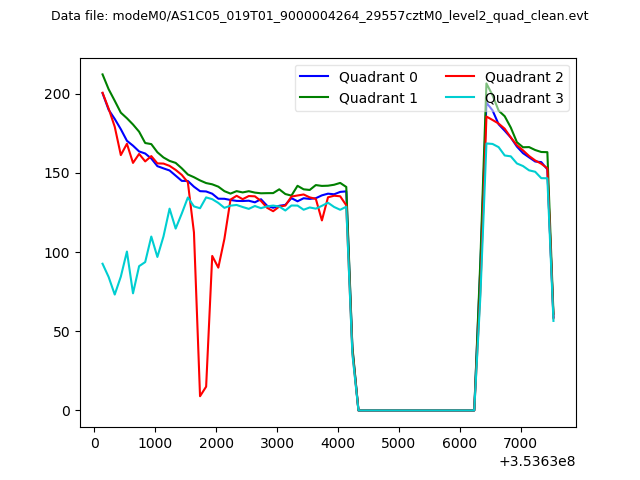 |
|
| Module-wise count rates for Quadrant A Data is divided into 100 sec bins |
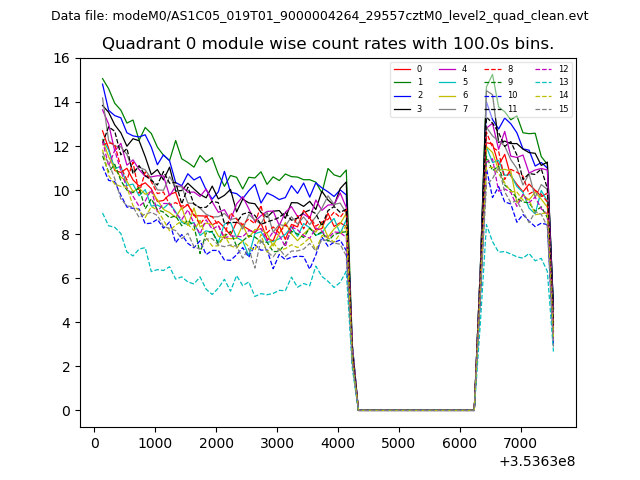 |
 |
| Module-wise count rates for Quadrant B Data is divided into 100 sec bins |
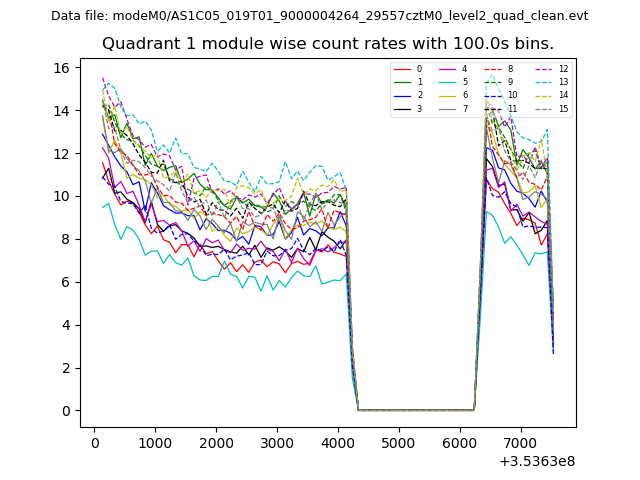 |
 |
| Module-wise count rates for Quadrant C Data is divided into 100 sec bins |
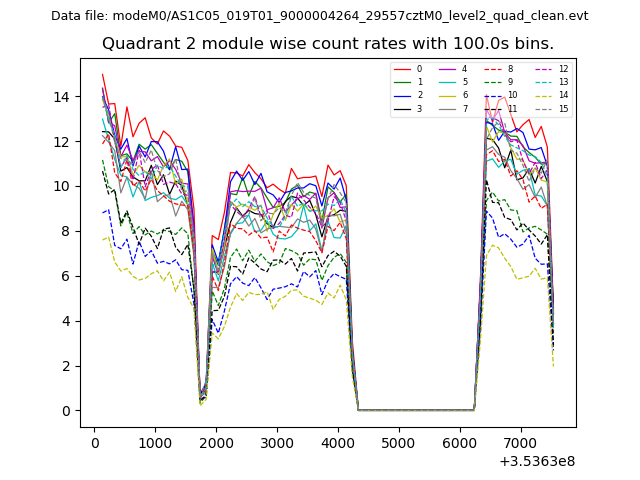 |
 |
| Module-wise count rates for Quadrant D Data is divided into 100 sec bins |
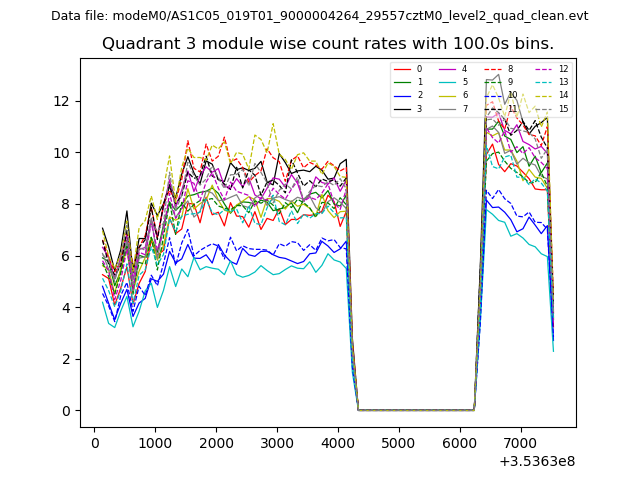 |
 |
| Parameter | Plot |
|---|---|
| CZT HV Monitor | 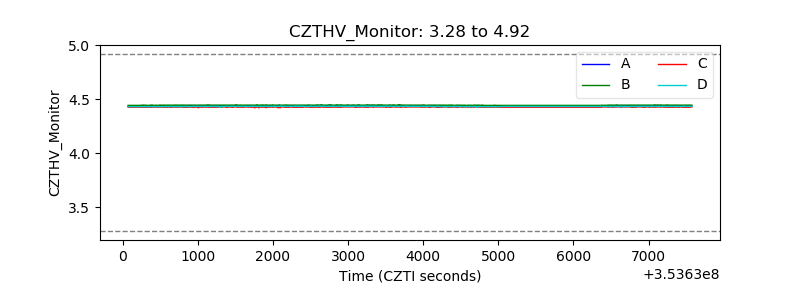 |
| D_VDD | 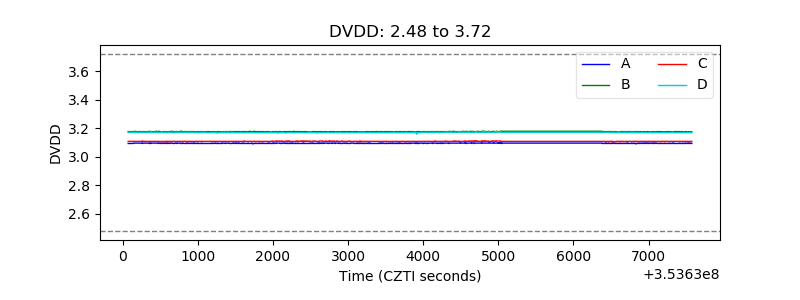 |
| Temperature 1 |  |
| Veto HV Monitor | 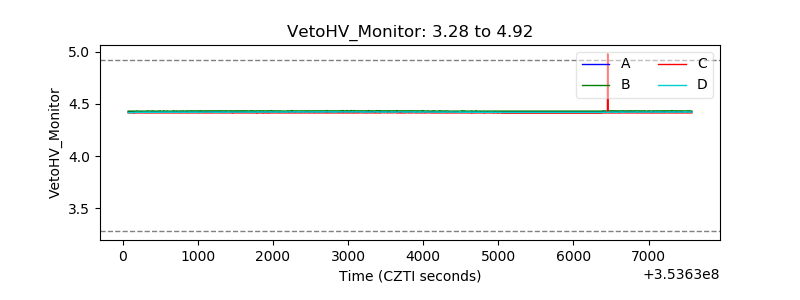 |
| Veto LLD |  |
| Alpha Counter | 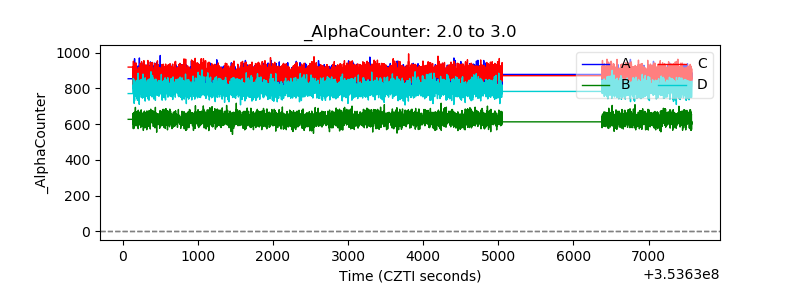 |
| _CPM_Rate | 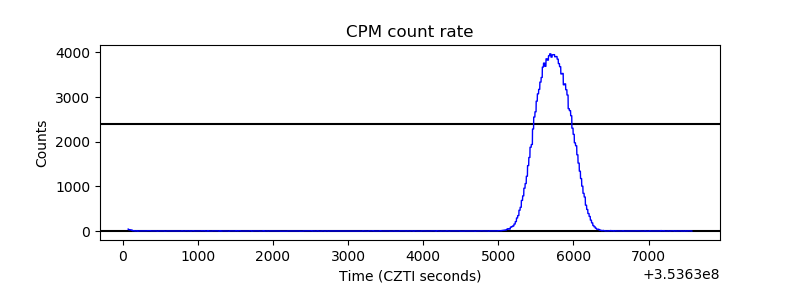 |
| CZT Counter | 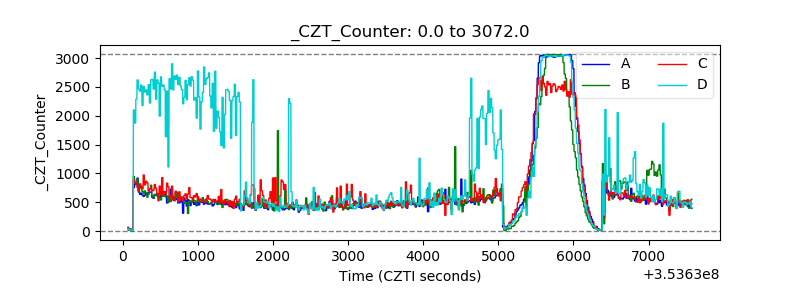 |
| +2.5 Volts monitor |  |
| +5 Volts monitor | 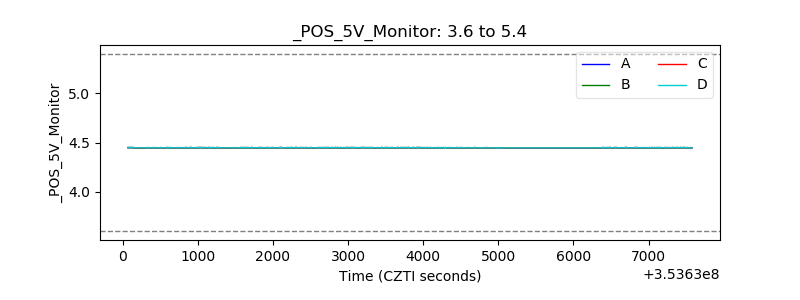 |
| _ROLL_ROT |  |
| _Roll_DEC | 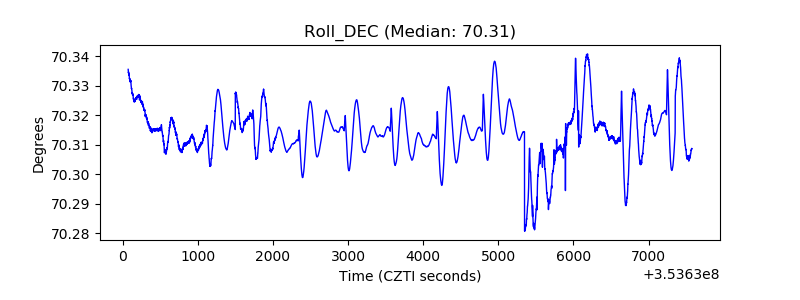 |
| _Roll_RA | 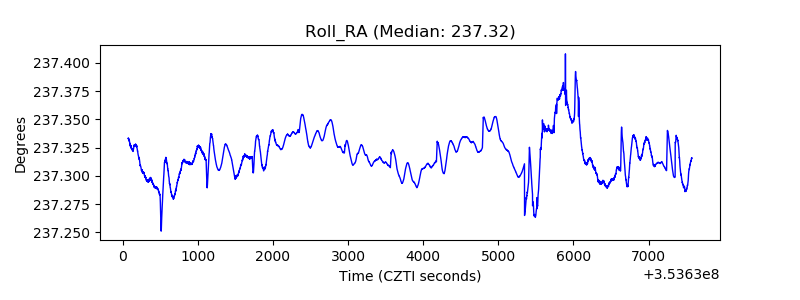 |
| Veto Counter | 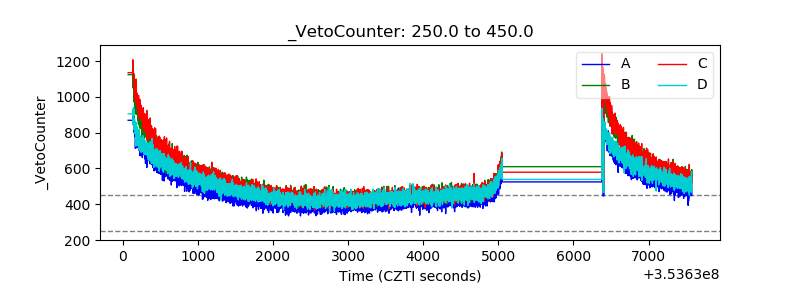 |