| Param | Original file | Final file |
|---|---|---|
| Filename | modeM0/AS1C05_019T01_9000004264_29558cztM0_level2.evt | modeM0/AS1C05_019T01_9000004264_29558cztM0_level2_quad_clean.evt |
| Size (bytes) | 522,472,320 | 119,897,280 |
| Size | 498.3 MB | 114.3 MB |
| Events in quadrant A | 3,182,737 | 803,178 |
| Events in quadrant B | 4,269,551 | 832,613 |
| Events in quadrant C | 3,258,660 | 798,967 |
| Events in quadrant D | 4,676,376 | 748,097 |
| Mode SS | |||
|---|---|---|---|
| Quadrant | BADHDUFLAG | Total packets | Discarded packets |
| A | 0 | 130 | 0 |
| B | 0 | 130 | 0 |
| C | 0 | 130 | 0 |
| D | 0 | 130 | 0 |
| Mode M0 | |||
|---|---|---|---|
| Quadrant | BADHDUFLAG | Total packets | Discarded packets |
| A | 0 | 13517 | 2 |
| B | 0 | 16792 | 2 |
| C | 0 | 13730 | 2 |
| D | 0 | 18251 | 2 |
| Mode M9 | |||
|---|---|---|---|
| Quadrant | BADHDUFLAG | Total packets | Discarded packets |
| A | 0 | 23 | 0 |
| B | 0 | 24 | 0 |
| C | 0 | 24 | 0 |
| D | 0 | 24 | 0 |
| Quadrant | Total seconds | Saturated seconds | Saturation percentage |
|---|---|---|---|
| A | 6432 | 12 | 0.186567% |
| B | 6432 | 49 | 0.761816% |
| C | 6432 | 86 | 1.337065% |
| D | 6432 | 370 | 5.752488% |
Noise dominated data is calculated using 1-second bins in cleaned event files. If a bin has >2000 counts, and if more than 50% of those come from <1% of pixels, then it is considered to be noise-dominated and hence unusable.
| Quadrant | # 1 sec bins | Bins with >0 counts | Bins with >2000 counts | High rate bins dominated by noise | Noise dominated (total time) | Noise dominated (detector-on time) | Marked lightcurve |
|---|---|---|---|---|---|---|---|
| A | 7832 | 6434 | 0 | 0 | 0.00% | 0.00% | 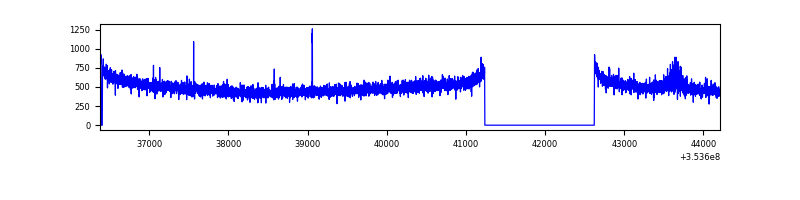 |
| B | 7832 | 6434 | 4 | 4 | 0.05% | 0.06% | 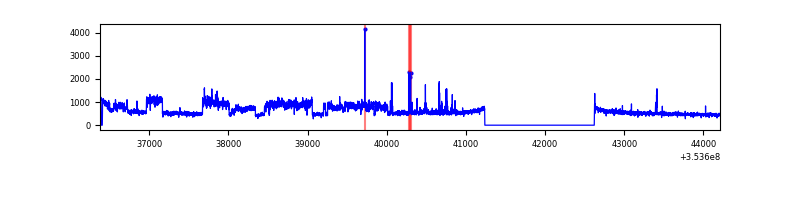 |
| C | 7832 | 6434 | 0 | 0 | 0.00% | 0.00% | 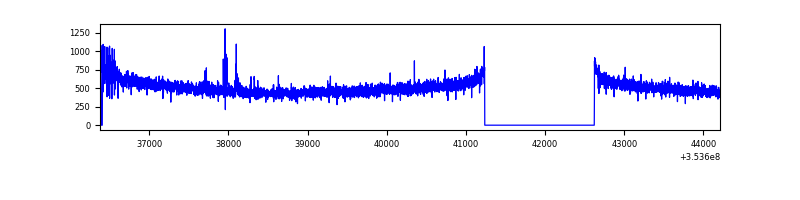 |
| D | 7832 | 6434 | 222 | 222 | 2.83% | 3.45% | 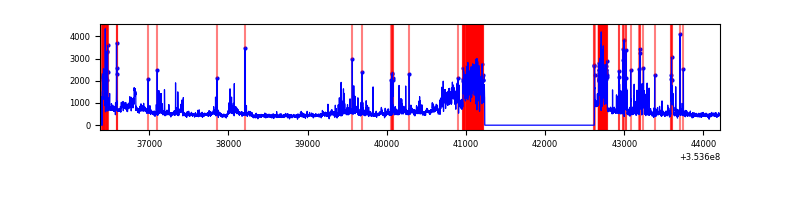 |
Top three noisy pixels from each quadrant. If the there are fewer than three noisy pixels in the level2.evt file, extra rows are filled as -1
| Pixel properties | Quadrant properties | ||||||
|---|---|---|---|---|---|---|---|
| Quadrant | DetID | PixID | Counts | Sigma | Mean | Median | Sigma |
| A | 0 | 13 | 30606 | 185.65 | 816 | 804 | 160.5 |
| A | 13 | 254 | 12098 | 70.35 | 816 | 804 | 160.5 |
| A | 3 | 137 | 7480 | 41.59 | 816 | 804 | 160.5 |
| B | 0 | 189 | 1020775 | 6799.84 | 824 | 804 | 150.0 |
| B | 12 | 111 | 17898 | 113.96 | 824 | 804 | 150.0 |
| B | 11 | 111 | 15834 | 100.2 | 824 | 804 | 150.0 |
| C | 14 | 238 | 143525 | 794.5 | 789 | 795 | 179.6 |
| C | 14 | 254 | 20509 | 109.73 | 789 | 795 | 179.6 |
| C | 2 | 114 | 14443 | 75.97 | 789 | 795 | 179.6 |
| D | 13 | 172 | 574140 | 3179.34 | 767 | 747 | 180.3 |
| D | 8 | 195 | 422706 | 2339.67 | 767 | 747 | 180.3 |
| D | 12 | 33 | 327709 | 1812.93 | 767 | 747 | 180.3 |
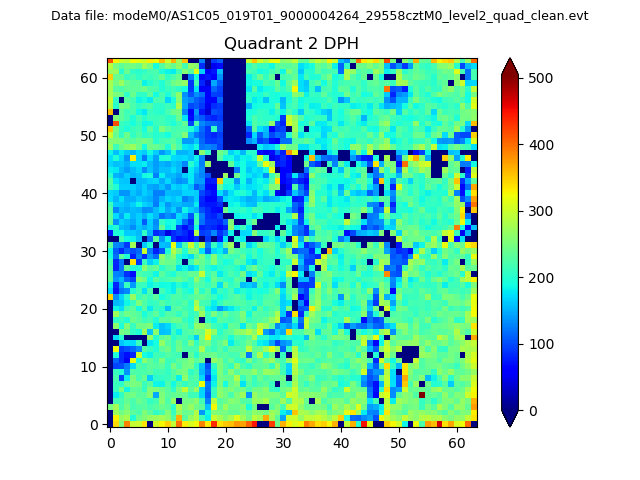
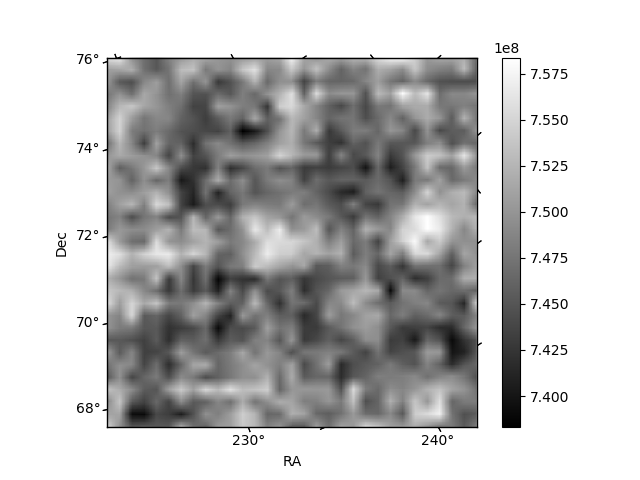
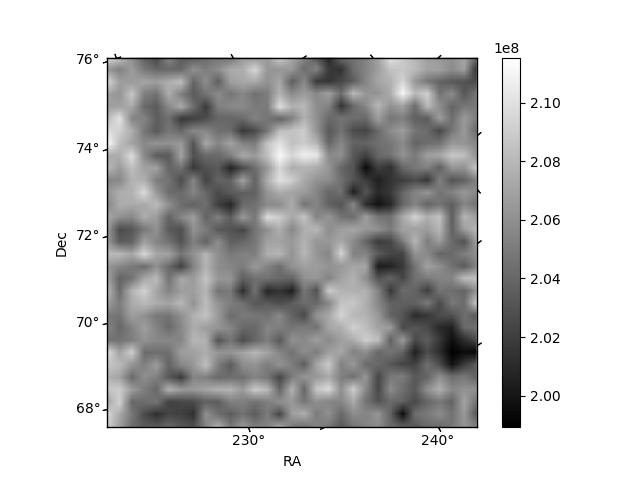
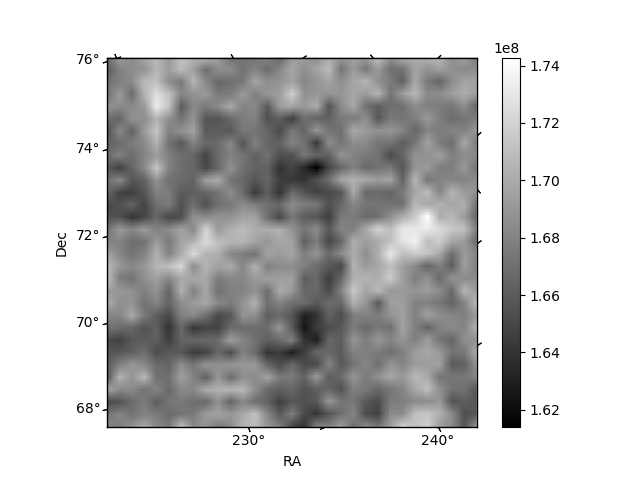
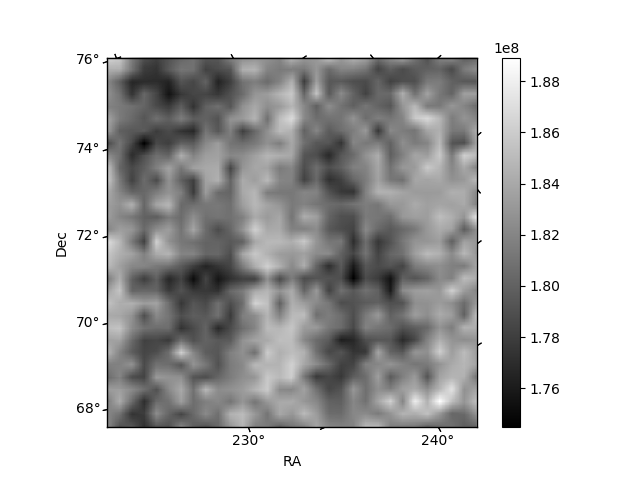
Histogram calculated using DETX and DETY for each event in the final _common_clean file
| Quadrant A | 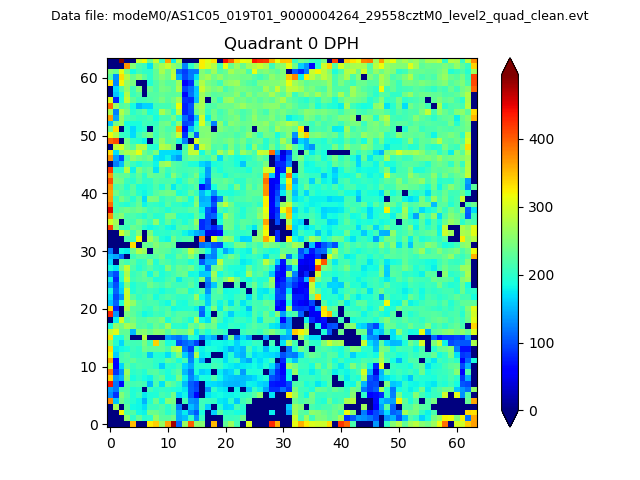 |
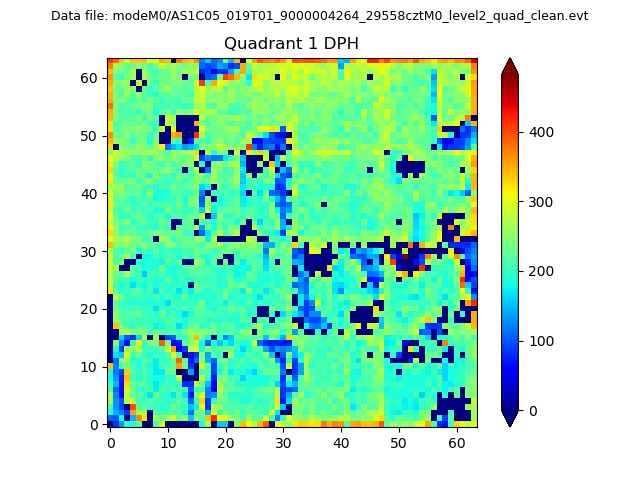 |
Quadrant B |
|---|---|---|---|
| Quadrant D | 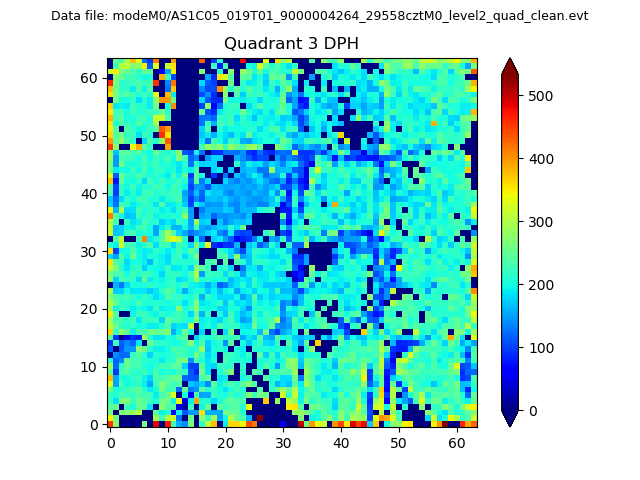 |
 |
Quadrant C |
| Plot type | Count rate plots | Images |
|---|---|---|
| Comparison with Poisson distribution Blue bars denote a histogram of data divided into 1 sec bins. Red curve is a Poisson curve with rate = median count rate of data. |
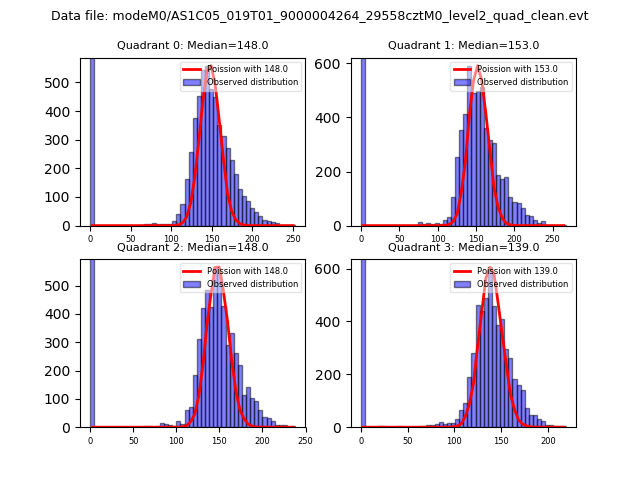 |
 |
| Quadrant-wise count rates Data is divided into 100 sec bins |
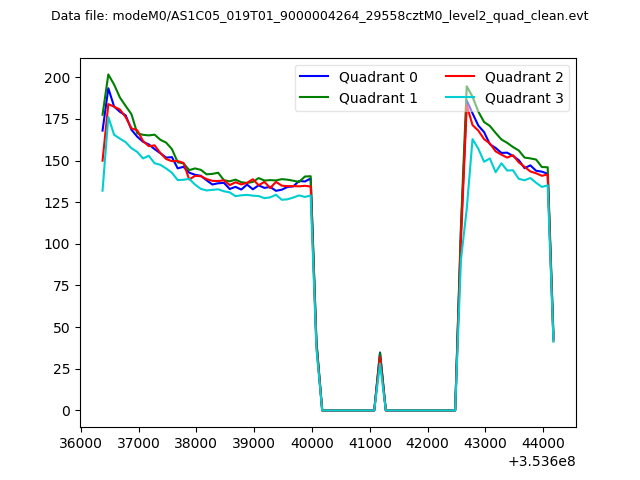 |
|
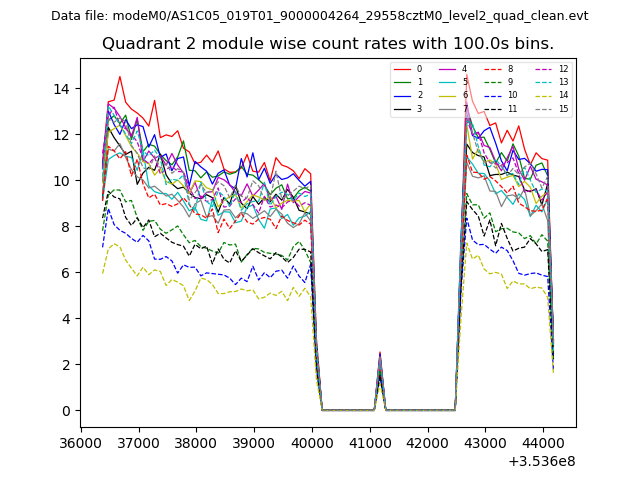
| Module-wise count rates for Quadrant A Data is divided into 100 sec bins |
 |
 |
| Module-wise count rates for Quadrant B Data is divided into 100 sec bins |
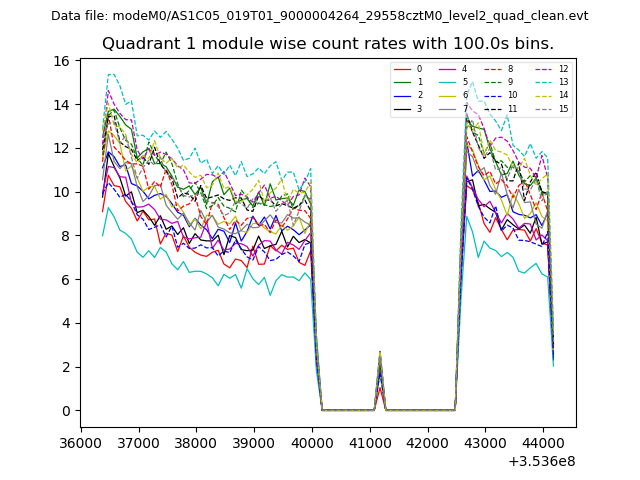 |
 |
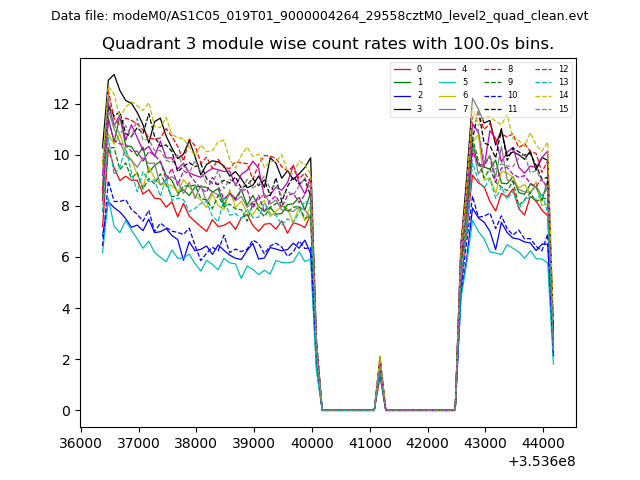
| Module-wise count rates for Quadrant C Data is divided into 100 sec bins |
 |
 |
| Module-wise count rates for Quadrant D Data is divided into 100 sec bins |
 |
 |
| Parameter | Plot |
|---|---|
| CZT HV Monitor |  |
| D_VDD | 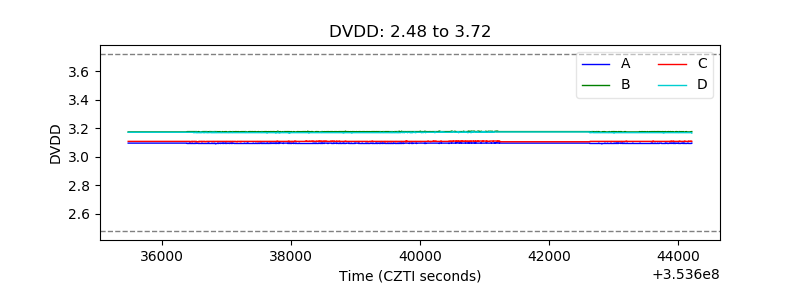 |
| Temperature 1 | 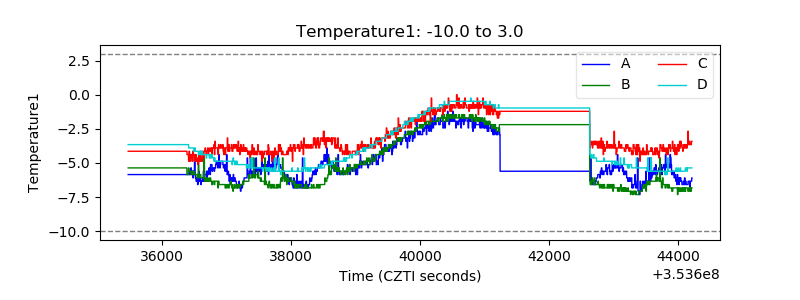 |
| Veto HV Monitor | 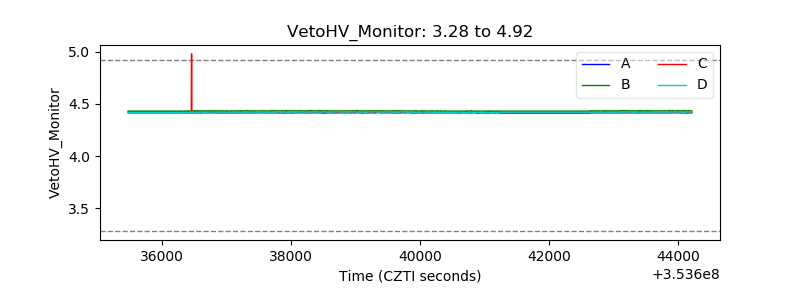 |
| Veto LLD |  |
| Alpha Counter | 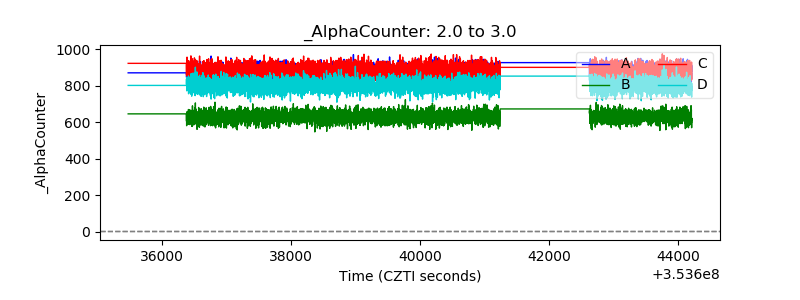 |
| _CPM_Rate | 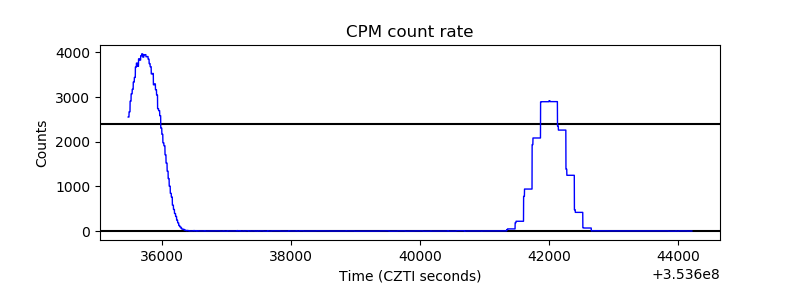 |
| CZT Counter | 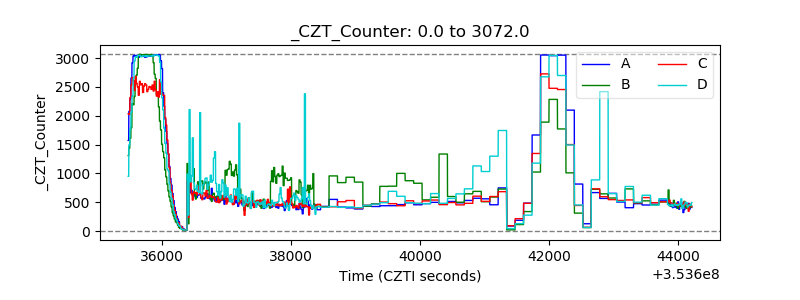 |
| +2.5 Volts monitor |  |
| +5 Volts monitor |  |
| _ROLL_ROT | 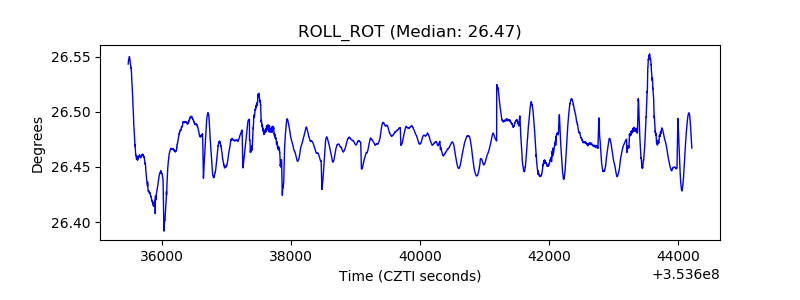 |
| _Roll_DEC | 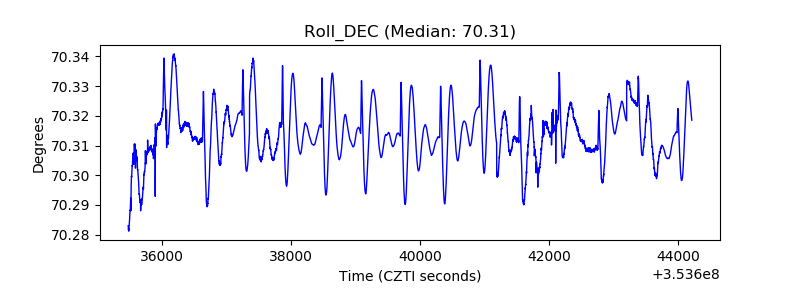 |
| _Roll_RA | 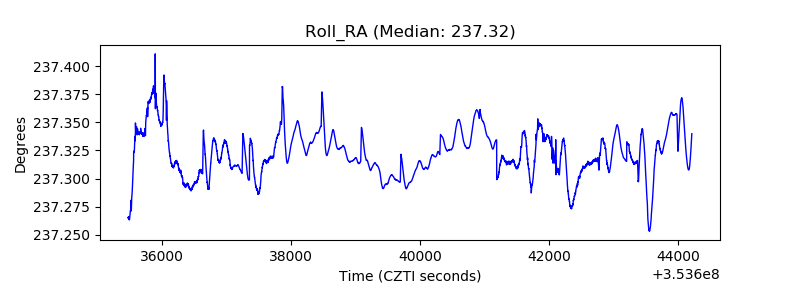 |
| Veto Counter | 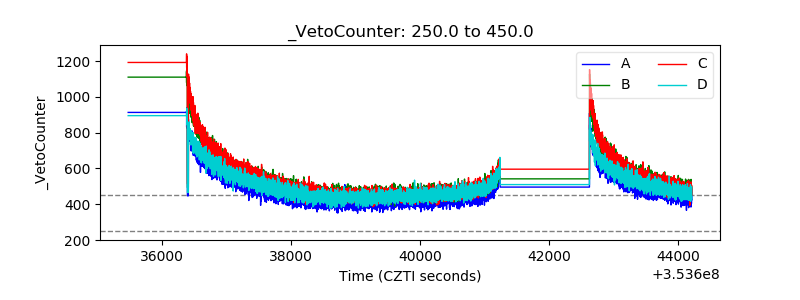 |