| Param | Original file | Final file |
|---|---|---|
| Filename | modeM0/AS1C05_019T01_9000004264_29561cztM0_level2.evt | modeM0/AS1C05_019T01_9000004264_29561cztM0_level2_quad_clean.evt |
| Size (bytes) | 477,786,240 | 108,123,840 |
| Size | 455.7 MB | 103.1 MB |
| Events in quadrant A | 3,037,475 | 719,861 |
| Events in quadrant B | 3,121,671 | 739,238 |
| Events in quadrant C | 3,352,330 | 665,828 |
| Events in quadrant D | 4,503,040 | 682,859 |
| Mode SS | |||
|---|---|---|---|
| Quadrant | BADHDUFLAG | Total packets | Discarded packets |
| A | 0 | 136 | 0 |
| B | 0 | 136 | 0 |
| C | 0 | 136 | 0 |
| D | 0 | 136 | 0 |
| Mode M0 | |||
|---|---|---|---|
| Quadrant | BADHDUFLAG | Total packets | Discarded packets |
| A | 0 | 13571 | 1 |
| B | 0 | 13707 | 1 |
| C | 0 | 14409 | 1 |
| D | 0 | 17988 | 1 |
| Mode M9 | |||
|---|---|---|---|
| Quadrant | BADHDUFLAG | Total packets | Discarded packets |
| A | 0 | 7 | 0 |
| B | 0 | 7 | 0 |
| C | 0 | 7 | 0 |
| D | 0 | 7 | 0 |
| Quadrant | Total seconds | Saturated seconds | Saturation percentage |
|---|---|---|---|
| A | 6692 | 51 | 0.762104% |
| B | 6692 | 66 | 0.986252% |
| C | 6692 | 693 | 10.355649% |
| D | 6692 | 285 | 4.258816% |
Noise dominated data is calculated using 1-second bins in cleaned event files. If a bin has >2000 counts, and if more than 50% of those come from <1% of pixels, then it is considered to be noise-dominated and hence unusable.
| Quadrant | # 1 sec bins | Bins with >0 counts | Bins with >2000 counts | High rate bins dominated by noise | Noise dominated (total time) | Noise dominated (detector-on time) | Marked lightcurve |
|---|---|---|---|---|---|---|---|
| A | 7347 | 6693 | 0 | 0 | 0.00% | 0.00% | 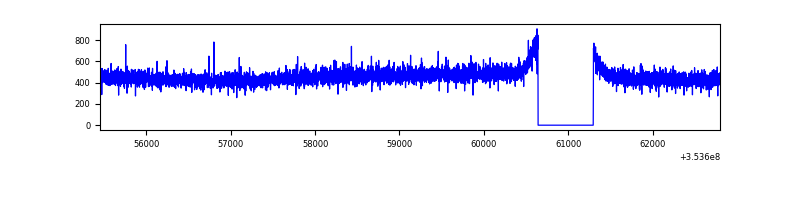 |
| B | 7347 | 6693 | 0 | 0 | 0.00% | 0.00% | 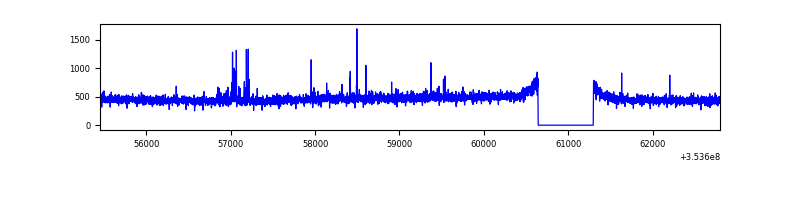 |
| C | 7347 | 6693 | 0 | 0 | 0.00% | 0.00% | 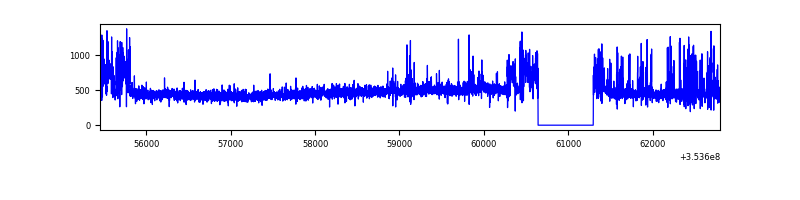 |
| D | 7347 | 6693 | 214 | 214 | 2.91% | 3.20% | 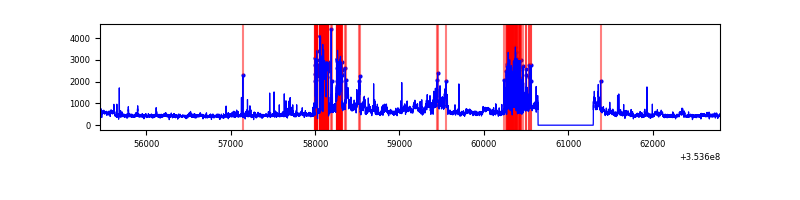 |
Top three noisy pixels from each quadrant. If the there are fewer than three noisy pixels in the level2.evt file, extra rows are filled as -1
| Pixel properties | Quadrant properties | ||||||
|---|---|---|---|---|---|---|---|
| Quadrant | DetID | PixID | Counts | Sigma | Mean | Median | Sigma |
| A | 13 | 254 | 12722 | 75.5 | 787 | 771 | 158.3 |
| A | 3 | 137 | 7762 | 44.17 | 787 | 771 | 158.3 |
| A | 0 | 226 | 6739 | 37.7 | 787 | 771 | 158.3 |
| B | 0 | 190 | 31450 | 206.75 | 784 | 765 | 148.4 |
| B | 12 | 111 | 18420 | 118.95 | 784 | 765 | 148.4 |
| B | 11 | 111 | 16592 | 106.64 | 784 | 765 | 148.4 |
| C | 14 | 238 | 299966 | 1824.67 | 712 | 715 | 164.0 |
| C | 14 | 254 | 253619 | 1542.07 | 712 | 715 | 164.0 |
| C | 2 | 114 | 14502 | 84.07 | 712 | 715 | 164.0 |
| D | 7 | 238 | 492705 | 2779.65 | 743 | 721 | 177.0 |
| D | 8 | 195 | 423616 | 2389.3 | 743 | 721 | 177.0 |
| D | 12 | 227 | 310365 | 1749.45 | 743 | 721 | 177.0 |
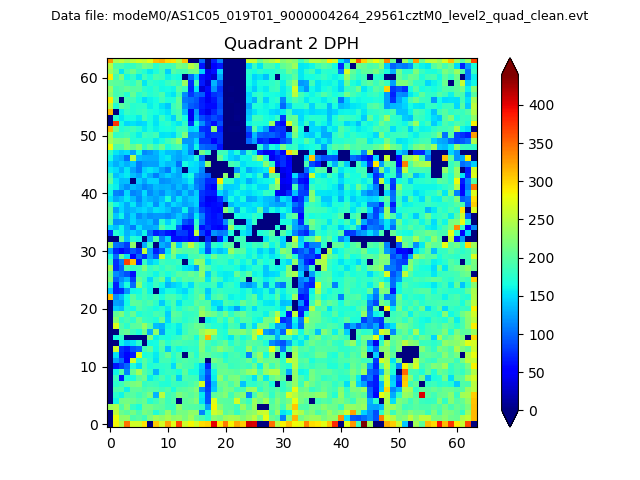
Histogram calculated using DETX and DETY for each event in the final _common_clean file
| Quadrant A |  |
 |
Quadrant B |
|---|---|---|---|
| Quadrant D | 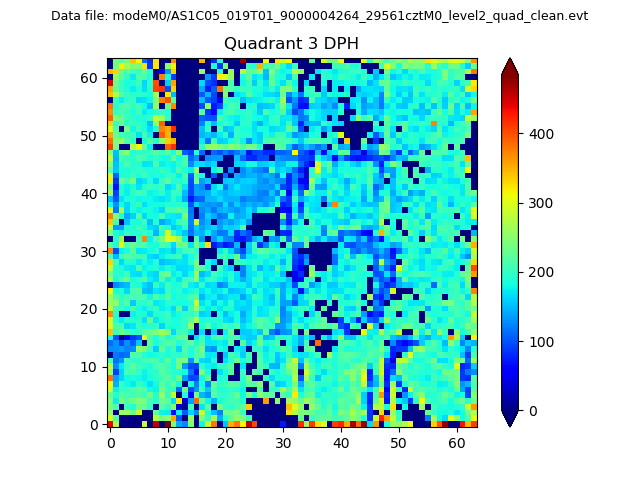 |
 |
Quadrant C |
| Plot type | Count rate plots | Images |
|---|---|---|
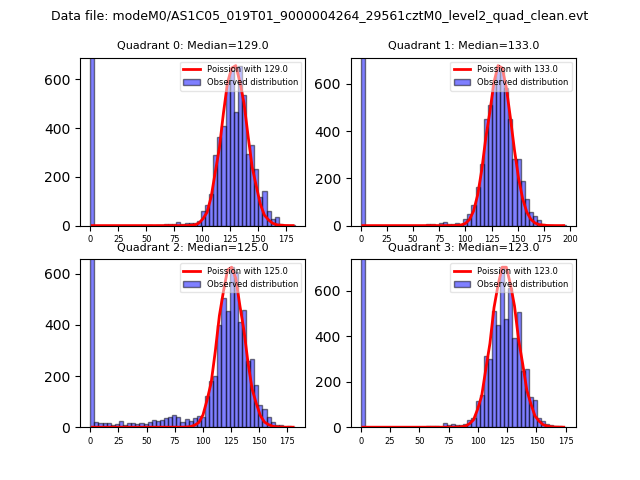
| Comparison with Poisson distribution Blue bars denote a histogram of data divided into 1 sec bins. Red curve is a Poisson curve with rate = median count rate of data. |
 |
 |
| Quadrant-wise count rates Data is divided into 100 sec bins |
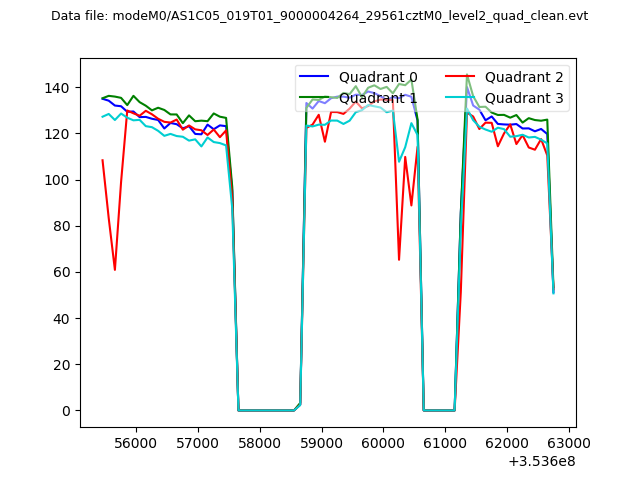 |
|
| Module-wise count rates for Quadrant A Data is divided into 100 sec bins |
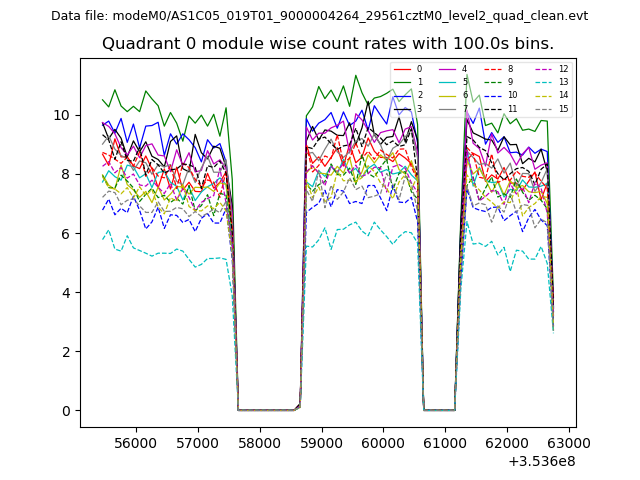 |
 |
| Module-wise count rates for Quadrant B Data is divided into 100 sec bins |
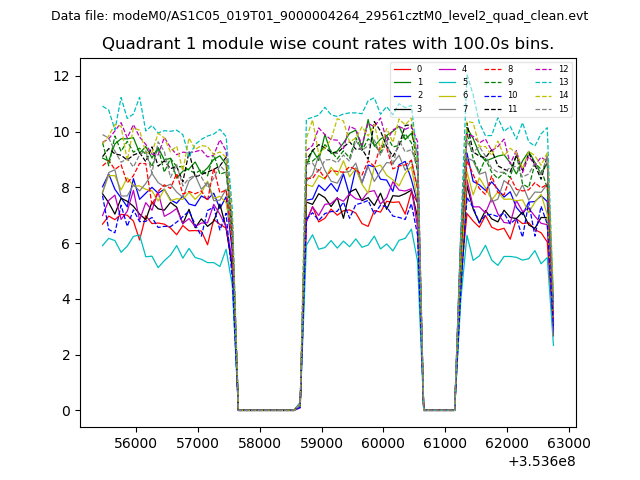 |
 |
| Module-wise count rates for Quadrant C Data is divided into 100 sec bins |
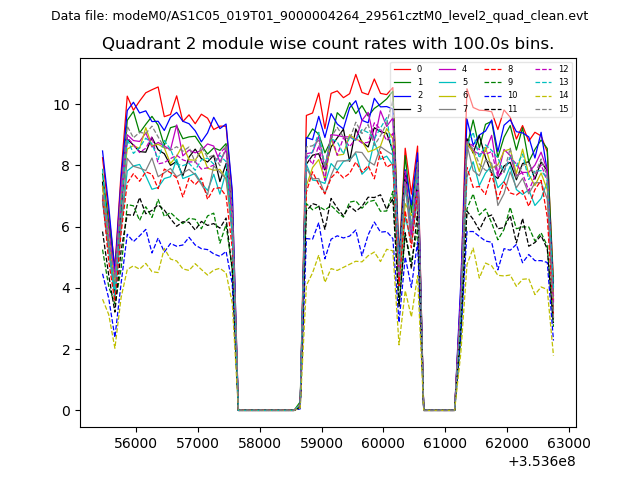 |
 |
| Module-wise count rates for Quadrant D Data is divided into 100 sec bins |
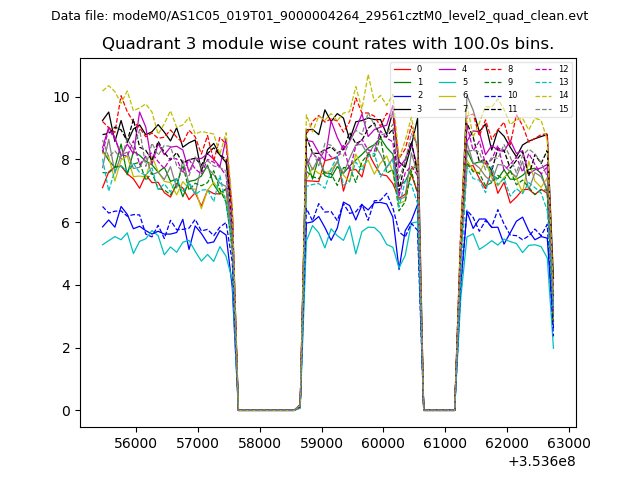 |
 |
| Parameter | Plot |
|---|---|
| CZT HV Monitor | 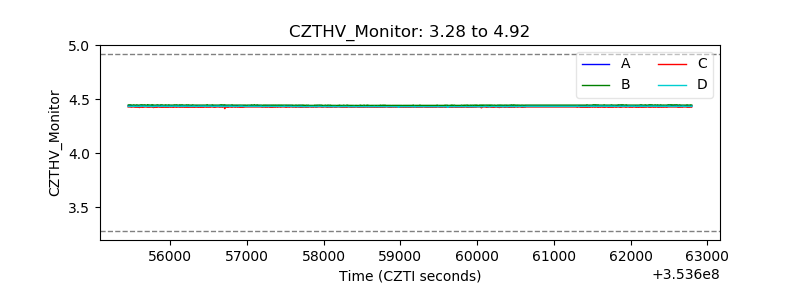 |
| D_VDD | 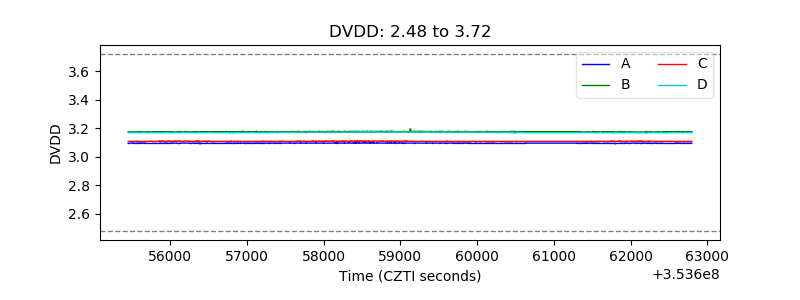 |
| Temperature 1 | 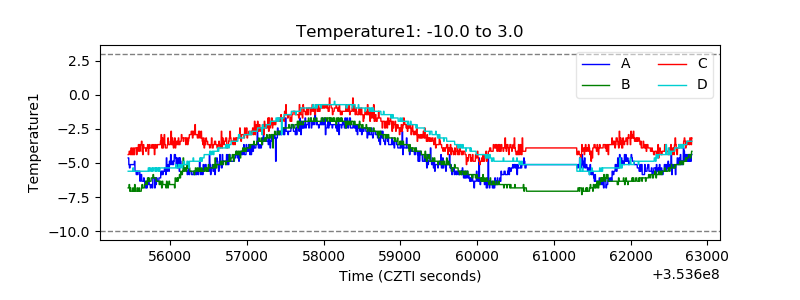 |
| Veto HV Monitor | 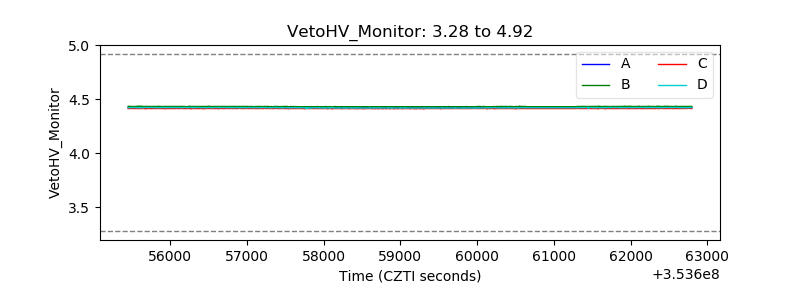 |
| Veto LLD | 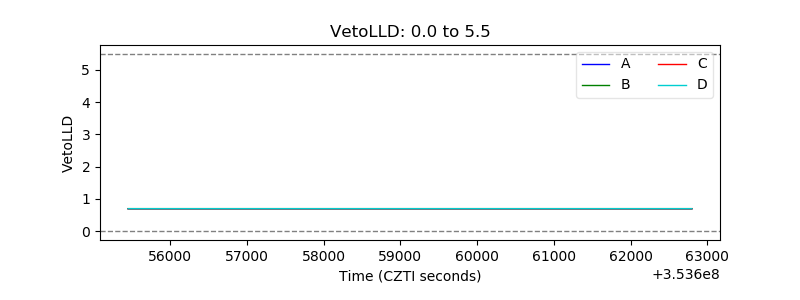 |
| Alpha Counter | 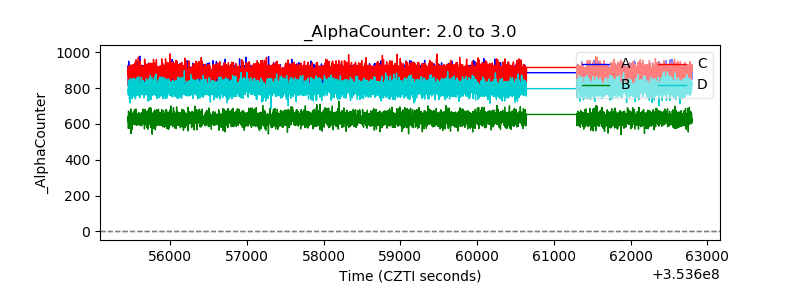 |
| _CPM_Rate | 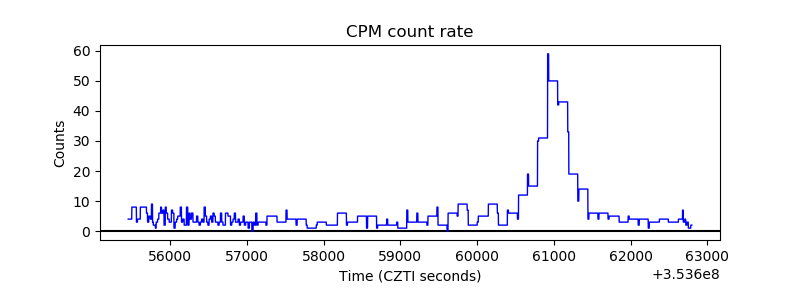 |
| CZT Counter | 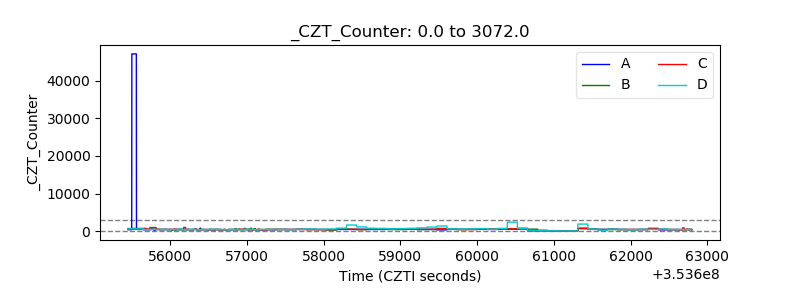 |
| +2.5 Volts monitor |  |
| +5 Volts monitor | 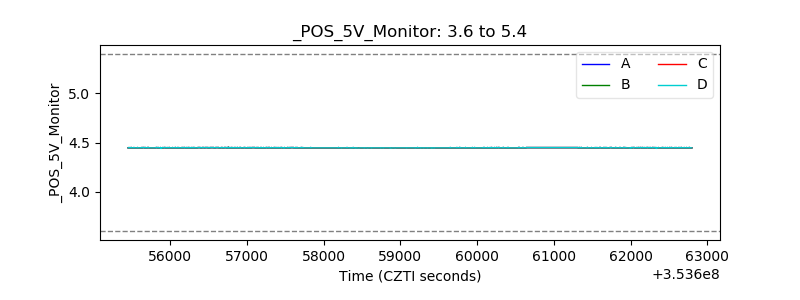 |
| _ROLL_ROT | 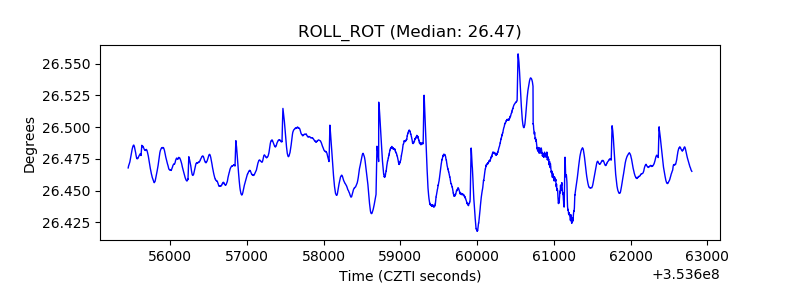 |
| _Roll_DEC | 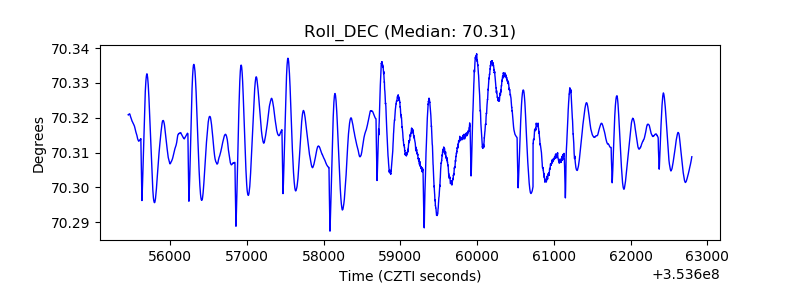 |
| _Roll_RA | 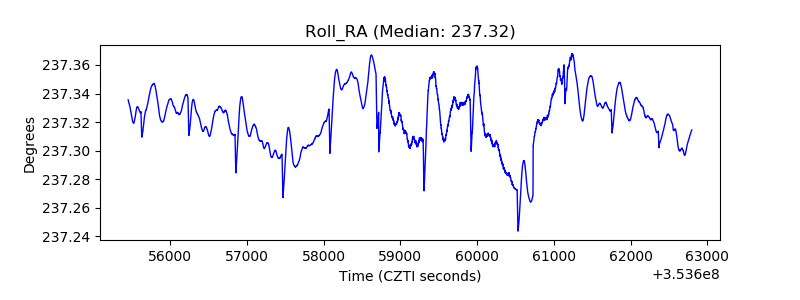 |
| Veto Counter | 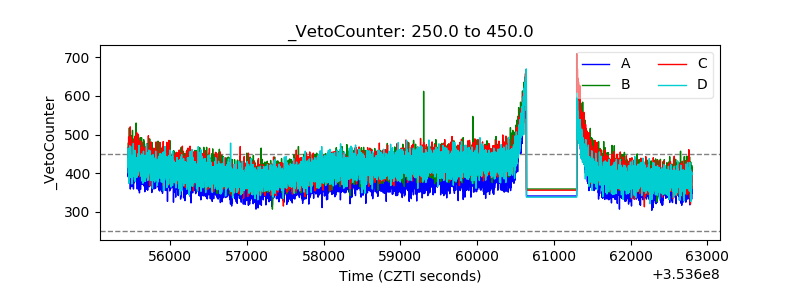 |