| Param | Original file | Final file |
|---|---|---|
| Filename | modeM0/AS1C05_019T01_9000004264_29562cztM0_level2.evt | modeM0/AS1C05_019T01_9000004264_29562cztM0_level2_quad_clean.evt |
| Size (bytes) | 1,289,001,600 | 270,619,200 |
| Size | 1.2 GB | 258.1 MB |
| Events in quadrant A | 7,967,396 | 1,797,912 |
| Events in quadrant B | 8,207,863 | 1,846,266 |
| Events in quadrant C | 8,735,252 | 1,688,468 |
| Events in quadrant D | 12,962,150 | 1,675,933 |
| Mode SS | |||
|---|---|---|---|
| Quadrant | BADHDUFLAG | Total packets | Discarded packets |
| A | 0 | 348 | 0 |
| B | 0 | 348 | 0 |
| C | 0 | 348 | 0 |
| D | 0 | 348 | 0 |
| Mode M0 | |||
|---|---|---|---|
| Quadrant | BADHDUFLAG | Total packets | Discarded packets |
| A | 0 | 35277 | 3 |
| B | 0 | 35729 | 3 |
| C | 0 | 37293 | 3 |
| D | 0 | 50273 | 3 |
| Mode M9 | |||
|---|---|---|---|
| Quadrant | BADHDUFLAG | Total packets | Discarded packets |
| A | 0 | 18 | 0 |
| B | 0 | 18 | 0 |
| C | 0 | 18 | 0 |
| D | 0 | 18 | 0 |
| Quadrant | Total seconds | Saturated seconds | Saturation percentage |
|---|---|---|---|
| A | 17228 | 305 | 1.770374% |
| B | 17228 | 357 | 2.072208% |
| C | 17228 | 1632 | 9.472951% |
| D | 17228 | 1192 | 6.918969% |
Noise dominated data is calculated using 1-second bins in cleaned event files. If a bin has >2000 counts, and if more than 50% of those come from <1% of pixels, then it is considered to be noise-dominated and hence unusable.
| Quadrant | # 1 sec bins | Bins with >0 counts | Bins with >2000 counts | High rate bins dominated by noise | Noise dominated (total time) | Noise dominated (detector-on time) | Marked lightcurve |
|---|---|---|---|---|---|---|---|
| A | 18978 | 17232 | 1 | 1 | 0.01% | 0.01% | 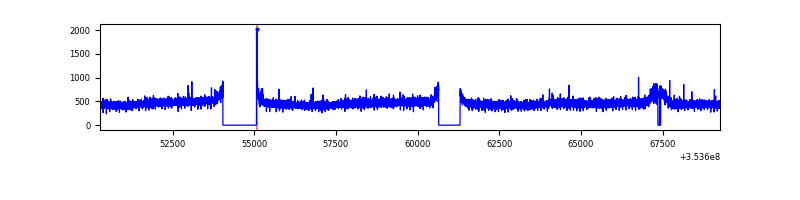 |
| B | 18978 | 17232 | 15 | 15 | 0.08% | 0.09% | 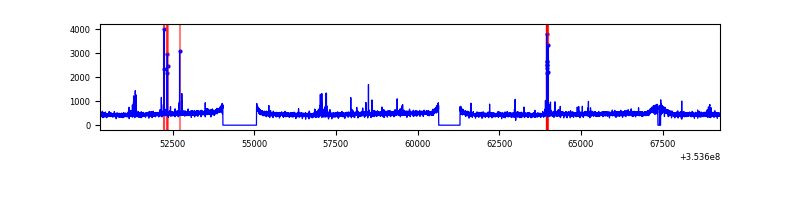 |
| C | 18978 | 17232 | 0 | 0 | 0.00% | 0.00% | 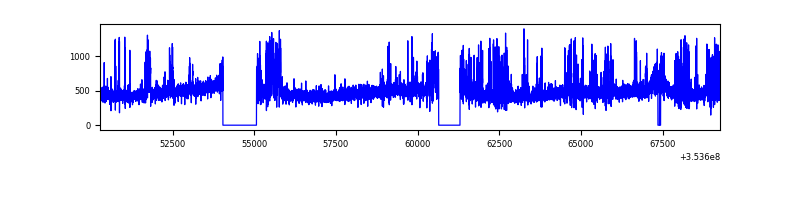 |
| D | 18978 | 17232 | 781 | 781 | 4.12% | 4.53% | 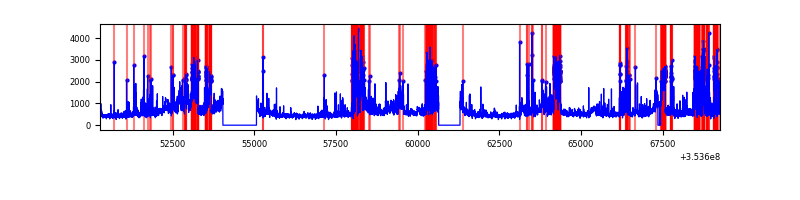 |
Top three noisy pixels from each quadrant. If the there are fewer than three noisy pixels in the level2.evt file, extra rows are filled as -1
| Pixel properties | Quadrant properties | ||||||
|---|---|---|---|---|---|---|---|
| Quadrant | DetID | PixID | Counts | Sigma | Mean | Median | Sigma |
| A | 13 | 254 | 32929 | 75.04 | 2062 | 2018 | 411.9 |
| A | 3 | 137 | 20317 | 44.42 | 2062 | 2018 | 411.9 |
| A | 0 | 226 | 17519 | 37.63 | 2062 | 2018 | 411.9 |
| B | 0 | 190 | 67671 | 171.32 | 2051 | 2004 | 383.3 |
| B | 0 | 156 | 53655 | 134.75 | 2051 | 2004 | 383.3 |
| B | 12 | 111 | 48206 | 120.54 | 2051 | 2004 | 383.3 |
| C | 14 | 238 | 715088 | 1635.62 | 1896 | 1904 | 436.0 |
| C | 14 | 254 | 559028 | 1277.71 | 1896 | 1904 | 436.0 |
| C | 2 | 114 | 38515 | 83.96 | 1896 | 1904 | 436.0 |
| D | 7 | 238 | 1941466 | 4256.34 | 1932 | 1878 | 455.7 |
| D | 8 | 195 | 1202963 | 2635.73 | 1932 | 1878 | 455.7 |
| D | 13 | 172 | 937685 | 2053.59 | 1932 | 1878 | 455.7 |
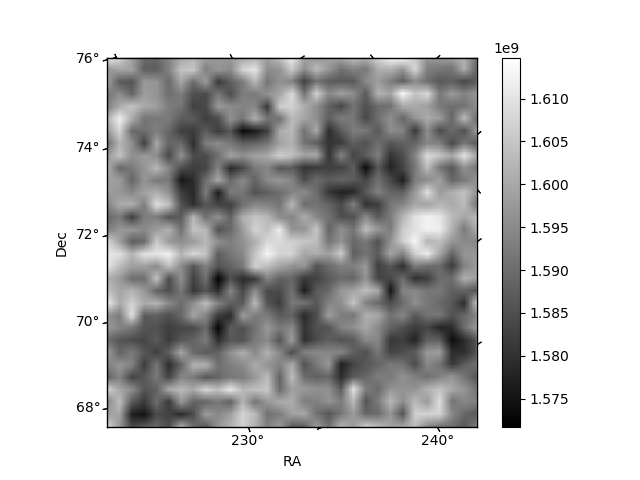
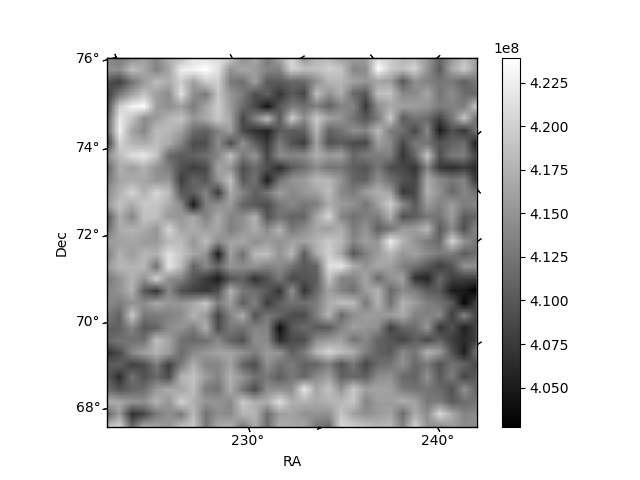
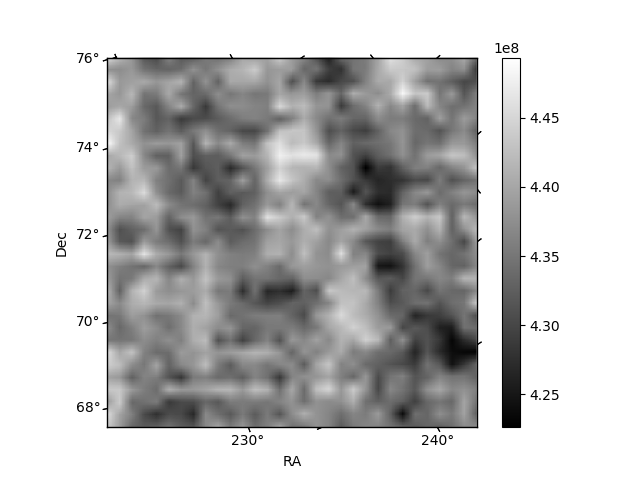
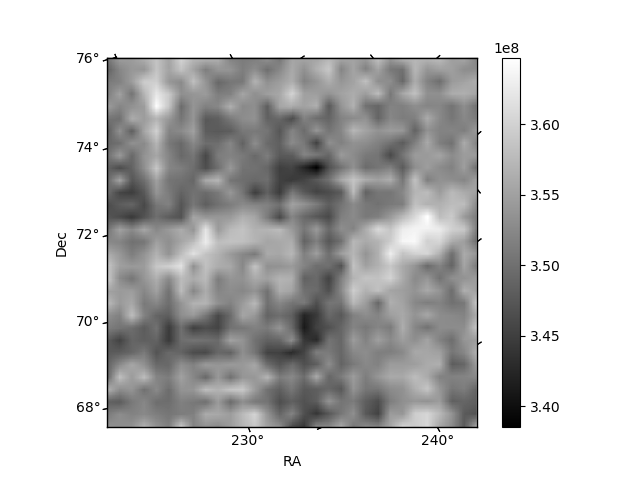
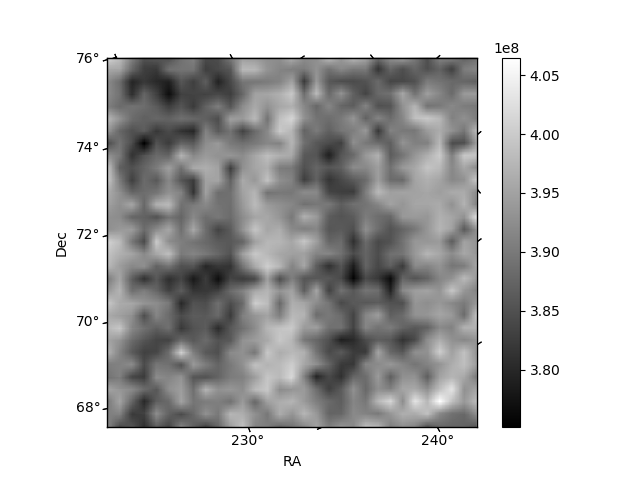
Histogram calculated using DETX and DETY for each event in the final _common_clean file
| Quadrant A | 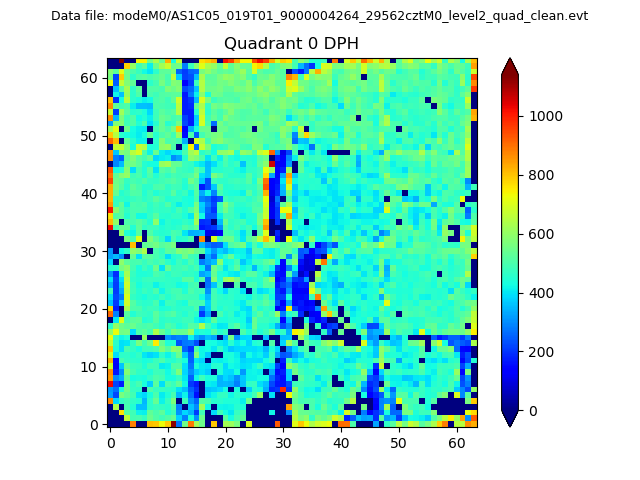 |
 |
Quadrant B |
|---|---|---|---|
| Quadrant D | 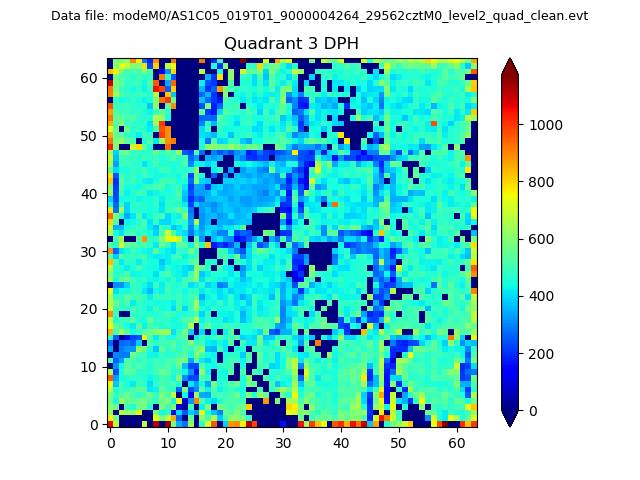 |
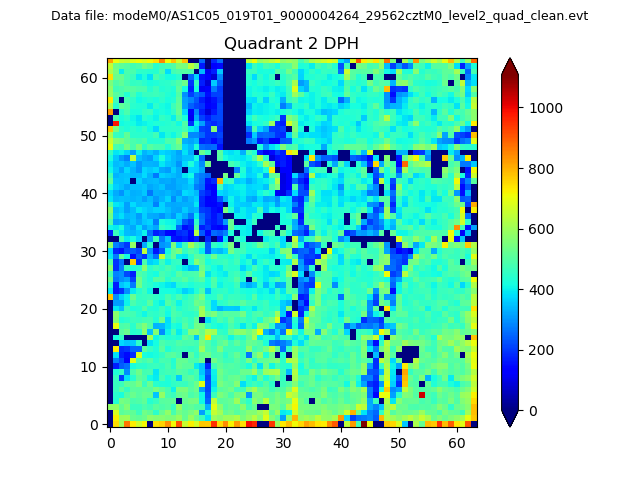 |
Quadrant C |
| Plot type | Count rate plots | Images |
|---|---|---|
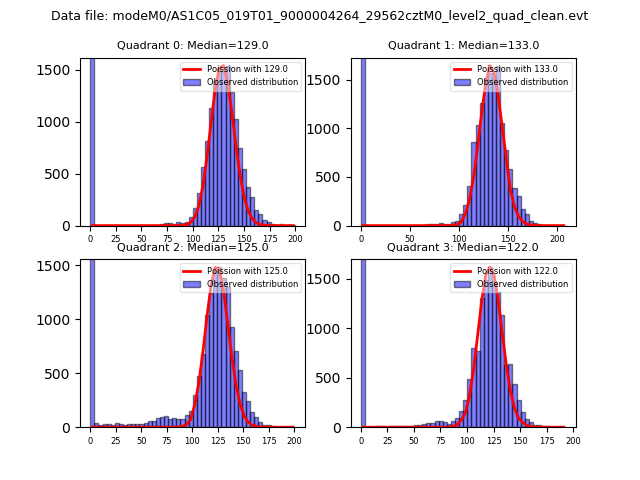
| Comparison with Poisson distribution Blue bars denote a histogram of data divided into 1 sec bins. Red curve is a Poisson curve with rate = median count rate of data. |
 |
 |
| Quadrant-wise count rates Data is divided into 100 sec bins |
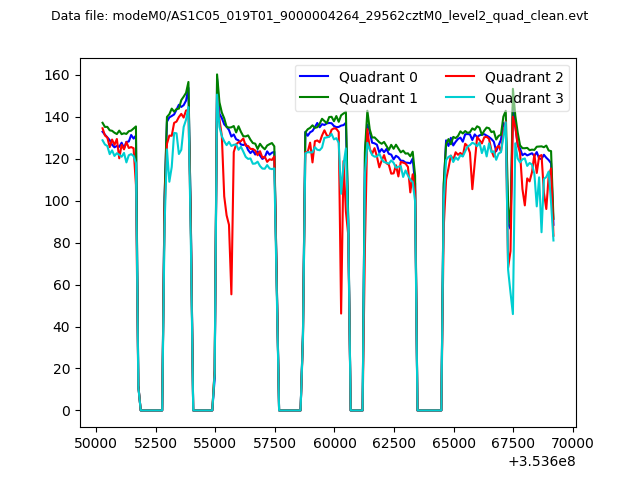 |
|
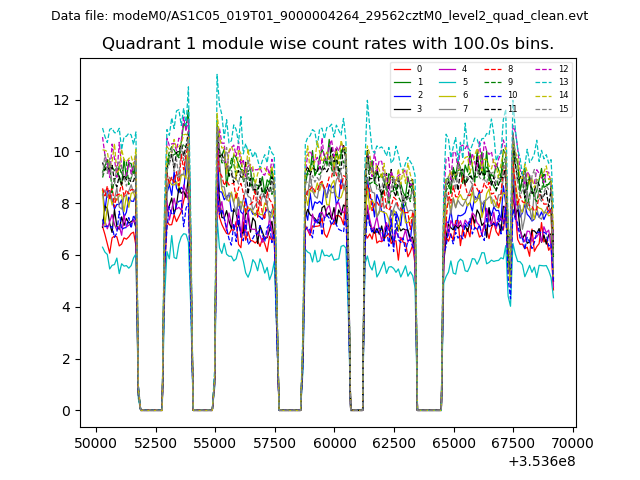
| Module-wise count rates for Quadrant A Data is divided into 100 sec bins |
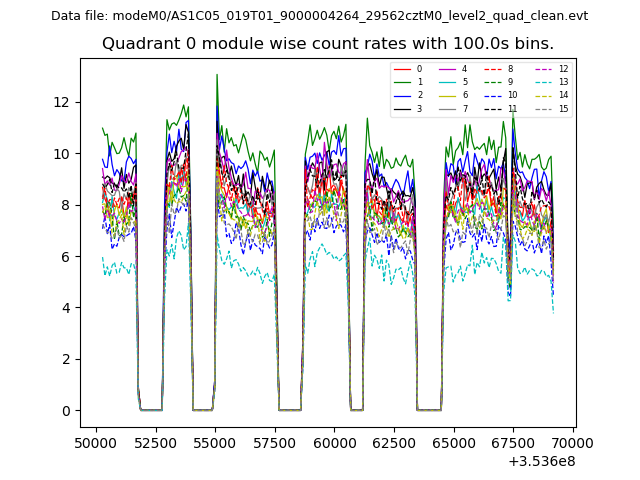 |
 |
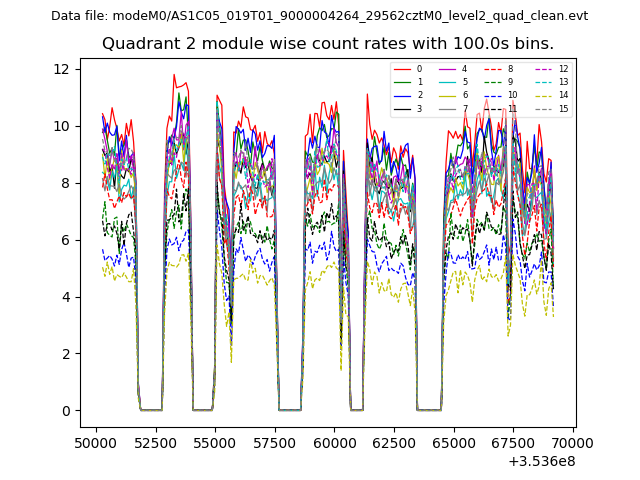
| Module-wise count rates for Quadrant B Data is divided into 100 sec bins |
 |
 |
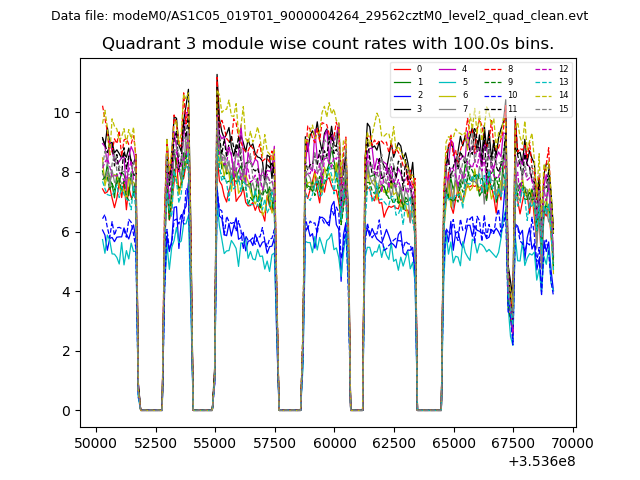
| Module-wise count rates for Quadrant C Data is divided into 100 sec bins |
 |
 |
| Module-wise count rates for Quadrant D Data is divided into 100 sec bins |
 |
 |
| Parameter | Plot |
|---|---|
| CZT HV Monitor | 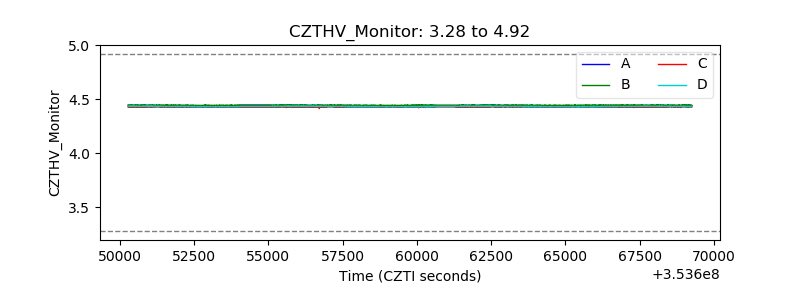 |
| D_VDD | 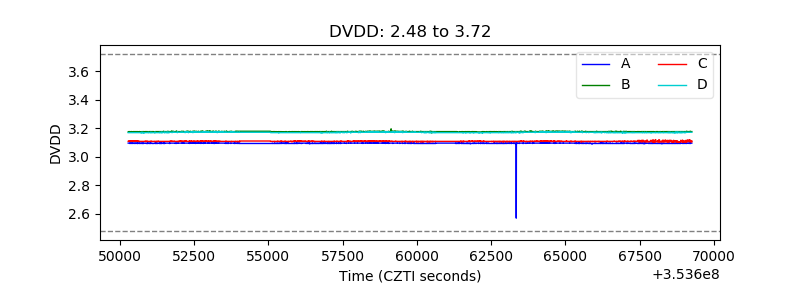 |
| Temperature 1 | 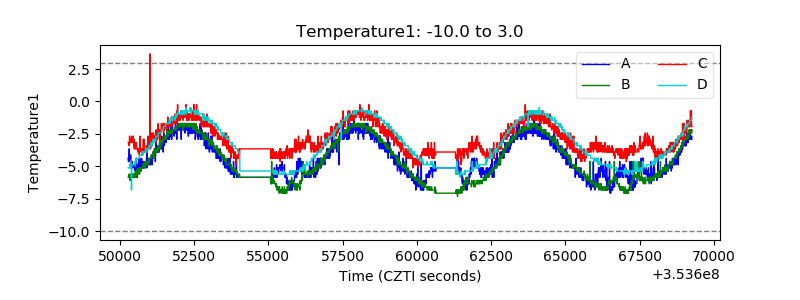 |
| Veto HV Monitor | 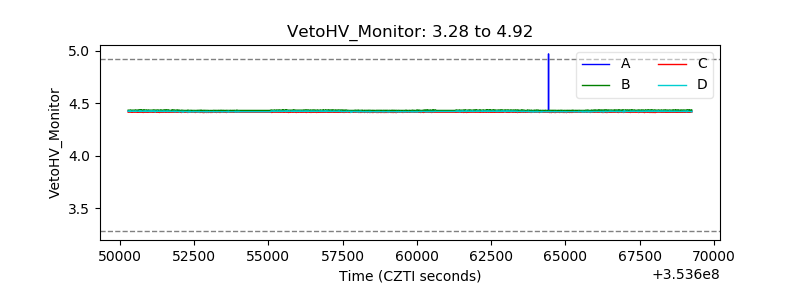 |
| Veto LLD | 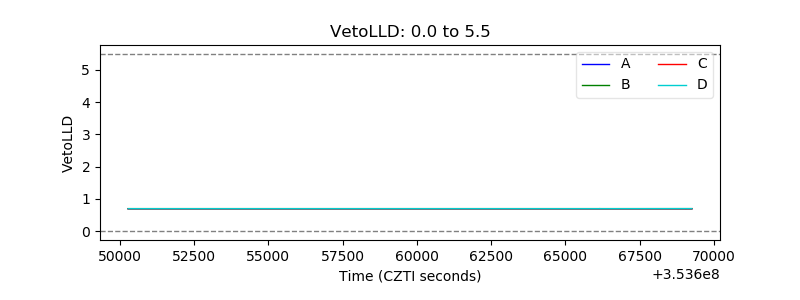 |
| Alpha Counter | 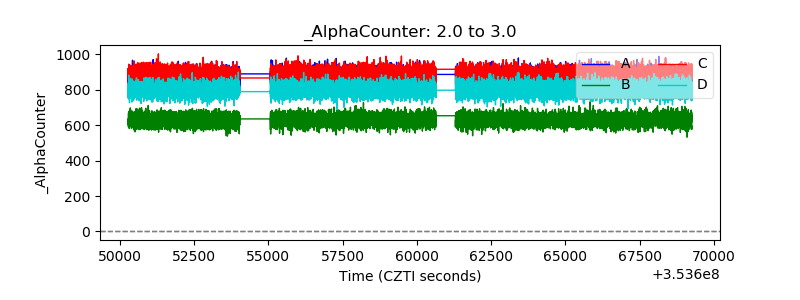 |
| _CPM_Rate | 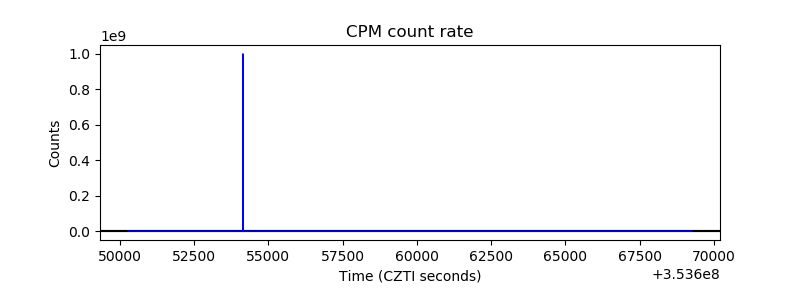 |
| CZT Counter | 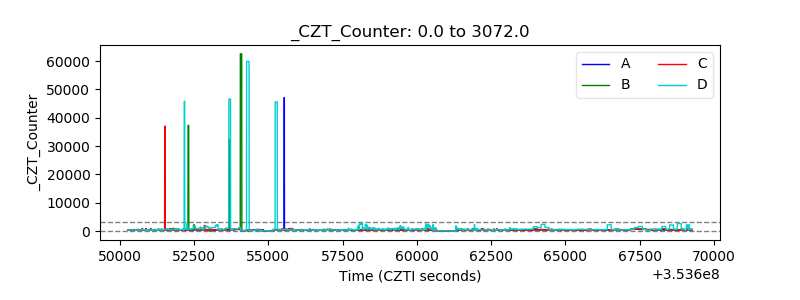 |
| +2.5 Volts monitor |  |
| +5 Volts monitor |  |
| _ROLL_ROT | 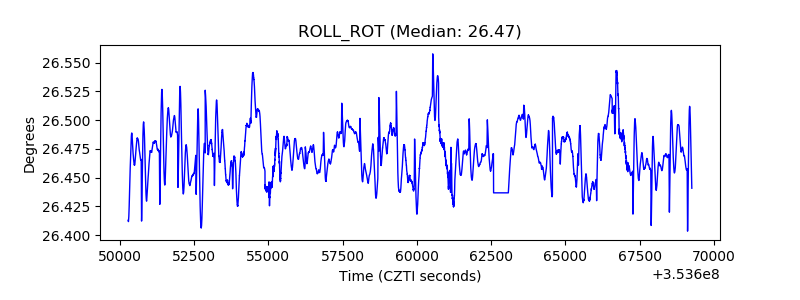 |
| _Roll_DEC | 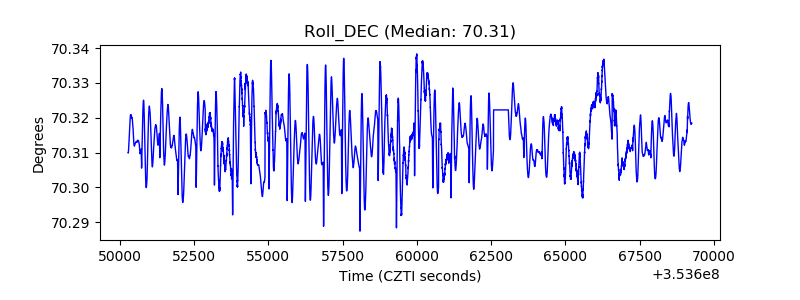 |
| _Roll_RA | 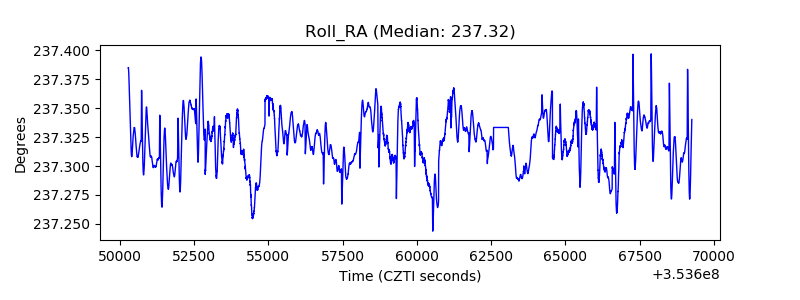 |
| Veto Counter | 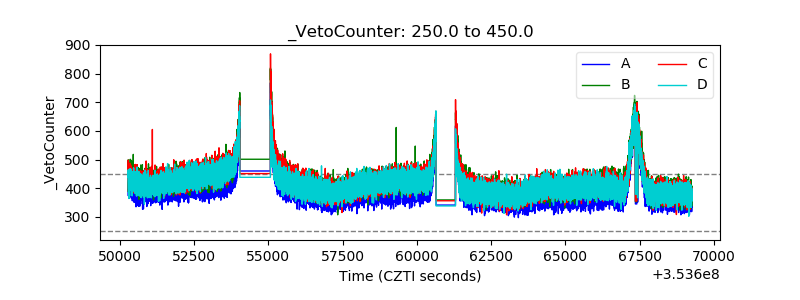 |