| Param | Original file | Final file |
|---|---|---|
| Filename | modeM0/AS1C05_019T01_9000004264_29563cztM0_level2.evt | modeM0/AS1C05_019T01_9000004264_29563cztM0_level2_quad_clean.evt |
| Size (bytes) | 553,916,160 | 112,944,960 |
| Size | 528.3 MB | 107.7 MB |
| Events in quadrant A | 3,364,890 | 747,111 |
| Events in quadrant B | 3,439,792 | 766,229 |
| Events in quadrant C | 3,663,584 | 721,115 |
| Events in quadrant D | 5,807,705 | 674,029 |
| Mode SS | |||
|---|---|---|---|
| Quadrant | BADHDUFLAG | Total packets | Discarded packets |
| A | 0 | 148 | 0 |
| B | 0 | 148 | 0 |
| C | 0 | 148 | 0 |
| D | 0 | 148 | 0 |
| Mode M0 | |||
|---|---|---|---|
| Quadrant | BADHDUFLAG | Total packets | Discarded packets |
| A | 0 | 15035 | 1 |
| B | 0 | 15162 | 1 |
| C | 0 | 15691 | 1 |
| D | 0 | 22047 | 1 |
| Mode M9 | |||
|---|---|---|---|
| Quadrant | BADHDUFLAG | Total packets | Discarded packets |
| A | 0 | 1 | 0 |
| B | 0 | 1 | 0 |
| C | 0 | 1 | 0 |
| D | 0 | 1 | 0 |
| Quadrant | Total seconds | Saturated seconds | Saturation percentage |
|---|---|---|---|
| A | 7351 | 198 | 2.693511% |
| B | 7352 | 224 | 3.046790% |
| C | 7352 | 578 | 7.861806% |
| D | 7352 | 794 | 10.799782% |
Noise dominated data is calculated using 1-second bins in cleaned event files. If a bin has >2000 counts, and if more than 50% of those come from <1% of pixels, then it is considered to be noise-dominated and hence unusable.
| Quadrant | # 1 sec bins | Bins with >0 counts | Bins with >2000 counts | High rate bins dominated by noise | Noise dominated (total time) | Noise dominated (detector-on time) | Marked lightcurve |
|---|---|---|---|---|---|---|---|
| A | 7386 | 7352 | 0 | 0 | 0.00% | 0.00% | 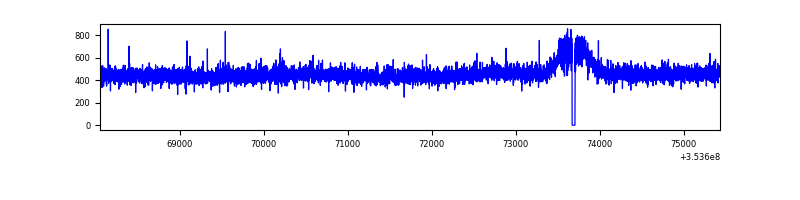 |
| B | 7387 | 7353 | 1 | 1 | 0.01% | 0.01% | 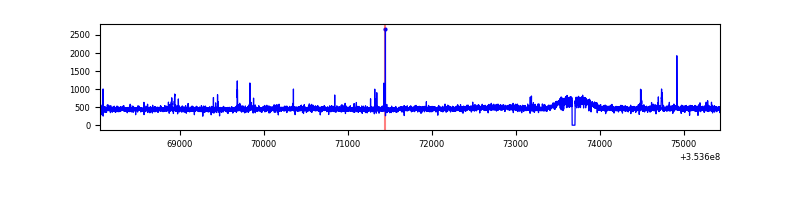 |
| C | 7387 | 7353 | 0 | 0 | 0.00% | 0.00% | 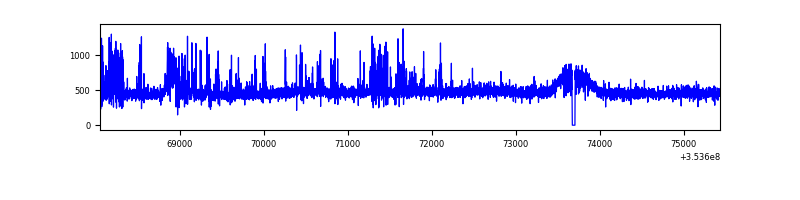 |
| D | 7387 | 7353 | 597 | 597 | 8.08% | 8.12% | 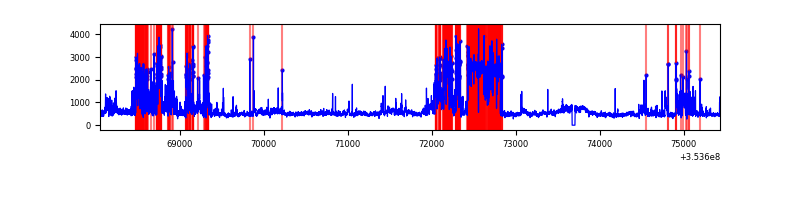 |
Top three noisy pixels from each quadrant. If the there are fewer than three noisy pixels in the level2.evt file, extra rows are filled as -1
| Pixel properties | Quadrant properties | ||||||
|---|---|---|---|---|---|---|---|
| Quadrant | DetID | PixID | Counts | Sigma | Mean | Median | Sigma |
| A | 13 | 254 | 13605 | 72.68 | 871 | 852 | 175.5 |
| A | 3 | 137 | 8942 | 46.11 | 871 | 852 | 175.5 |
| A | 0 | 226 | 7232 | 36.36 | 871 | 852 | 175.5 |
| B | 0 | 190 | 28397 | 166.03 | 866 | 841 | 166.0 |
| B | 12 | 111 | 21058 | 121.81 | 866 | 841 | 166.0 |
| B | 11 | 111 | 19163 | 110.39 | 866 | 841 | 166.0 |
| C | 14 | 238 | 260434 | 1369.71 | 816 | 820 | 189.5 |
| C | 14 | 254 | 174025 | 913.82 | 816 | 820 | 189.5 |
| C | 2 | 114 | 17187 | 86.35 | 816 | 820 | 189.5 |
| D | 13 | 104 | 1268064 | 6632.95 | 805 | 783 | 191.1 |
| D | 7 | 238 | 759245 | 3969.79 | 805 | 783 | 191.1 |
| D | 8 | 195 | 412342 | 2154.1 | 805 | 783 | 191.1 |
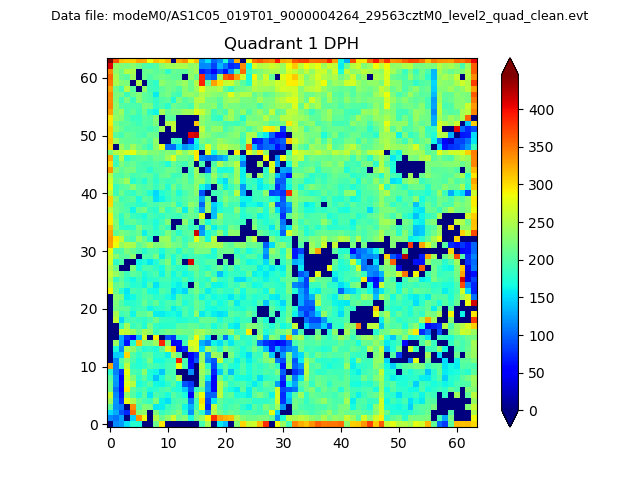
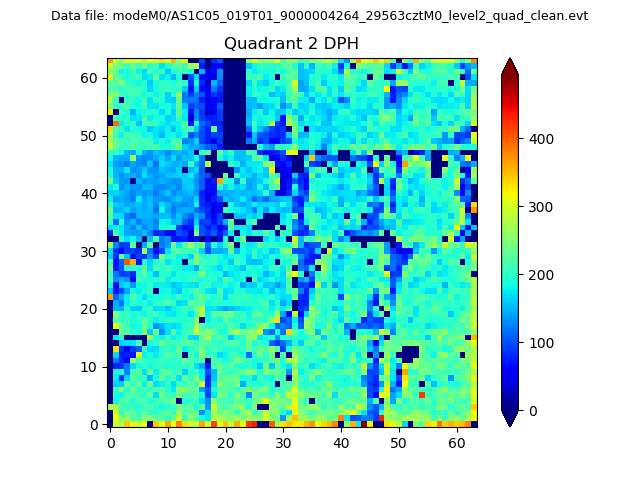
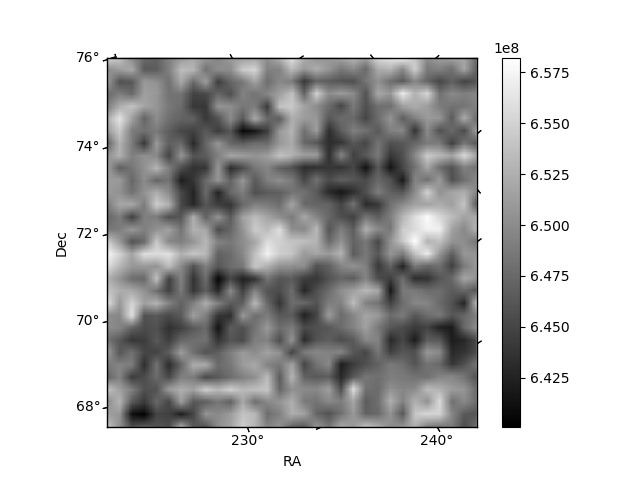
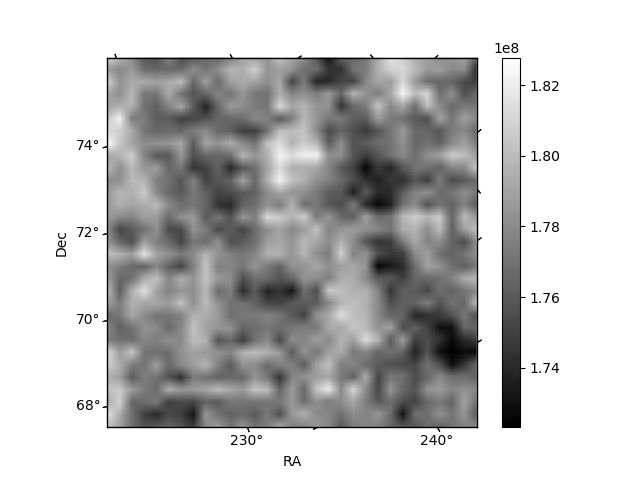
Histogram calculated using DETX and DETY for each event in the final _common_clean file
| Quadrant A |  |
 |
Quadrant B |
|---|---|---|---|
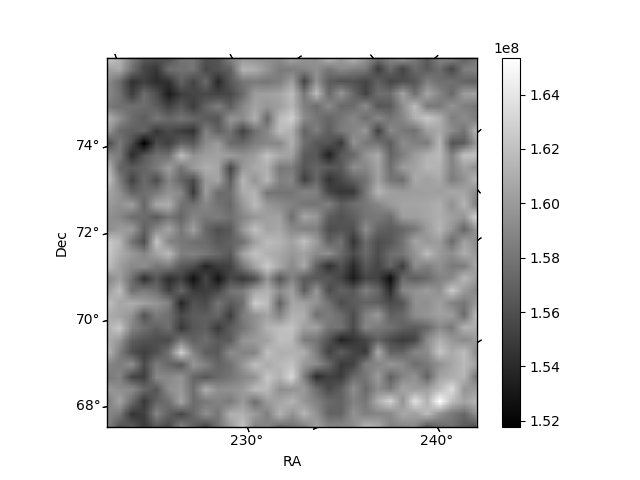
| Quadrant D | 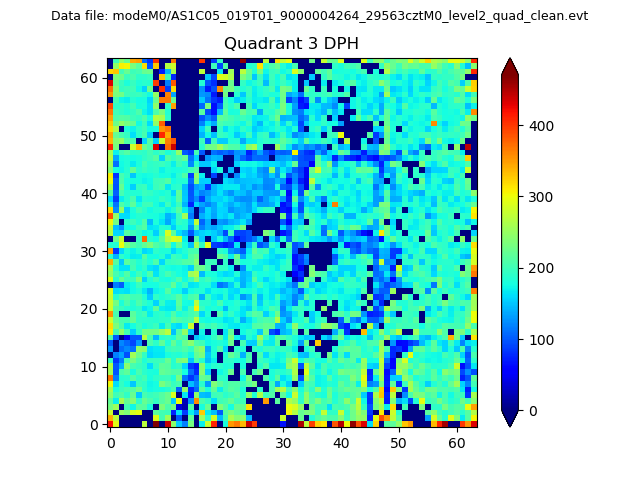 |
 |
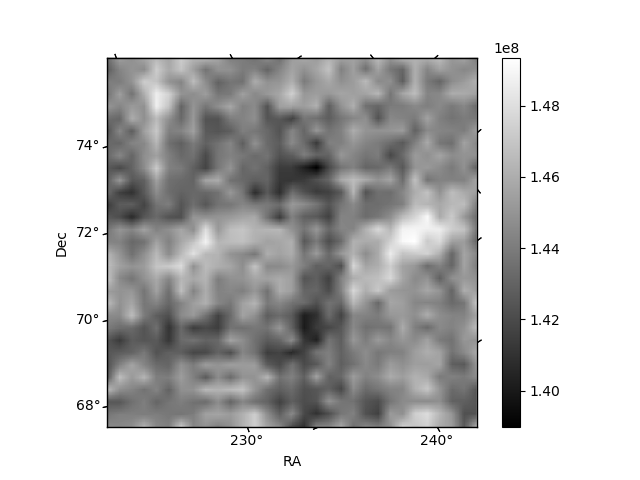
Quadrant C |
| Plot type | Count rate plots | Images |
|---|---|---|
| Comparison with Poisson distribution Blue bars denote a histogram of data divided into 1 sec bins. Red curve is a Poisson curve with rate = median count rate of data. |
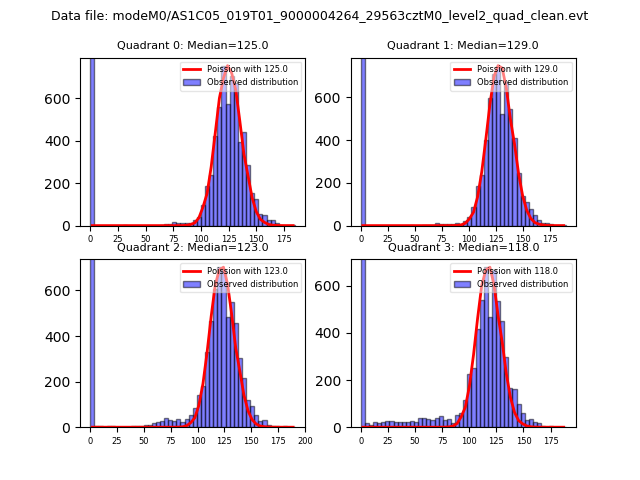 |
 |
| Quadrant-wise count rates Data is divided into 100 sec bins |
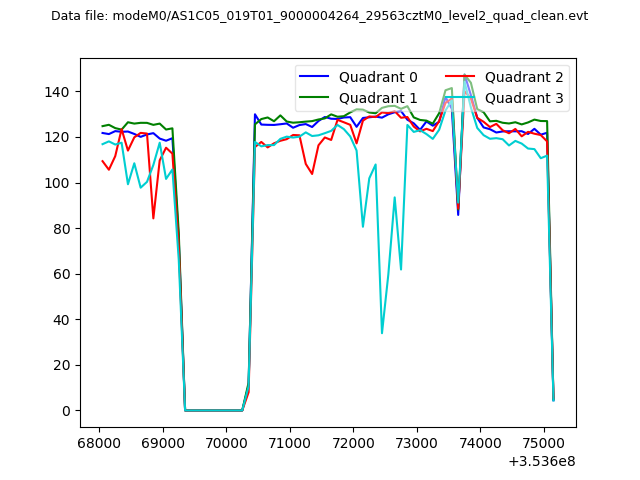 |
|
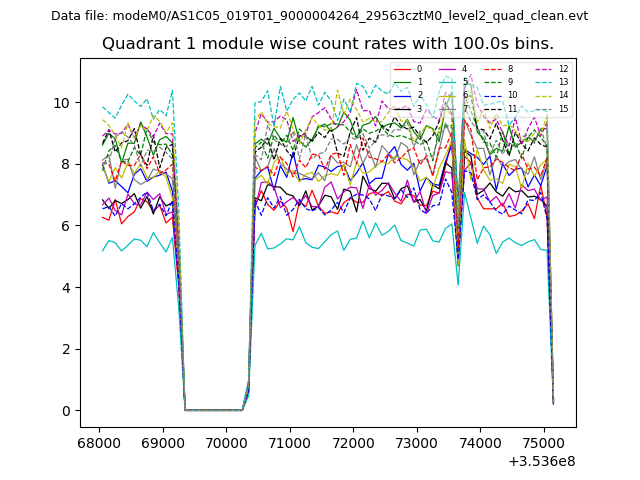
| Module-wise count rates for Quadrant A Data is divided into 100 sec bins |
 |
 |
| Module-wise count rates for Quadrant B Data is divided into 100 sec bins |
 |
 |
| Module-wise count rates for Quadrant C Data is divided into 100 sec bins |
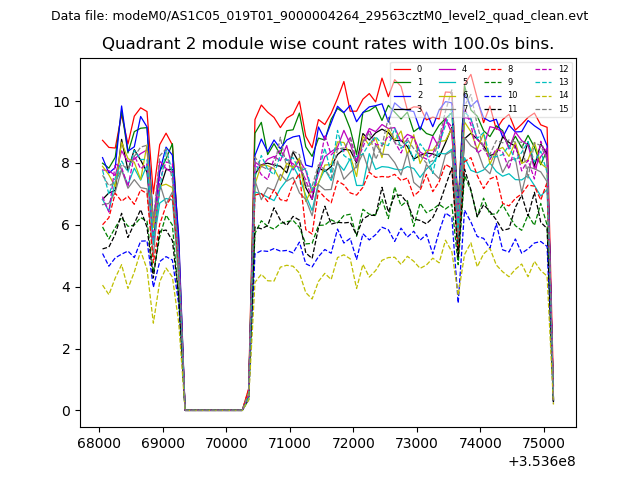 |
 |
| Module-wise count rates for Quadrant D Data is divided into 100 sec bins |
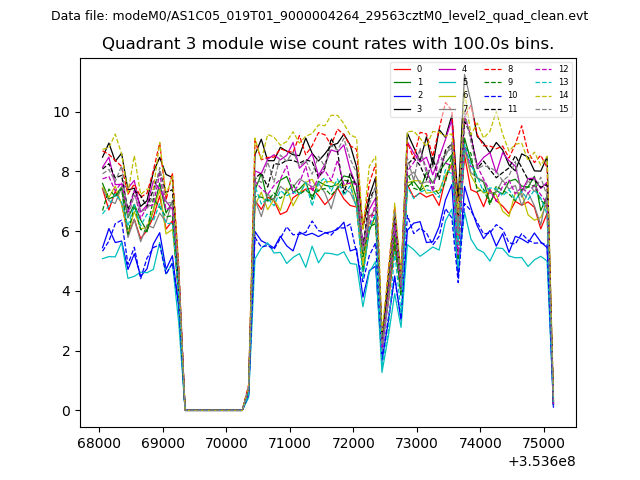 |
 |
| Parameter | Plot |
|---|---|
| CZT HV Monitor | 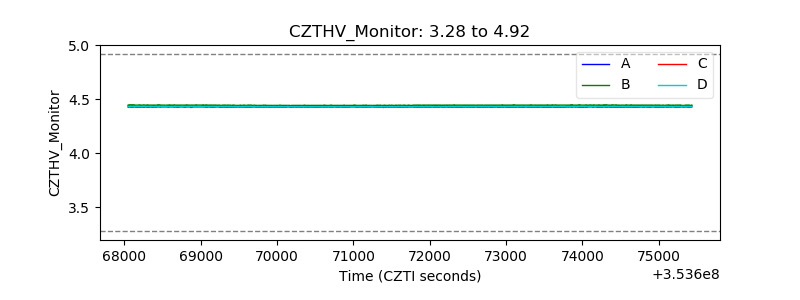 |
| D_VDD | 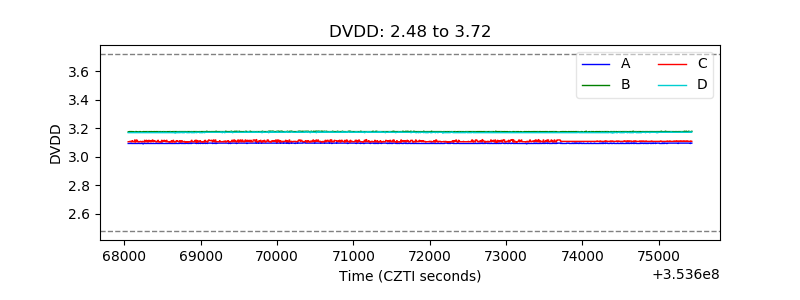 |
| Temperature 1 | 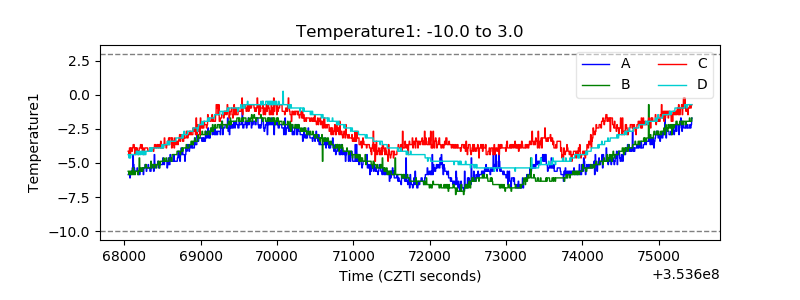 |
| Veto HV Monitor | 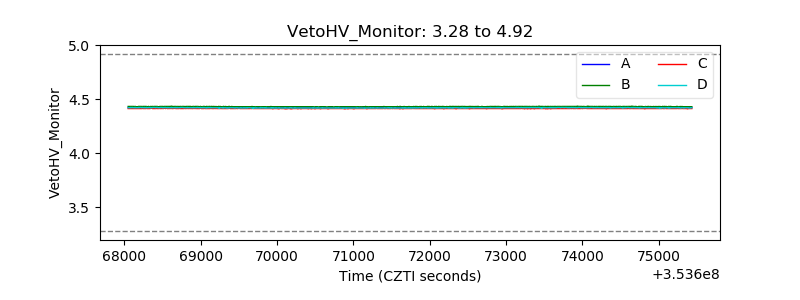 |
| Veto LLD | 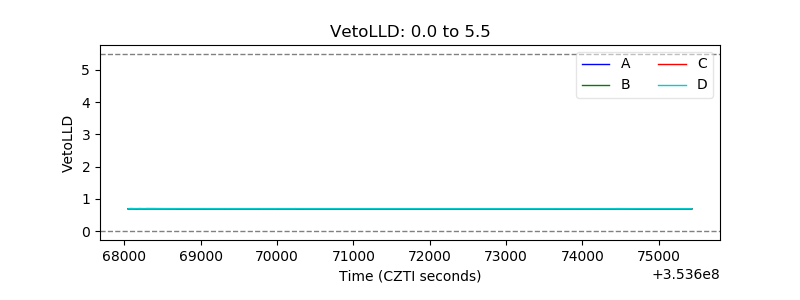 |
| Alpha Counter | 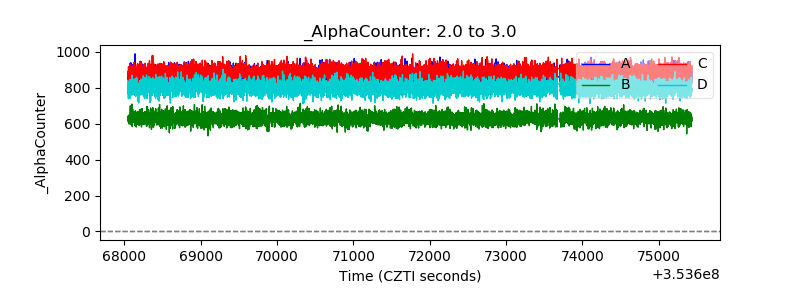 |
| _CPM_Rate | 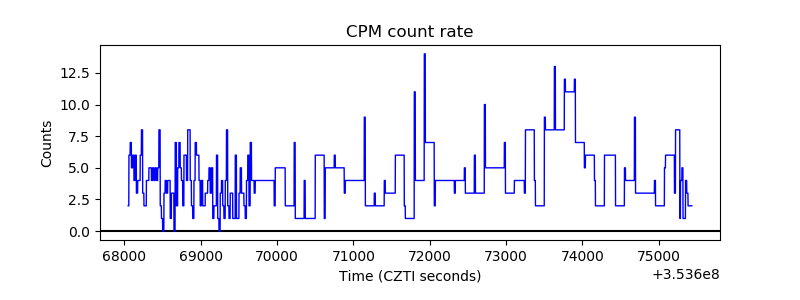 |
| CZT Counter | 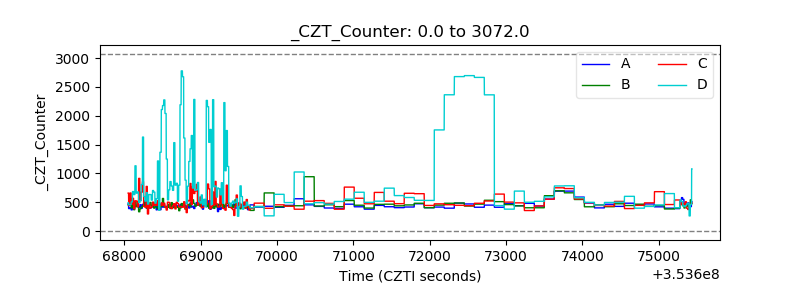 |
| +2.5 Volts monitor |  |
| +5 Volts monitor |  |
| _ROLL_ROT |  |
| _Roll_DEC | 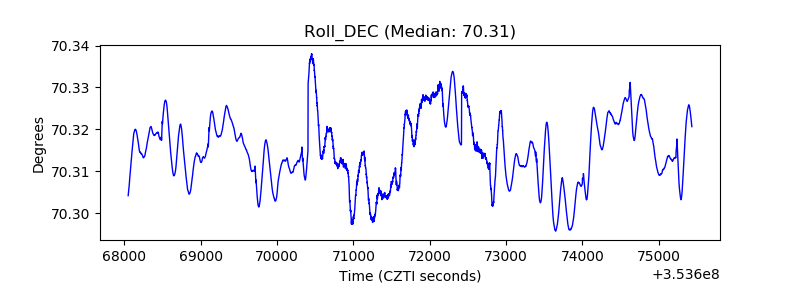 |
| _Roll_RA | 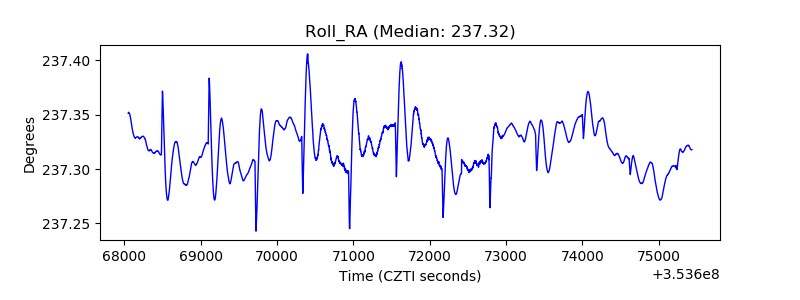 |
| Veto Counter |  |