| Param | Original file | Final file |
|---|---|---|
| Filename | modeM0/AS1C05_019T01_9000004264_29566cztM0_level2.evt | modeM0/AS1C05_019T01_9000004264_29566cztM0_level2_quad_clean.evt |
| Size (bytes) | 1,474,591,680 | 260,193,600 |
| Size | 1.4 GB | 248.1 MB |
| Events in quadrant A | 8,234,344 | 1,697,013 |
| Events in quadrant B | 8,485,458 | 1,731,020 |
| Events in quadrant C | 8,580,906 | 1,640,520 |
| Events in quadrant D | 18,137,073 | 1,565,447 |
| Mode SS | |||
|---|---|---|---|
| Quadrant | BADHDUFLAG | Total packets | Discarded packets |
| A | 0 | 368 | 0 |
| B | 0 | 368 | 0 |
| C | 0 | 368 | 0 |
| D | 0 | 368 | 0 |
| Mode M0 | |||
|---|---|---|---|
| Quadrant | BADHDUFLAG | Total packets | Discarded packets |
| A | 0 | 36648 | 3 |
| B | 0 | 37092 | 3 |
| C | 0 | 37114 | 3 |
| D | 0 | 65927 | 4 |
| Mode M9 | |||
|---|---|---|---|
| Quadrant | BADHDUFLAG | Total packets | Discarded packets |
| A | 0 | 16 | 0 |
| B | 0 | 16 | 0 |
| C | 0 | 16 | 0 |
| D | 0 | 16 | 0 |
| Quadrant | Total seconds | Saturated seconds | Saturation percentage |
|---|---|---|---|
| A | 18085 | 181 | 1.000829% |
| B | 18085 | 219 | 1.210948% |
| C | 18086 | 549 | 3.035497% |
| D | 18085 | 1638 | 9.057230% |
Noise dominated data is calculated using 1-second bins in cleaned event files. If a bin has >2000 counts, and if more than 50% of those come from <1% of pixels, then it is considered to be noise-dominated and hence unusable.
| Quadrant | # 1 sec bins | Bins with >0 counts | Bins with >2000 counts | High rate bins dominated by noise | Noise dominated (total time) | Noise dominated (detector-on time) | Marked lightcurve |
|---|---|---|---|---|---|---|---|
| A | 19710 | 18088 | 0 | 0 | 0.00% | 0.00% | 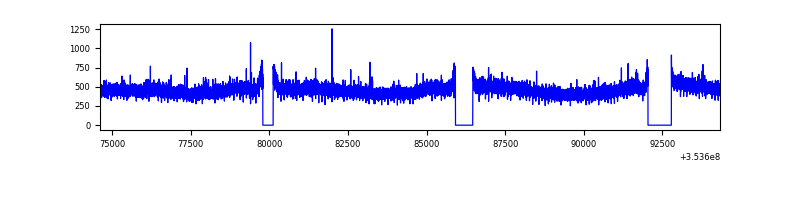 |
| B | 19710 | 18088 | 9 | 9 | 0.05% | 0.05% | 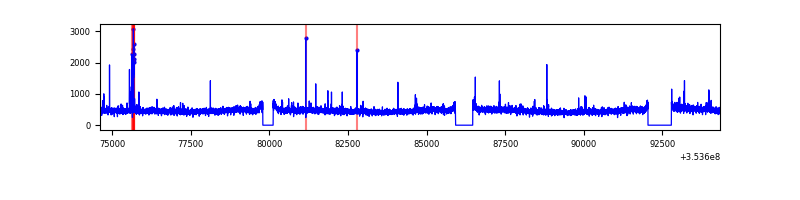 |
| C | 19711 | 18089 | 0 | 0 | 0.00% | 0.00% | 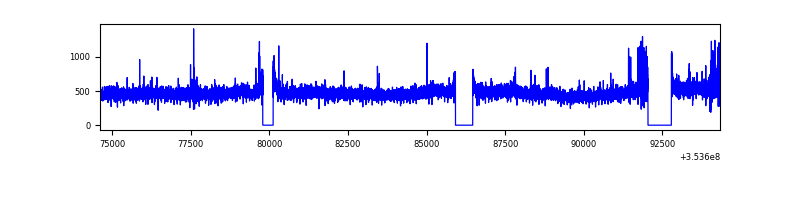 |
| D | 19710 | 18088 | 1350 | 1350 | 6.85% | 7.46% | 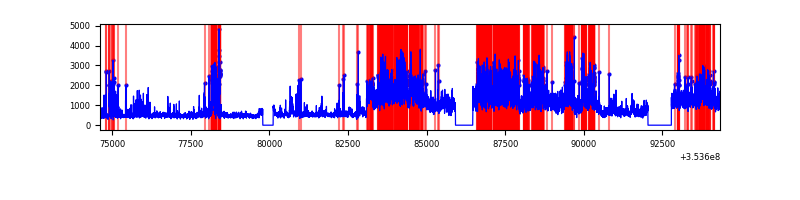 |
Top three noisy pixels from each quadrant. If the there are fewer than three noisy pixels in the level2.evt file, extra rows are filled as -1
| Pixel properties | Quadrant properties | ||||||
|---|---|---|---|---|---|---|---|
| Quadrant | DetID | PixID | Counts | Sigma | Mean | Median | Sigma |
| A | 13 | 254 | 33533 | 73.77 | 2131 | 2085 | 426.3 |
| A | 3 | 137 | 21869 | 46.41 | 2131 | 2085 | 426.3 |
| A | 0 | 226 | 18174 | 37.74 | 2131 | 2085 | 426.3 |
| B | 0 | 156 | 71874 | 174.95 | 2118 | 2064 | 399.0 |
| B | 0 | 190 | 66857 | 162.37 | 2118 | 2064 | 399.0 |
| B | 12 | 111 | 51154 | 123.02 | 2118 | 2064 | 399.0 |
| C | 14 | 238 | 403408 | 852.55 | 2026 | 2037 | 470.8 |
| C | 14 | 254 | 109813 | 228.93 | 2026 | 2037 | 470.8 |
| C | 3 | 233 | 80765 | 167.23 | 2026 | 2037 | 470.8 |
| D | 12 | 33 | 6810865 | 14271.83 | 2019 | 1966 | 477.1 |
| D | 13 | 104 | 1558679 | 3262.96 | 2019 | 1966 | 477.1 |
| D | 8 | 195 | 1130328 | 2365.11 | 2019 | 1966 | 477.1 |
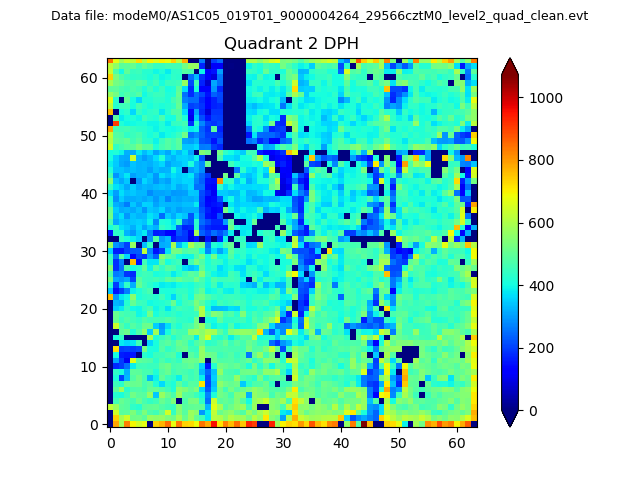
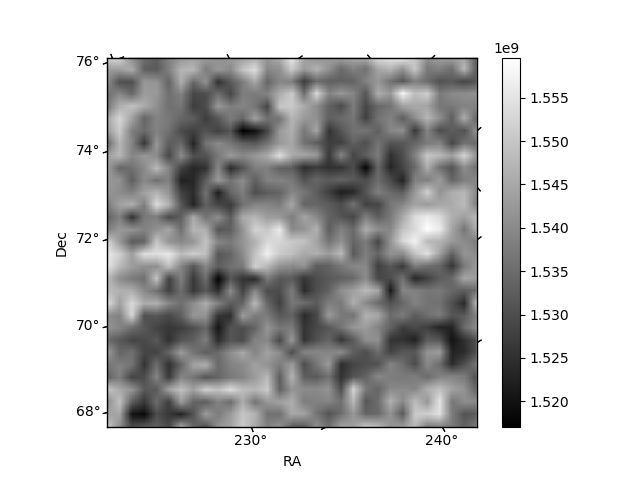
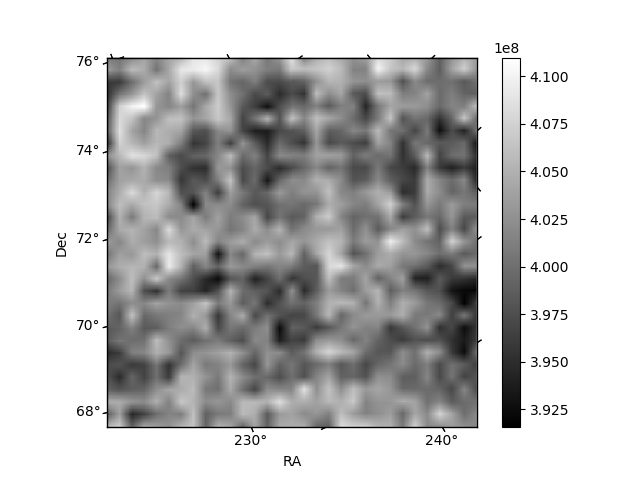
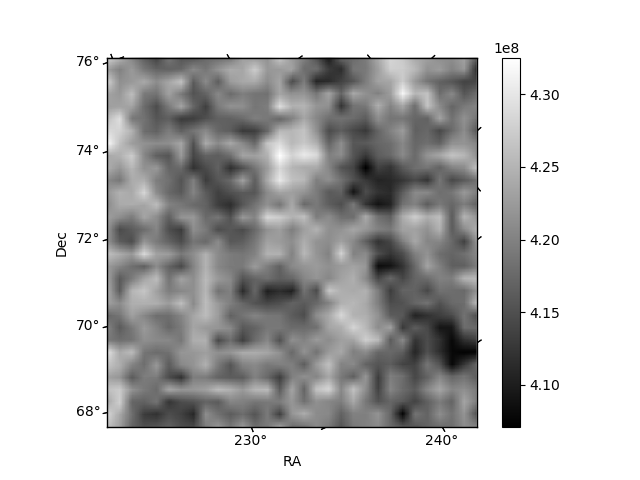
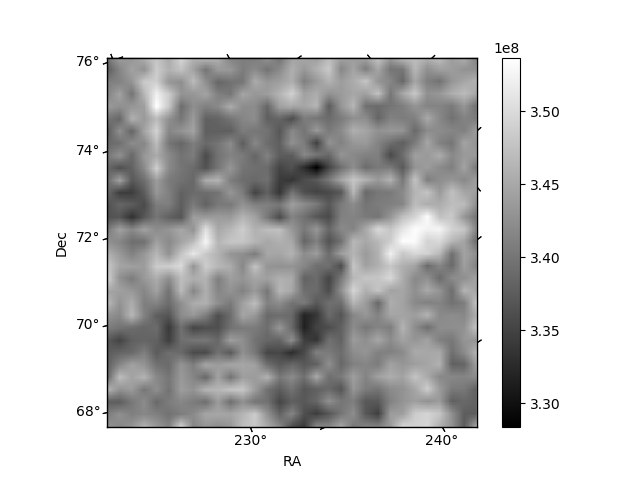
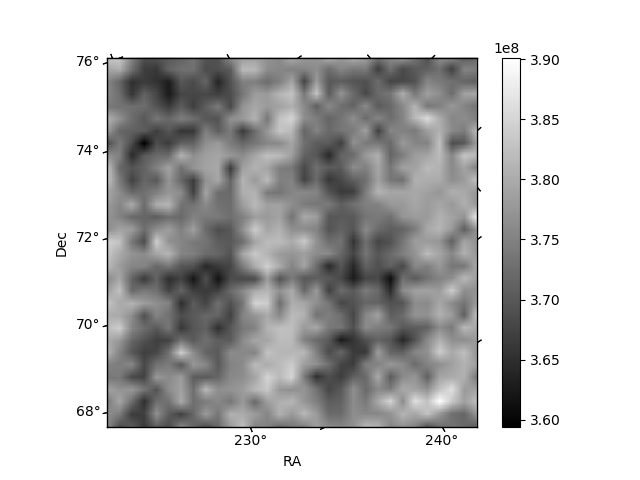
Histogram calculated using DETX and DETY for each event in the final _common_clean file
| Quadrant A | 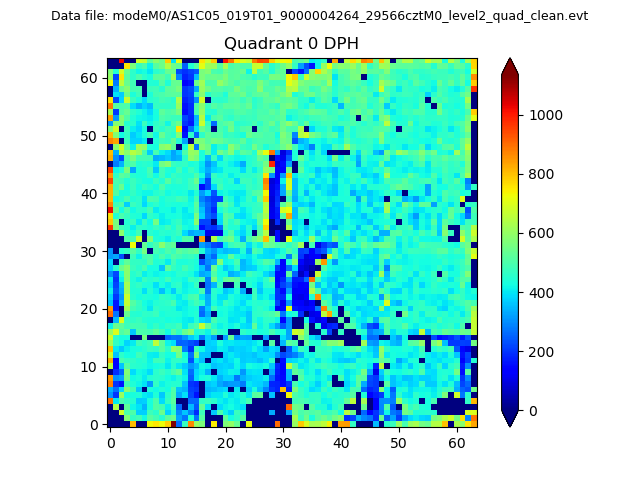 |
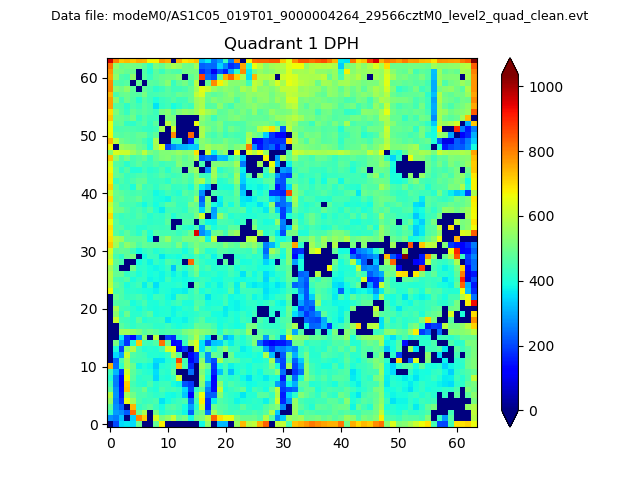 |
Quadrant B |
|---|---|---|---|
| Quadrant D | 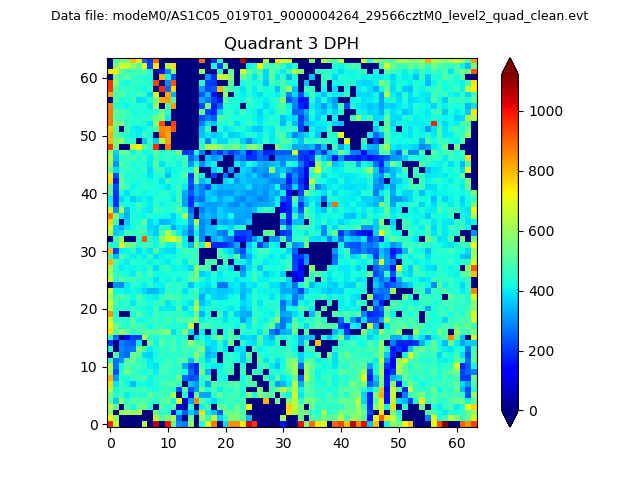 |
 |
Quadrant C |
| Plot type | Count rate plots | Images |
|---|---|---|
| Comparison with Poisson distribution Blue bars denote a histogram of data divided into 1 sec bins. Red curve is a Poisson curve with rate = median count rate of data. |
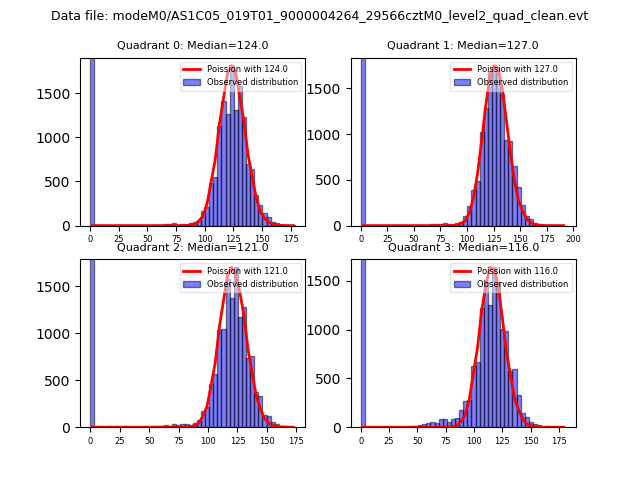 |
 |
| Quadrant-wise count rates Data is divided into 100 sec bins |
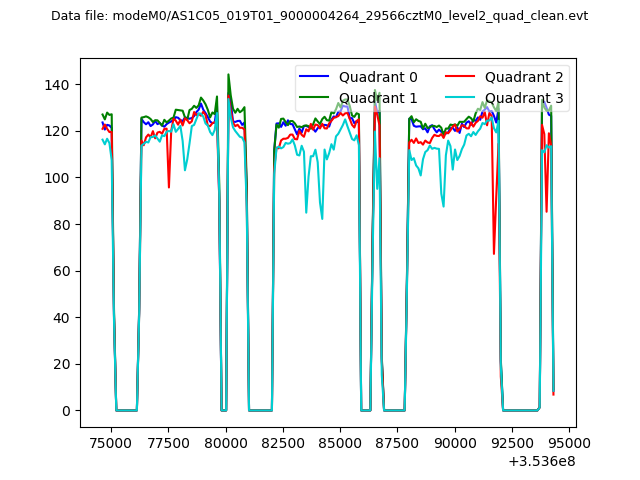 |
|
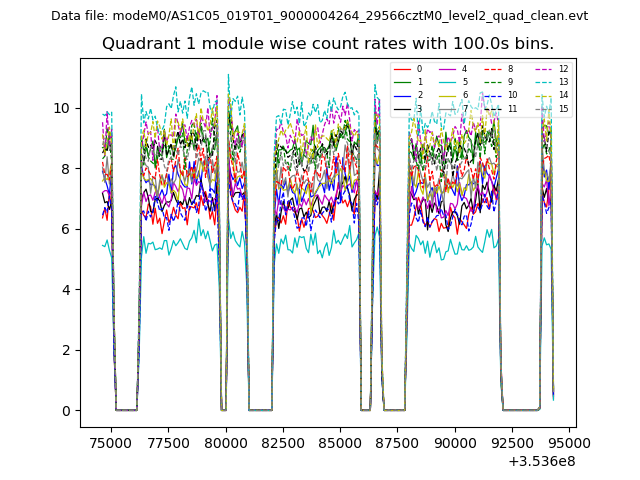
| Module-wise count rates for Quadrant A Data is divided into 100 sec bins |
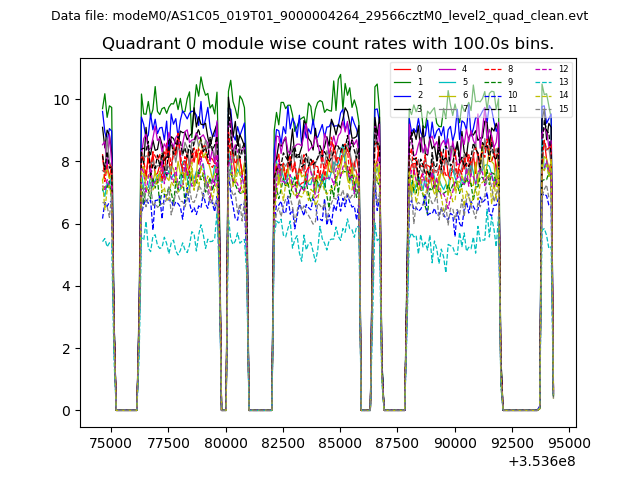 |
 |
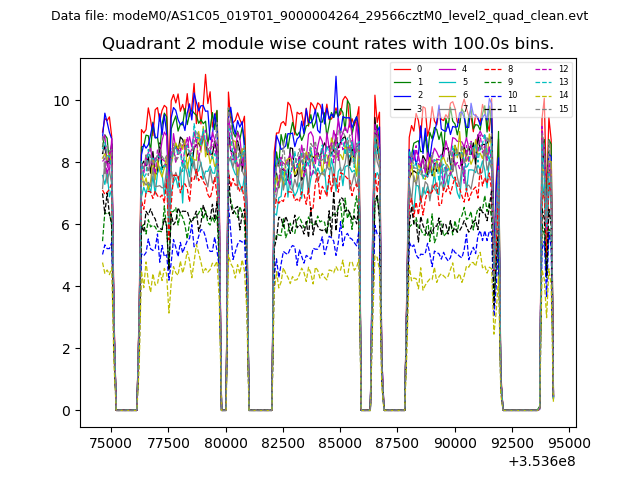
| Module-wise count rates for Quadrant B Data is divided into 100 sec bins |
 |
 |
| Module-wise count rates for Quadrant C Data is divided into 100 sec bins |
 |
 |
| Module-wise count rates for Quadrant D Data is divided into 100 sec bins |
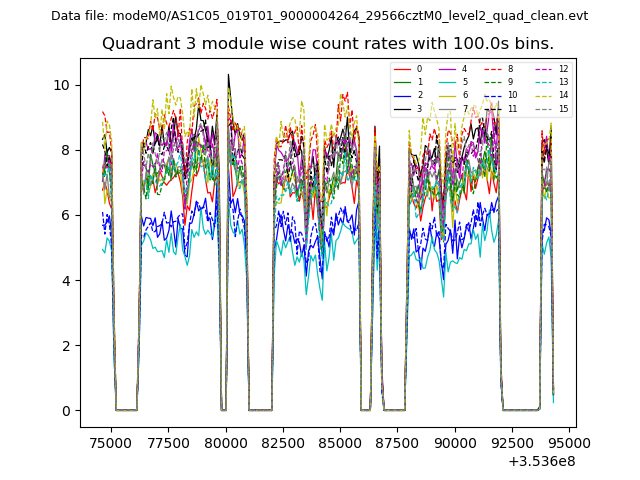 |
 |
| Parameter | Plot |
|---|---|
| CZT HV Monitor | 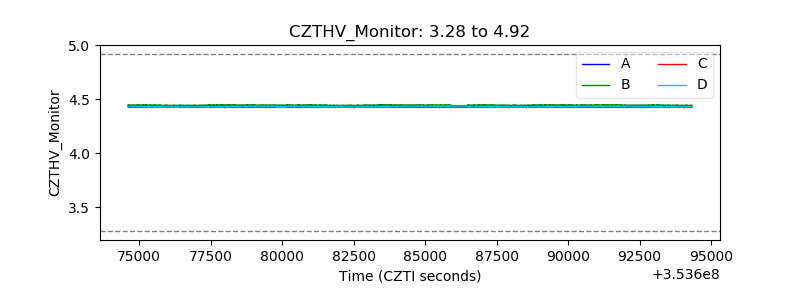 |
| D_VDD | 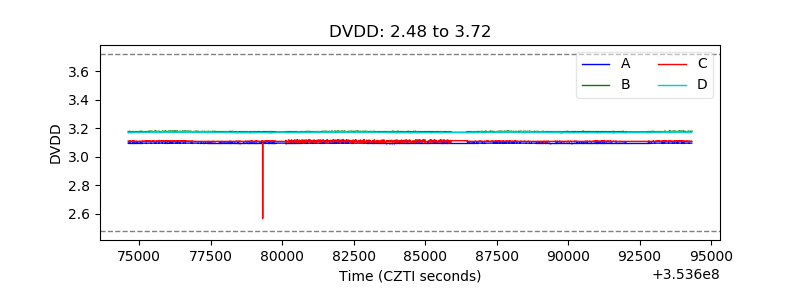 |
| Temperature 1 | 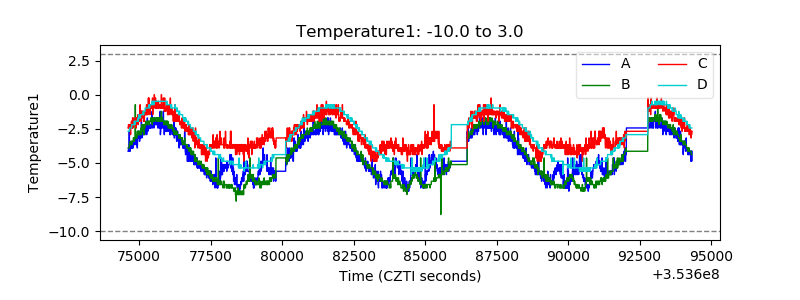 |
| Veto HV Monitor | 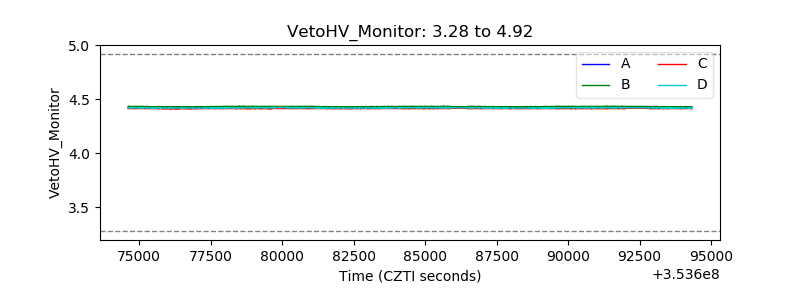 |
| Veto LLD | 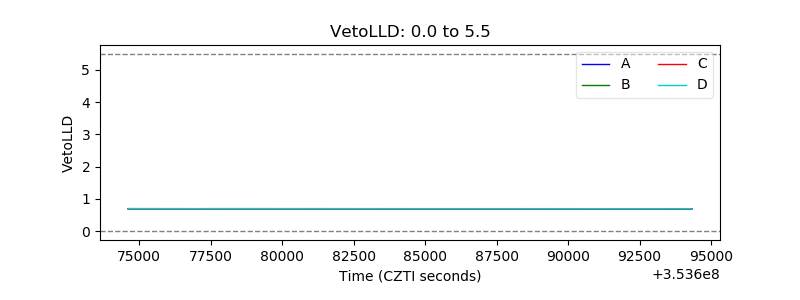 |
| Alpha Counter | 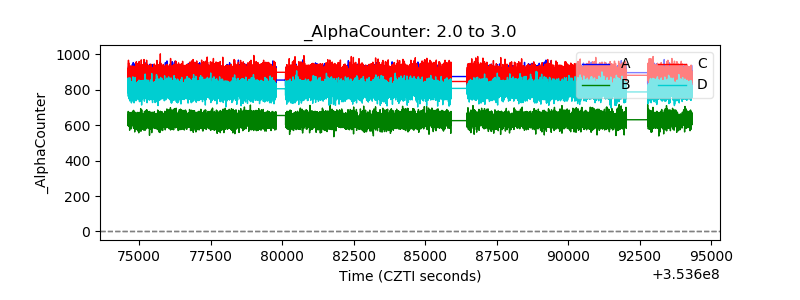 |
| _CPM_Rate | 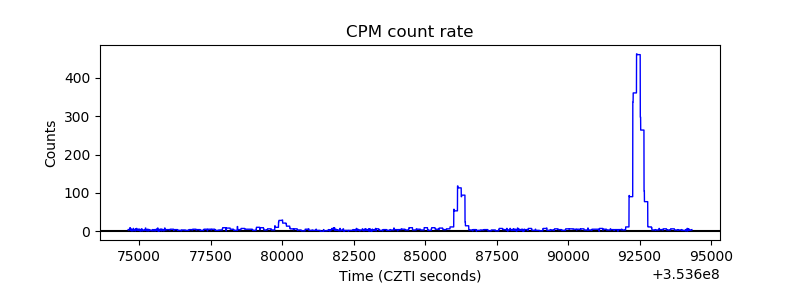 |
| CZT Counter | 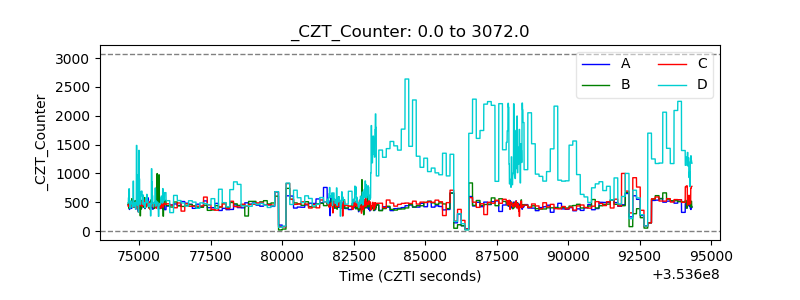 |
| +2.5 Volts monitor |  |
| +5 Volts monitor |  |
| _ROLL_ROT | 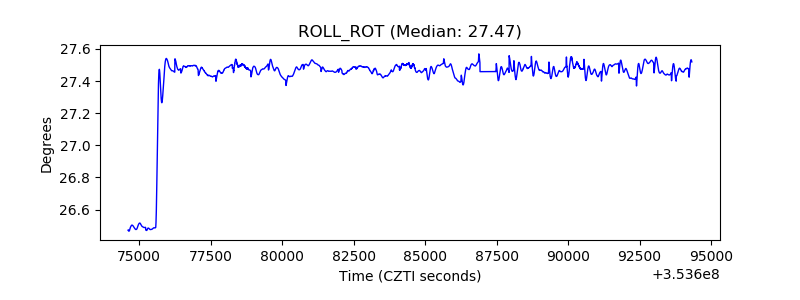 |
| _Roll_DEC | 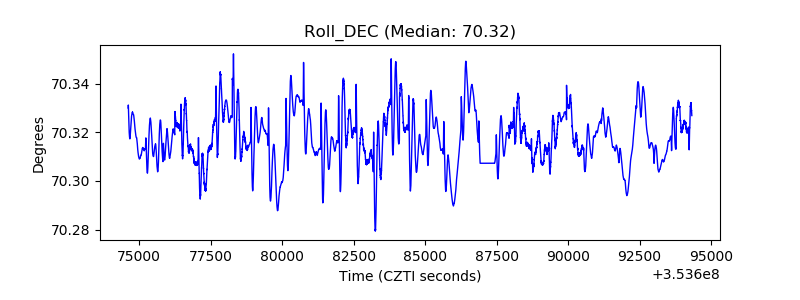 |
| _Roll_RA | 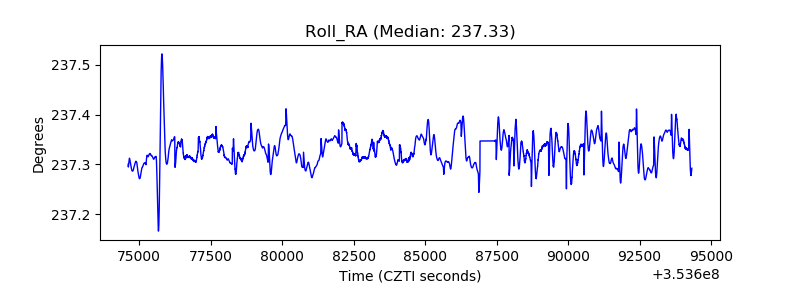 |
| Veto Counter | 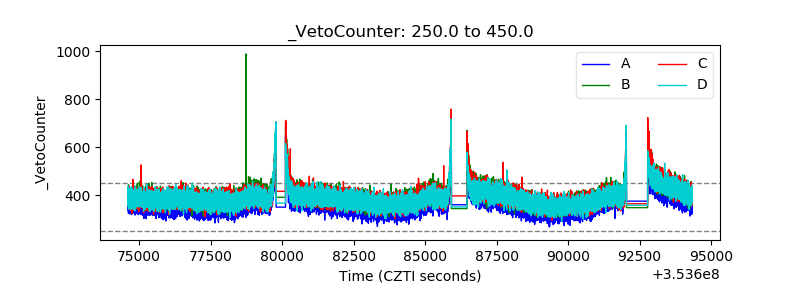 |