| Param | Original file | Final file |
|---|---|---|
| Filename | modeM0/AS1C05_019T01_9000004264_29567cztM0_level2.evt | modeM0/AS1C05_019T01_9000004264_29567cztM0_level2_quad_clean.evt |
| Size (bytes) | 568,272,960 | 99,034,560 |
| Size | 541.9 MB | 94.4 MB |
| Events in quadrant A | 3,149,175 | 649,208 |
| Events in quadrant B | 3,221,587 | 659,277 |
| Events in quadrant C | 3,446,605 | 615,742 |
| Events in quadrant D | 6,937,226 | 606,268 |
| Mode SS | |||
|---|---|---|---|
| Quadrant | BADHDUFLAG | Total packets | Discarded packets |
| A | 0 | 136 | 0 |
| B | 0 | 136 | 0 |
| C | 0 | 136 | 0 |
| D | 0 | 136 | 0 |
| Mode M0 | |||
|---|---|---|---|
| Quadrant | BADHDUFLAG | Total packets | Discarded packets |
| A | 0 | 13811 | 3 |
| B | 0 | 13958 | 2 |
| C | 0 | 14541 | 2 |
| D | 0 | 25457 | 2 |
| Mode M9 | |||
|---|---|---|---|
| Quadrant | BADHDUFLAG | Total packets | Discarded packets |
| A | 0 | 10 | 0 |
| B | 0 | 10 | 0 |
| C | 0 | 10 | 0 |
| D | 0 | 10 | 0 |
| Quadrant | Total seconds | Saturated seconds | Saturation percentage |
|---|---|---|---|
| A | 6722 | 28 | 0.416543% |
| B | 6723 | 30 | 0.446229% |
| C | 6723 | 460 | 6.842184% |
| D | 6723 | 451 | 6.708315% |
Noise dominated data is calculated using 1-second bins in cleaned event files. If a bin has >2000 counts, and if more than 50% of those come from <1% of pixels, then it is considered to be noise-dominated and hence unusable.
| Quadrant | # 1 sec bins | Bins with >0 counts | Bins with >2000 counts | High rate bins dominated by noise | Noise dominated (total time) | Noise dominated (detector-on time) | Marked lightcurve |
|---|---|---|---|---|---|---|---|
| A | 7662 | 6723 | 0 | 0 | 0.00% | 0.00% | 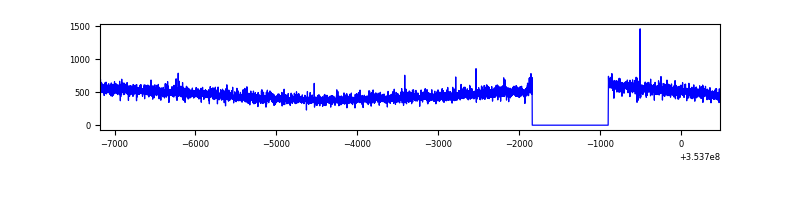 |
| B | 7663 | 6724 | 1 | 1 | 0.01% | 0.01% | 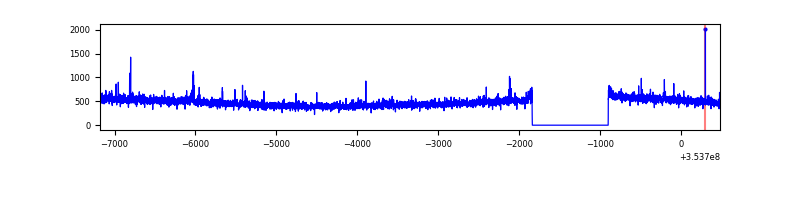 |
| C | 7663 | 6724 | 0 | 0 | 0.00% | 0.00% | 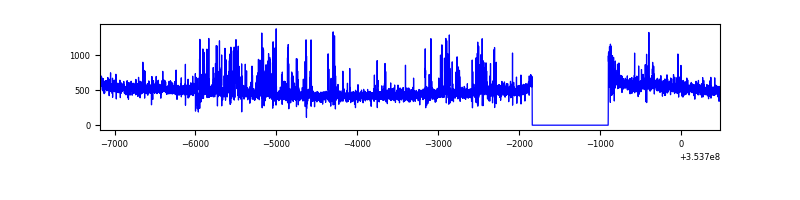 |
| D | 7663 | 6724 | 232 | 232 | 3.03% | 3.45% | 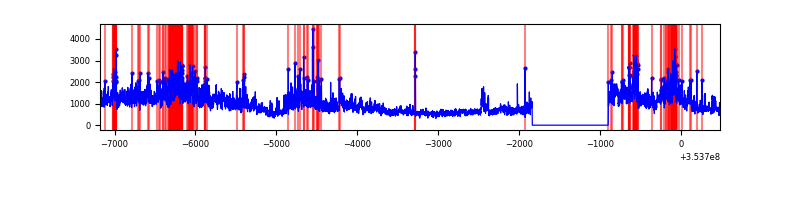 |
Top three noisy pixels from each quadrant. If the there are fewer than three noisy pixels in the level2.evt file, extra rows are filled as -1
| Pixel properties | Quadrant properties | ||||||
|---|---|---|---|---|---|---|---|
| Quadrant | DetID | PixID | Counts | Sigma | Mean | Median | Sigma |
| A | 13 | 254 | 12514 | 71.05 | 812 | 794 | 165.0 |
| A | 0 | 13 | 11640 | 65.75 | 812 | 794 | 165.0 |
| A | 3 | 137 | 8108 | 44.34 | 812 | 794 | 165.0 |
| B | 0 | 190 | 22140 | 137.39 | 810 | 789 | 155.4 |
| B | 12 | 111 | 19127 | 118.0 | 810 | 789 | 155.4 |
| B | 11 | 111 | 17342 | 106.51 | 810 | 789 | 155.4 |
| C | 14 | 238 | 251830 | 1396.07 | 764 | 766 | 179.8 |
| C | 14 | 254 | 182487 | 1010.48 | 764 | 766 | 179.8 |
| C | 2 | 114 | 15733 | 83.23 | 764 | 766 | 179.8 |
| D | 12 | 33 | 2751077 | 14710.52 | 777 | 754 | 187.0 |
| D | 8 | 195 | 439858 | 2348.61 | 777 | 754 | 187.0 |
| D | 13 | 153 | 345325 | 1842.99 | 777 | 754 | 187.0 |
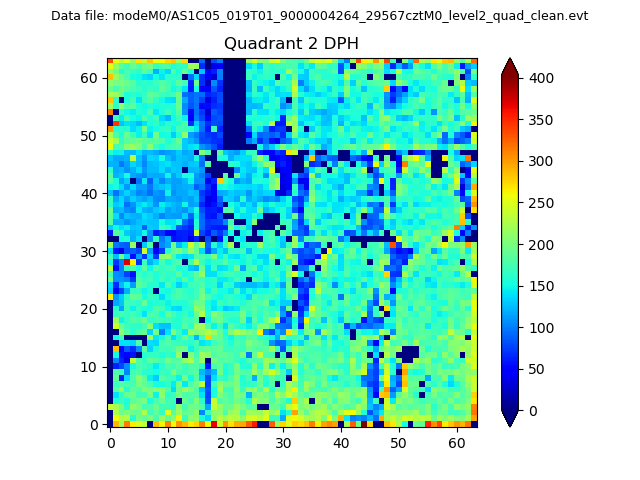
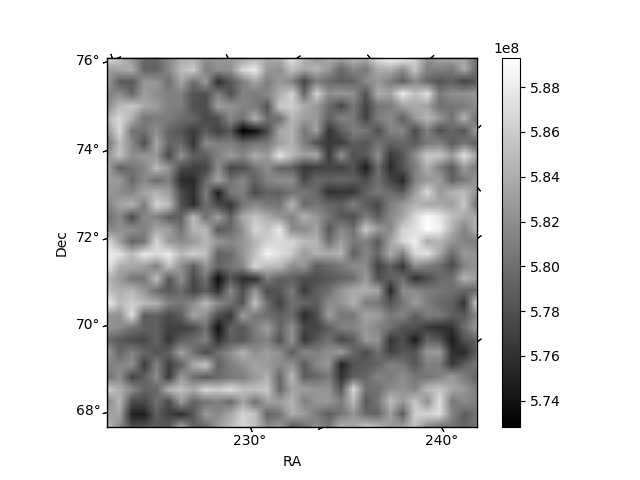
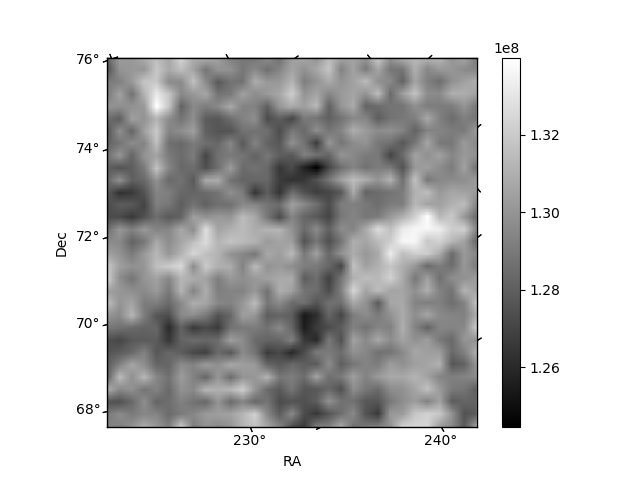
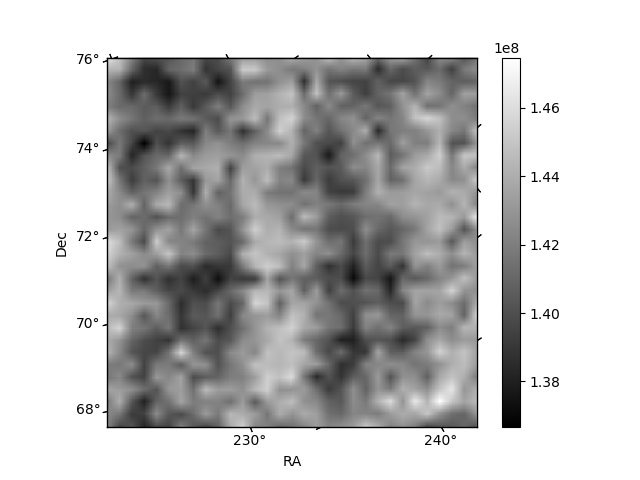
Histogram calculated using DETX and DETY for each event in the final _common_clean file
| Quadrant A | 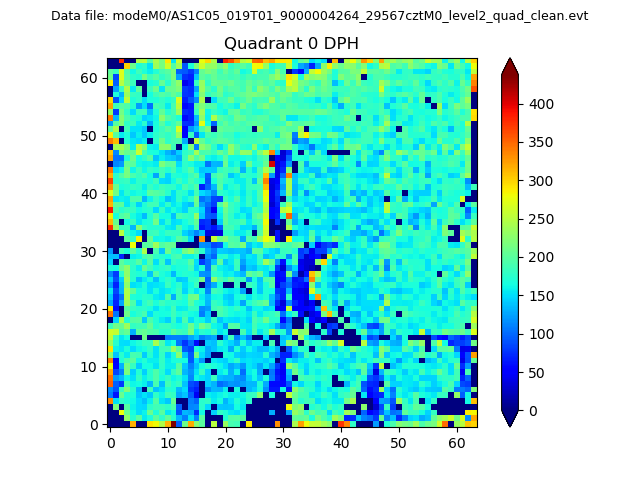 |
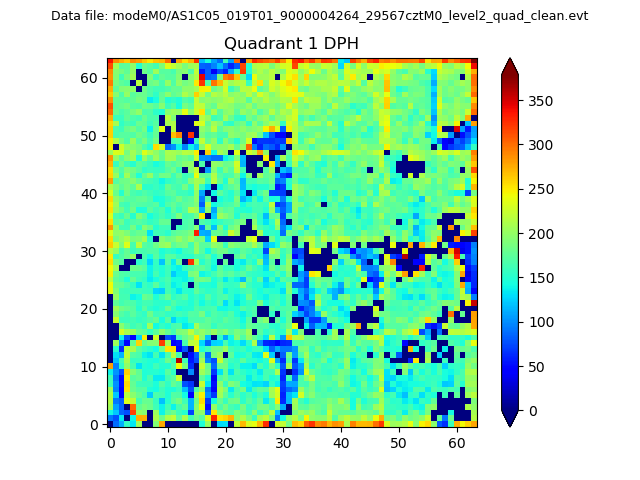 |
Quadrant B |
|---|---|---|---|
| Quadrant D | 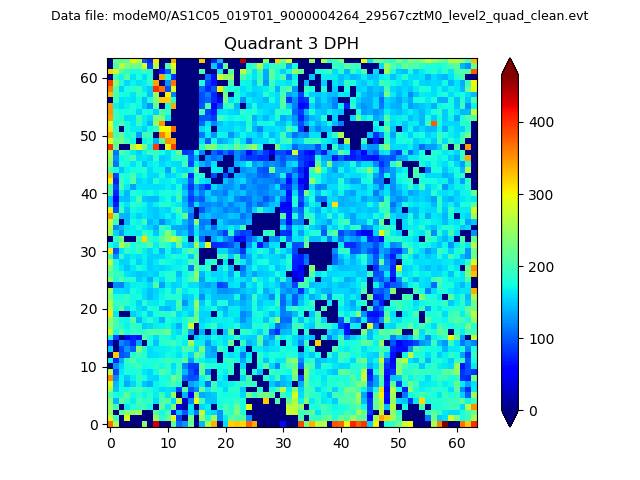 |
 |
Quadrant C |
| Plot type | Count rate plots | Images |
|---|---|---|
| Comparison with Poisson distribution Blue bars denote a histogram of data divided into 1 sec bins. Red curve is a Poisson curve with rate = median count rate of data. |
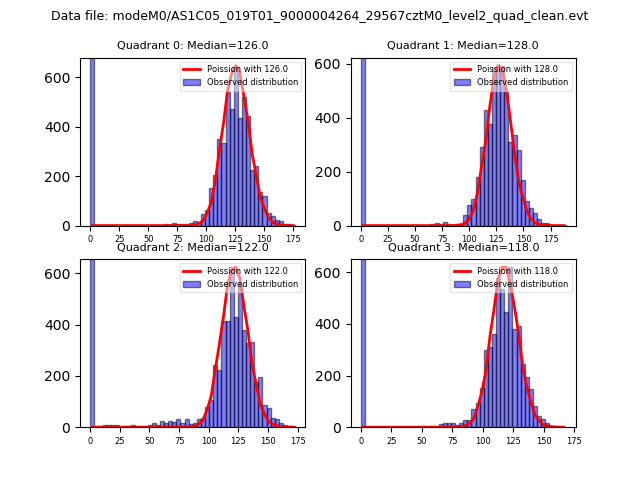 |
 |
| Quadrant-wise count rates Data is divided into 100 sec bins |
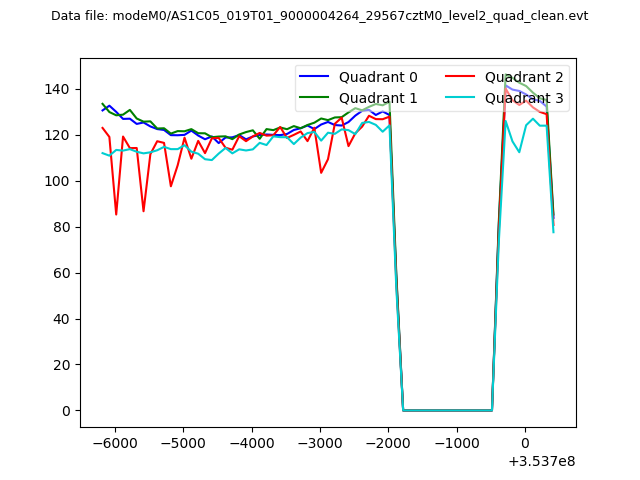 |
|
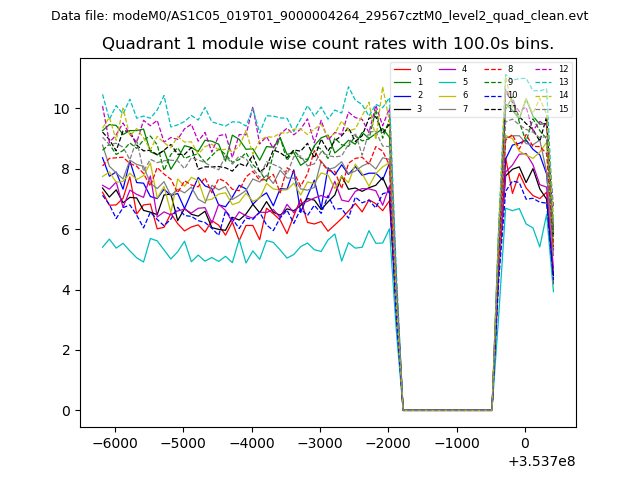
| Module-wise count rates for Quadrant A Data is divided into 100 sec bins |
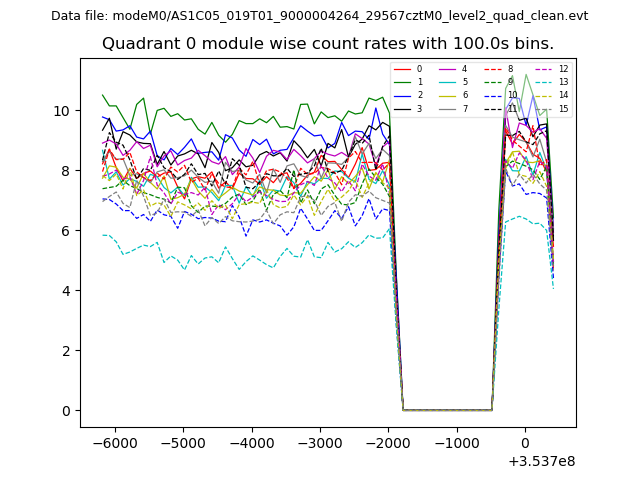 |
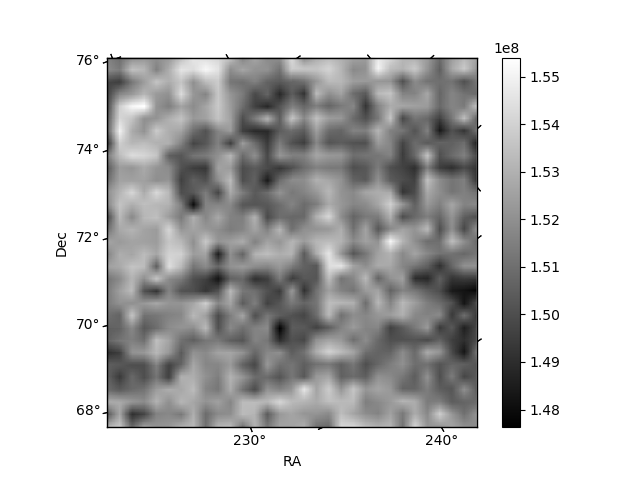 |
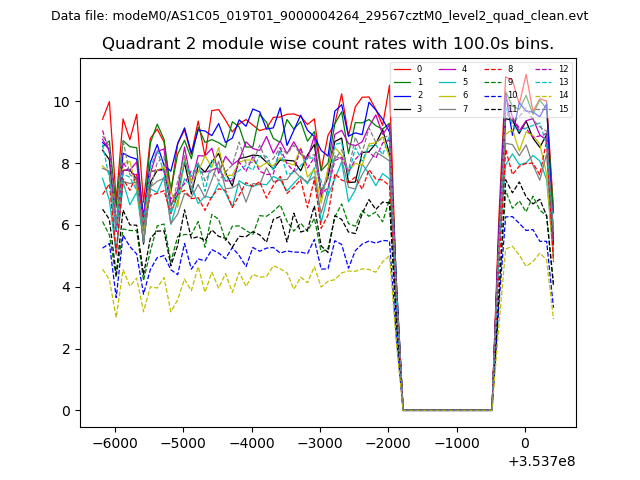
| Module-wise count rates for Quadrant B Data is divided into 100 sec bins |
 |
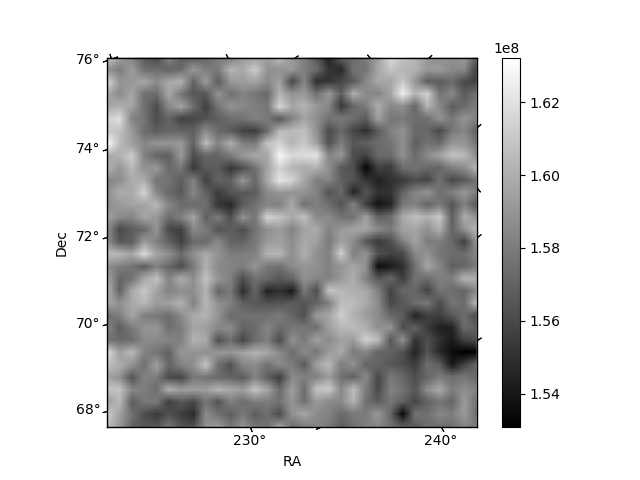 |
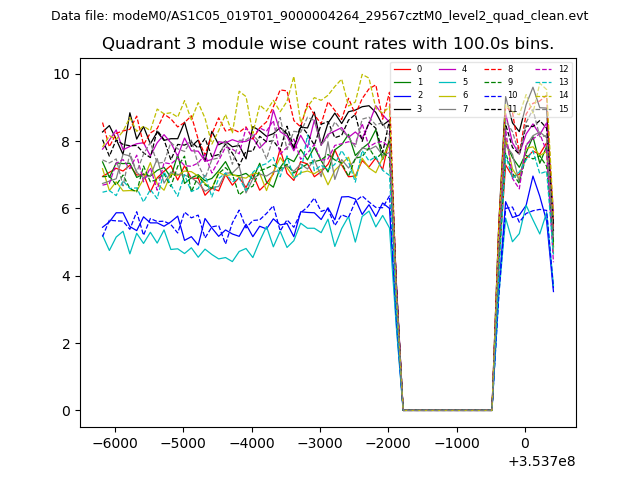
| Module-wise count rates for Quadrant C Data is divided into 100 sec bins |
 |
 |
| Module-wise count rates for Quadrant D Data is divided into 100 sec bins |
 |
 |
| Parameter | Plot |
|---|---|
| CZT HV Monitor | 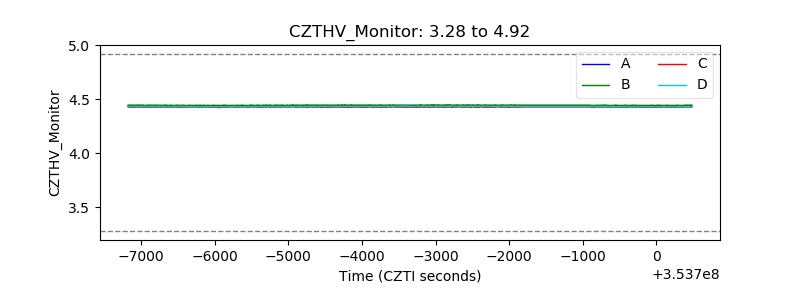 |
| D_VDD | 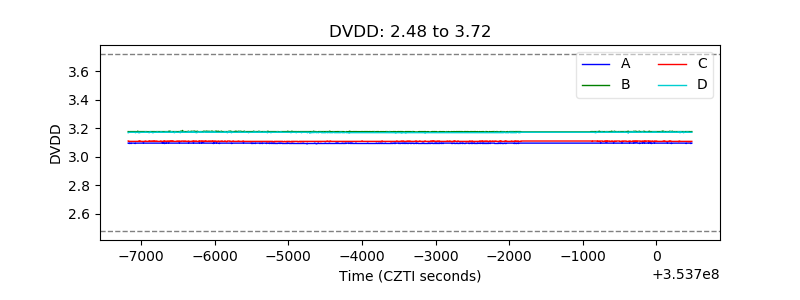 |
| Temperature 1 |  |
| Veto HV Monitor | 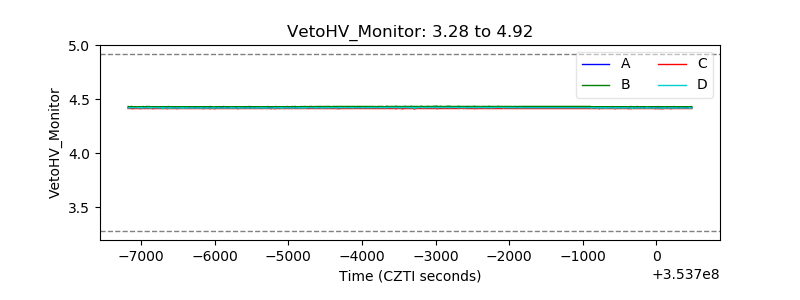 |
| Veto LLD | 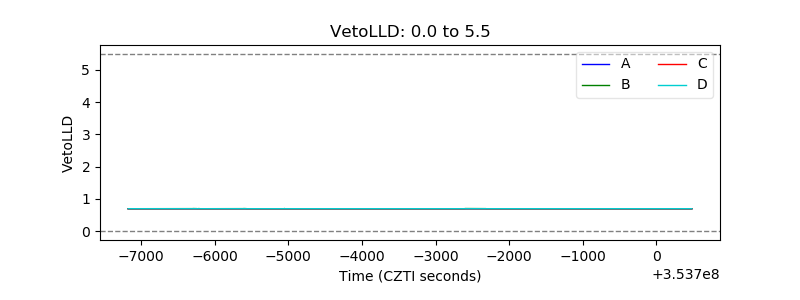 |
| Alpha Counter | 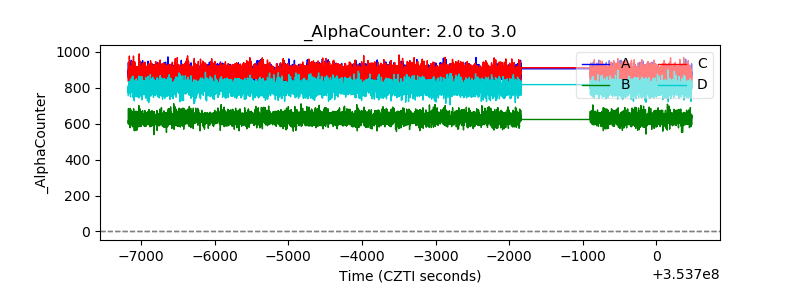 |
| _CPM_Rate | 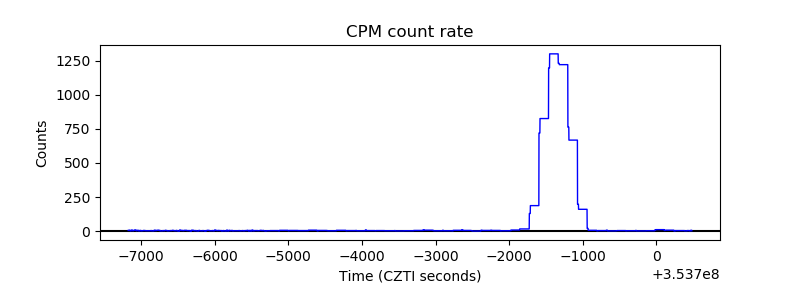 |
| CZT Counter | 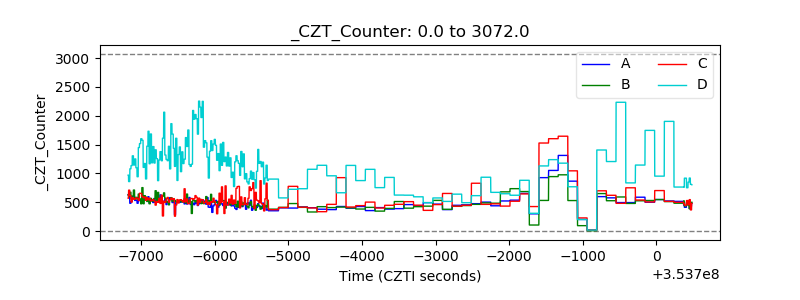 |
| +2.5 Volts monitor |  |
| +5 Volts monitor | 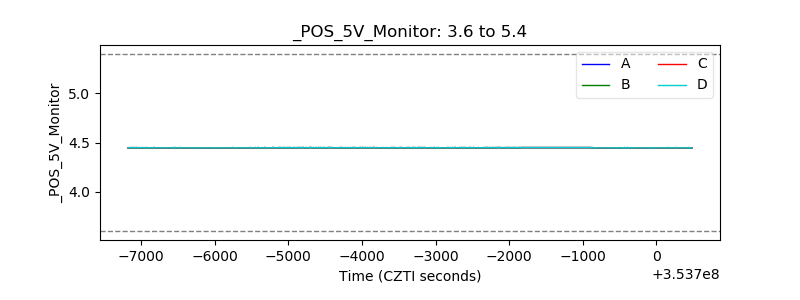 |
| _ROLL_ROT | 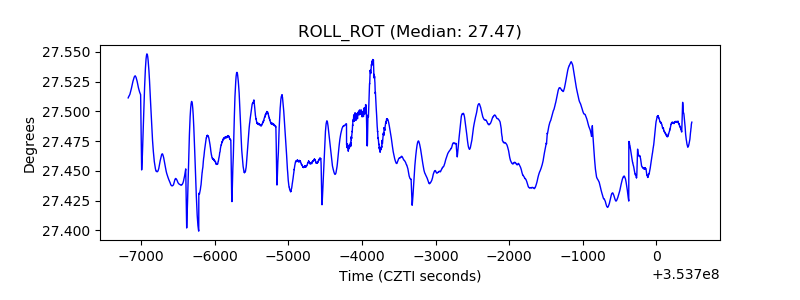 |
| _Roll_DEC | 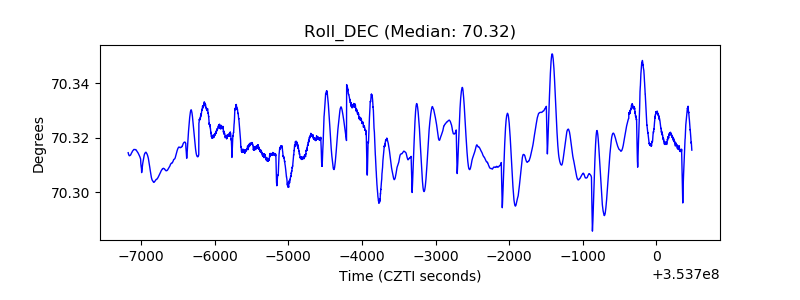 |
| _Roll_RA | 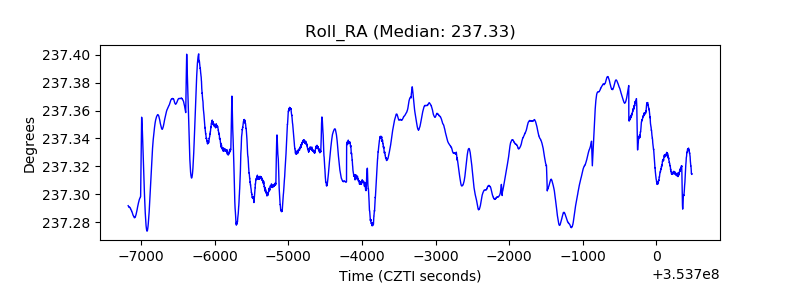 |
| Veto Counter | 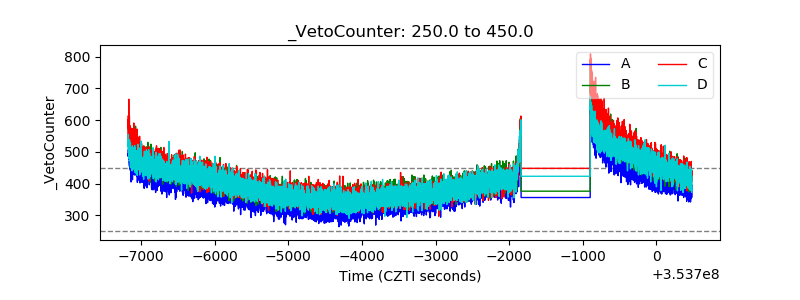 |