| Param | Original file | Final file |
|---|---|---|
| Filename | modeM0/AS1C05_019T01_9000004264_29568cztM0_level2.evt | modeM0/AS1C05_019T01_9000004264_29568cztM0_level2_quad_clean.evt |
| Size (bytes) | 500,192,640 | 114,894,720 |
| Size | 477.0 MB | 109.6 MB |
| Events in quadrant A | 3,125,333 | 768,974 |
| Events in quadrant B | 3,209,760 | 789,863 |
| Events in quadrant C | 3,514,154 | 730,000 |
| Events in quadrant D | 4,854,308 | 734,282 |
| Mode SS | |||
|---|---|---|---|
| Quadrant | BADHDUFLAG | Total packets | Discarded packets |
| A | 0 | 134 | 0 |
| B | 0 | 134 | 0 |
| C | 0 | 134 | 0 |
| D | 0 | 134 | 0 |
| Mode M0 | |||
|---|---|---|---|
| Quadrant | BADHDUFLAG | Total packets | Discarded packets |
| A | 0 | 13758 | 2 |
| B | 0 | 13945 | 2 |
| C | 0 | 14777 | 2 |
| D | 0 | 18954 | 2 |
| Mode M9 | |||
|---|---|---|---|
| Quadrant | BADHDUFLAG | Total packets | Discarded packets |
| A | 0 | 10 | 0 |
| B | 0 | 10 | 0 |
| C | 0 | 10 | 0 |
| D | 0 | 10 | 0 |
| Quadrant | Total seconds | Saturated seconds | Saturation percentage |
|---|---|---|---|
| A | 6540 | 49 | 0.749235% |
| B | 6541 | 63 | 0.963155% |
| C | 6541 | 695 | 10.625287% |
| D | 6541 | 311 | 4.754625% |
Noise dominated data is calculated using 1-second bins in cleaned event files. If a bin has >2000 counts, and if more than 50% of those come from <1% of pixels, then it is considered to be noise-dominated and hence unusable.
| Quadrant | # 1 sec bins | Bins with >0 counts | Bins with >2000 counts | High rate bins dominated by noise | Noise dominated (total time) | Noise dominated (detector-on time) | Marked lightcurve |
|---|---|---|---|---|---|---|---|
| A | 7585 | 6541 | 0 | 0 | 0.00% | 0.00% | 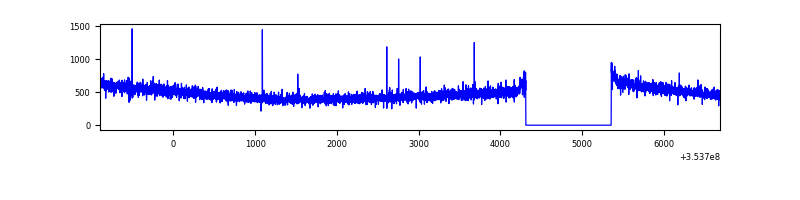 |
| B | 7586 | 6542 | 1 | 1 | 0.01% | 0.02% | 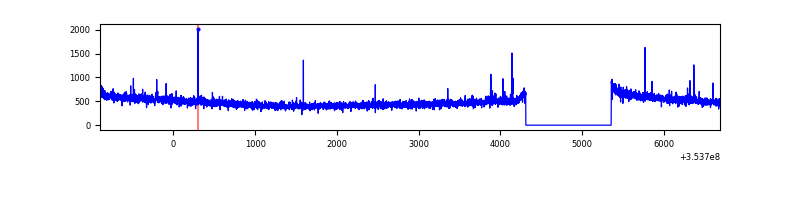 |
| C | 7586 | 6541 | 0 | 0 | 0.00% | 0.00% | 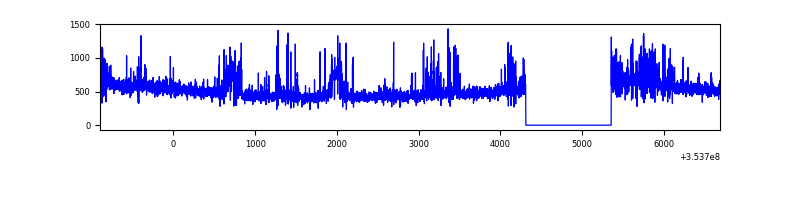 |
| D | 7586 | 6542 | 136 | 136 | 1.79% | 2.08% | 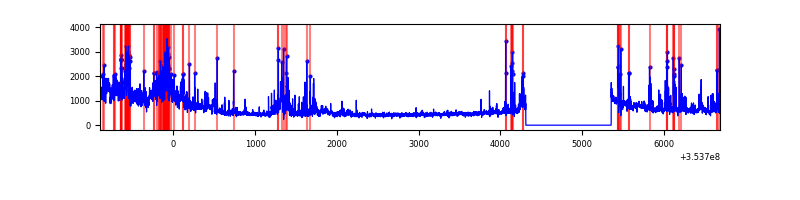 |
Top three noisy pixels from each quadrant. If the there are fewer than three noisy pixels in the level2.evt file, extra rows are filled as -1
| Pixel properties | Quadrant properties | ||||||
|---|---|---|---|---|---|---|---|
| Quadrant | DetID | PixID | Counts | Sigma | Mean | Median | Sigma |
| A | 13 | 254 | 12236 | 70.55 | 807 | 790 | 162.2 |
| A | 3 | 137 | 7995 | 44.41 | 807 | 790 | 162.2 |
| A | 0 | 13 | 7652 | 42.3 | 807 | 790 | 162.2 |
| B | 0 | 190 | 28698 | 182.23 | 808 | 786 | 153.2 |
| B | 12 | 111 | 18550 | 115.98 | 808 | 786 | 153.2 |
| B | 11 | 111 | 16859 | 104.94 | 808 | 786 | 153.2 |
| C | 14 | 238 | 297291 | 1684.05 | 753 | 756 | 176.1 |
| C | 14 | 254 | 247344 | 1400.4 | 753 | 756 | 176.1 |
| C | 2 | 114 | 15139 | 81.68 | 753 | 756 | 176.1 |
| D | 12 | 33 | 630821 | 3366.48 | 781 | 759 | 187.2 |
| D | 8 | 195 | 446673 | 2382.56 | 781 | 759 | 187.2 |
| D | 13 | 153 | 417053 | 2224.3 | 781 | 759 | 187.2 |
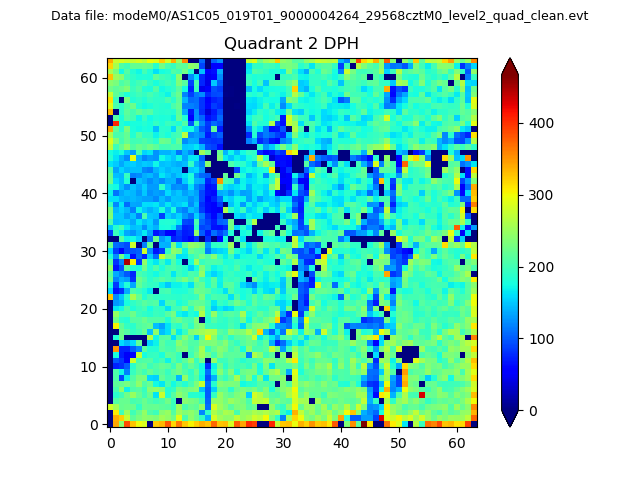
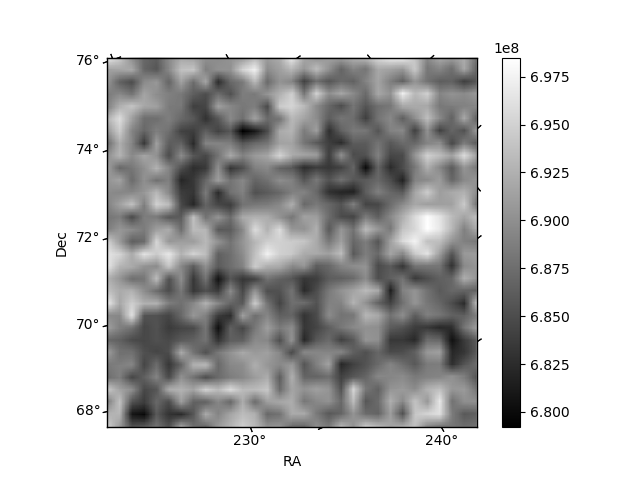
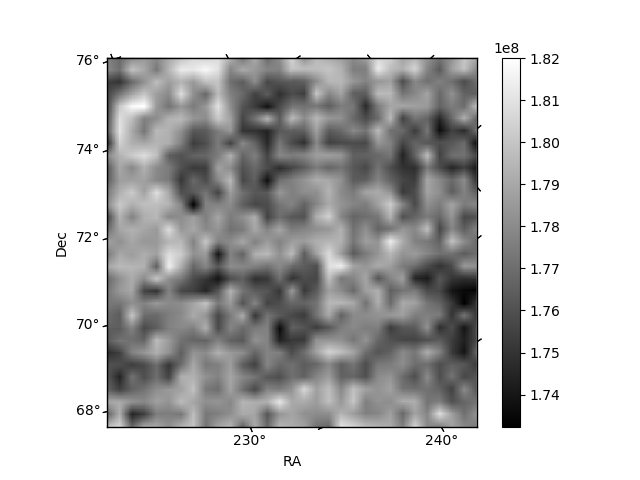
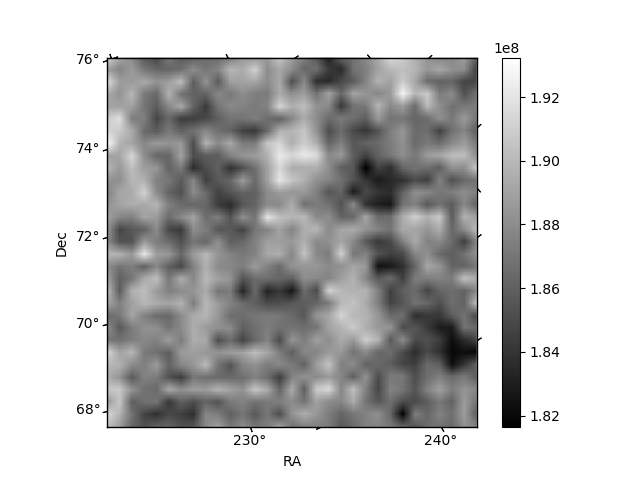
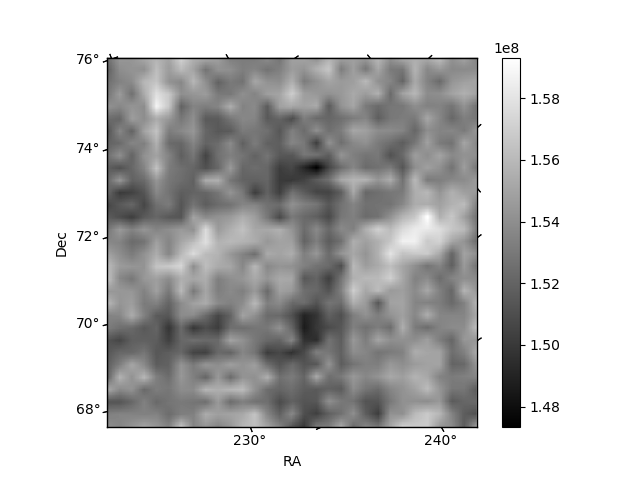
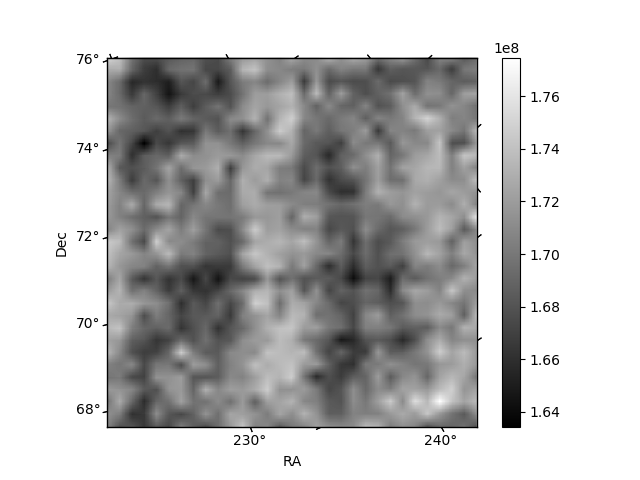
Histogram calculated using DETX and DETY for each event in the final _common_clean file
| Quadrant A | 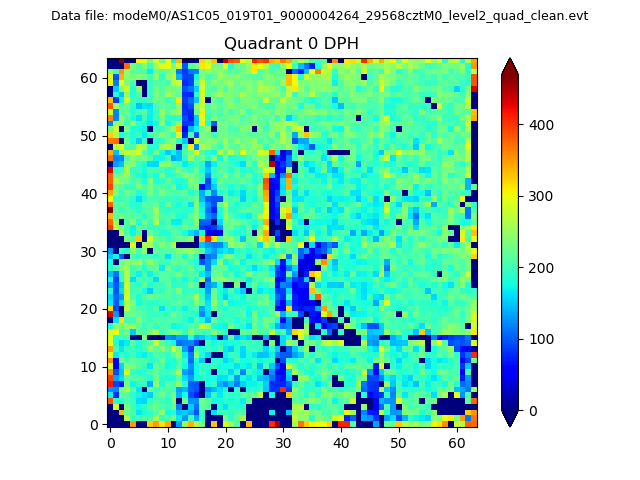 |
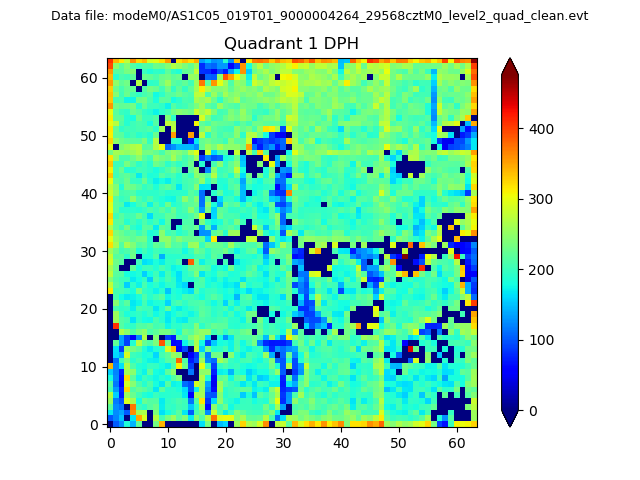 |
Quadrant B |
|---|---|---|---|
| Quadrant D | 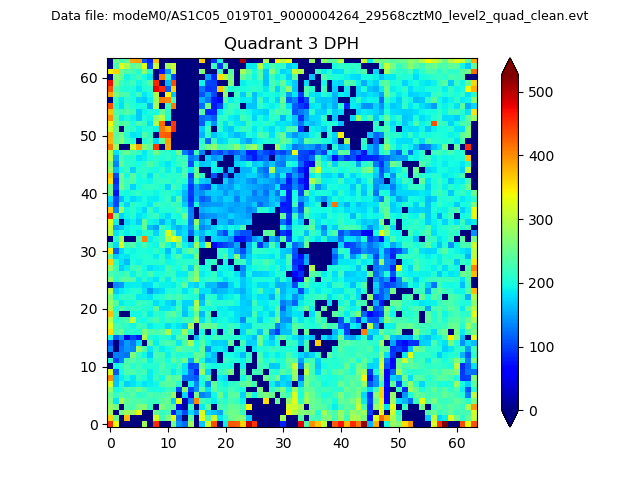 |
 |
Quadrant C |
| Plot type | Count rate plots | Images |
|---|---|---|
| Comparison with Poisson distribution Blue bars denote a histogram of data divided into 1 sec bins. Red curve is a Poisson curve with rate = median count rate of data. |
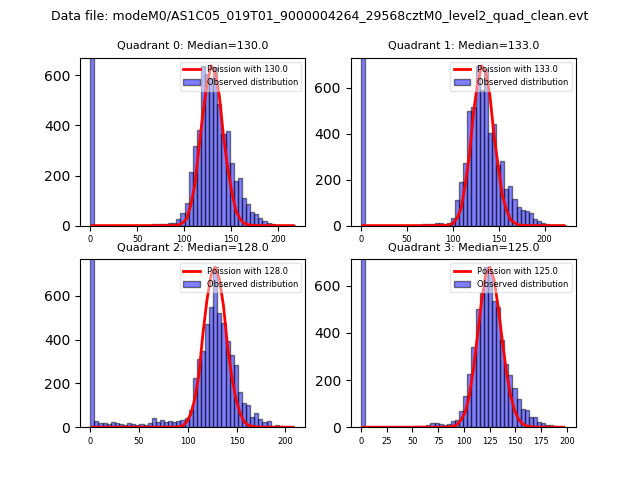 |
 |
| Quadrant-wise count rates Data is divided into 100 sec bins |
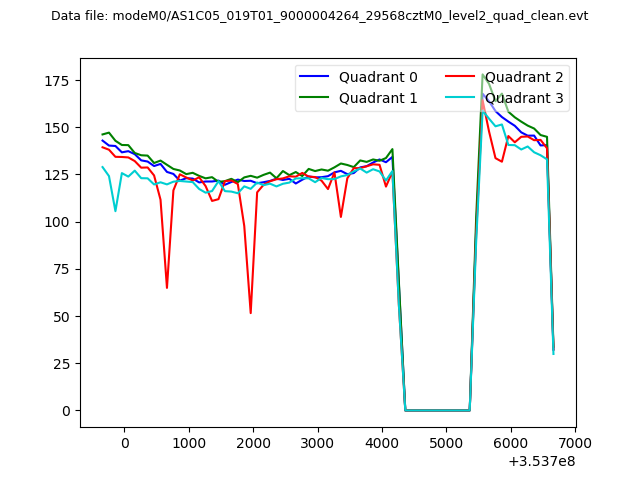 |
|
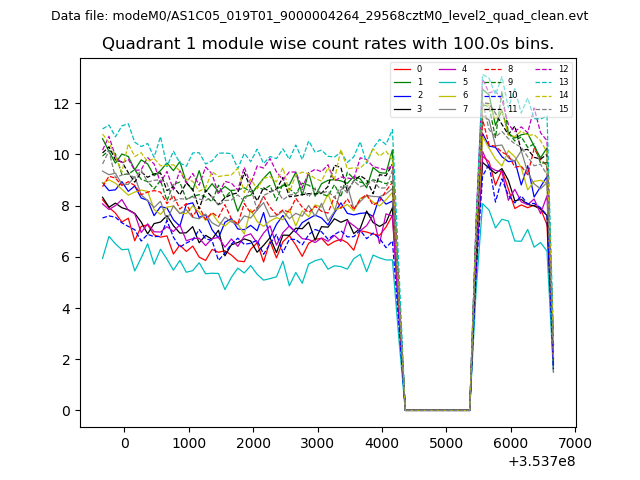
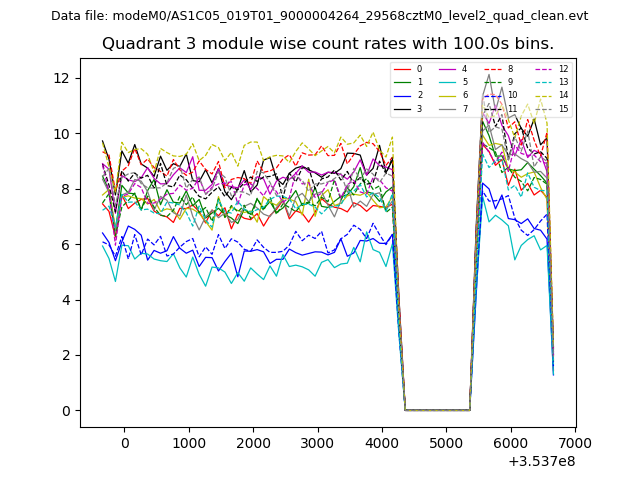
| Module-wise count rates for Quadrant A Data is divided into 100 sec bins |
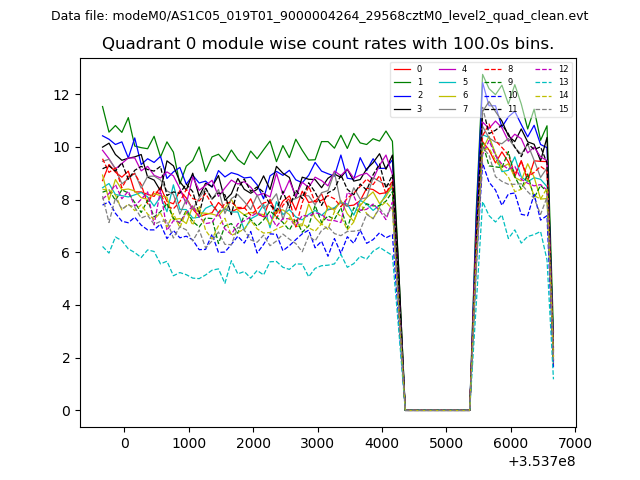 |
 |
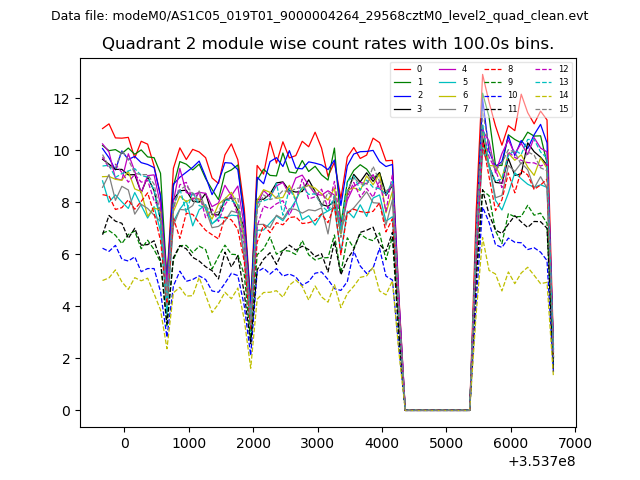
| Module-wise count rates for Quadrant B Data is divided into 100 sec bins |
 |
 |
| Module-wise count rates for Quadrant C Data is divided into 100 sec bins |
 |
 |
| Module-wise count rates for Quadrant D Data is divided into 100 sec bins |
 |
 |
| Parameter | Plot |
|---|---|
| CZT HV Monitor | 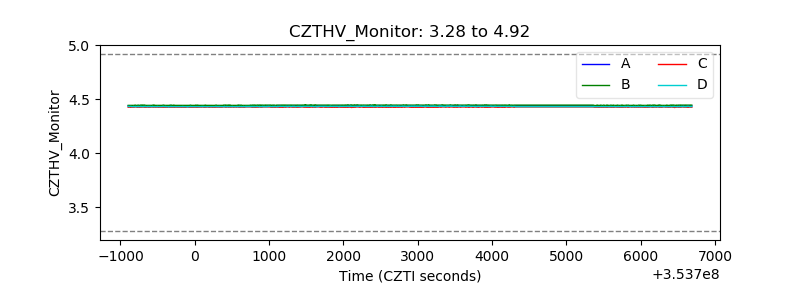 |
| D_VDD | 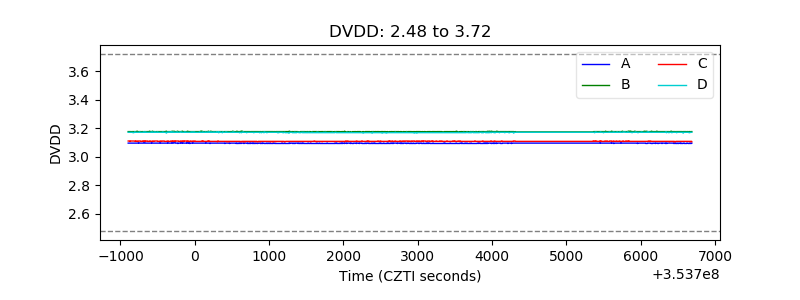 |
| Temperature 1 | 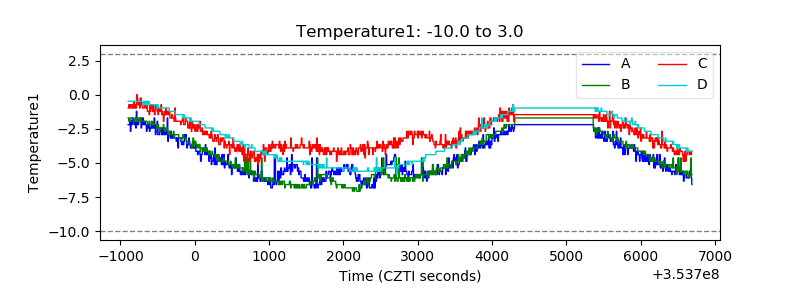 |
| Veto HV Monitor | 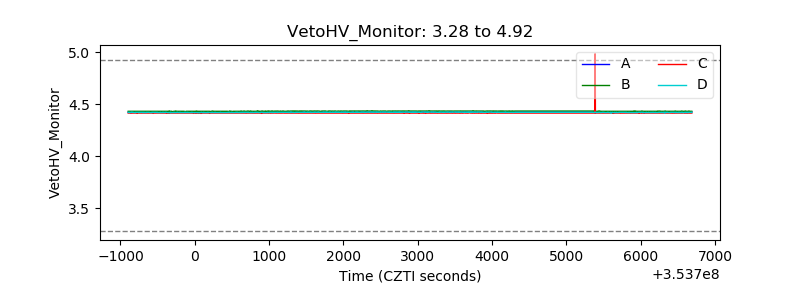 |
| Veto LLD | 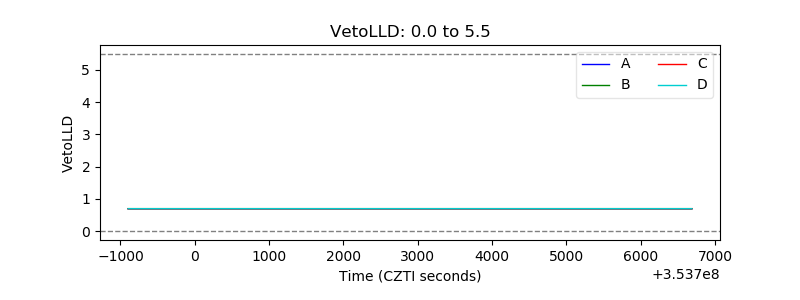 |
| Alpha Counter | 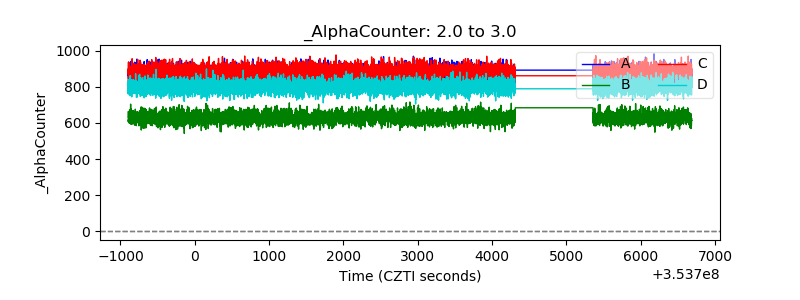 |
| _CPM_Rate | 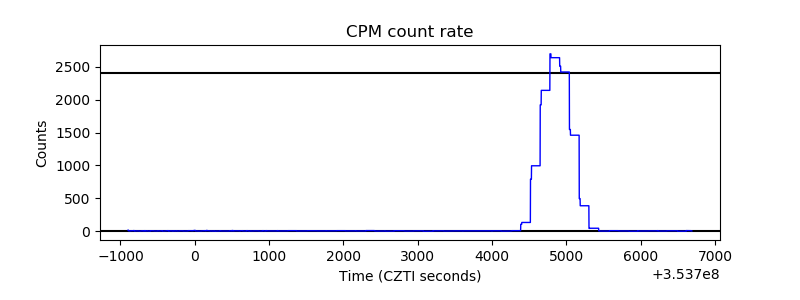 |
| CZT Counter | 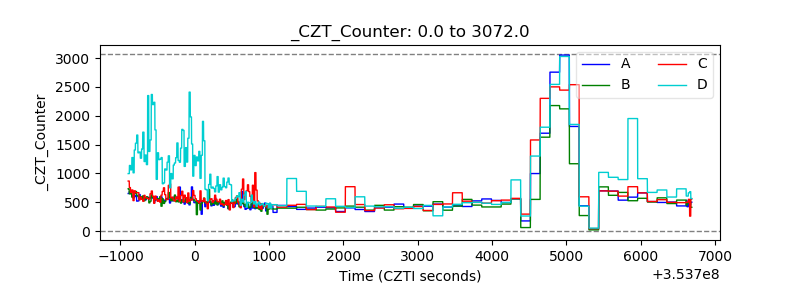 |
| +2.5 Volts monitor |  |
| +5 Volts monitor | 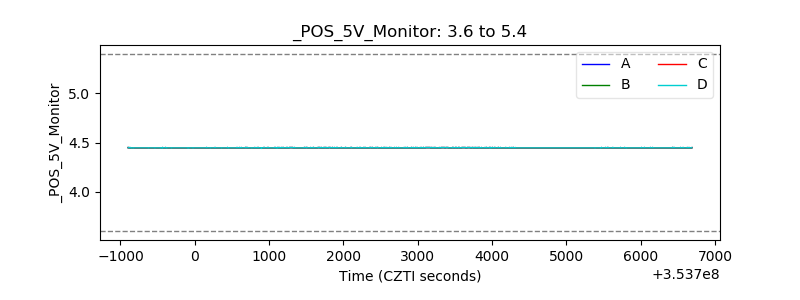 |
| _ROLL_ROT | 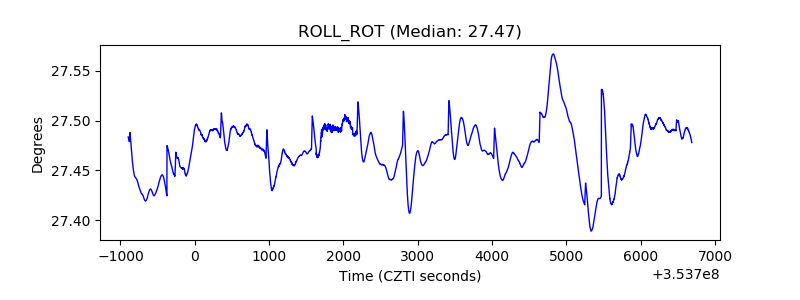 |
| _Roll_DEC | 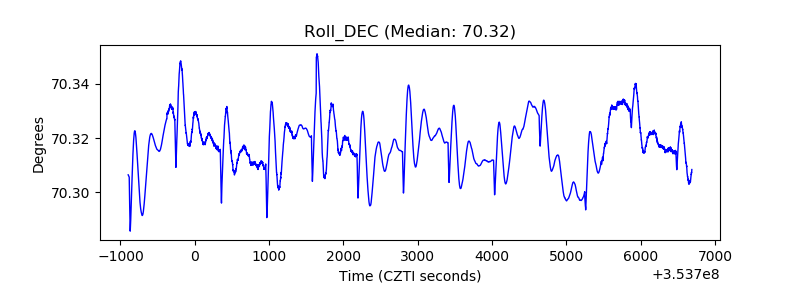 |
| _Roll_RA | 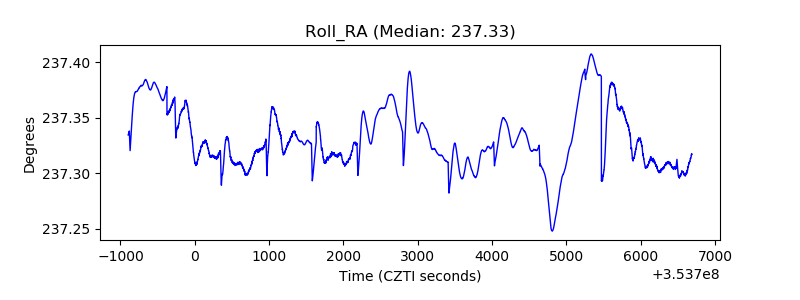 |
| Veto Counter | 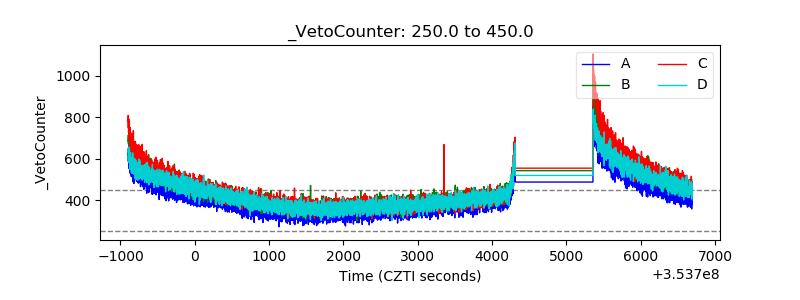 |