| Param | Original file | Final file |
|---|---|---|
| Filename | modeM0/AS1C05_019T01_9000004264_29570cztM0_level2.evt | modeM0/AS1C05_019T01_9000004264_29570cztM0_level2_quad_clean.evt |
| Size (bytes) | 498,810,240 | 126,840,960 |
| Size | 475.7 MB | 121.0 MB |
| Events in quadrant A | 3,164,810 | 853,981 |
| Events in quadrant B | 3,352,145 | 886,835 |
| Events in quadrant C | 3,478,040 | 837,782 |
| Events in quadrant D | 4,673,107 | 812,703 |
| Mode SS | |||
|---|---|---|---|
| Quadrant | BADHDUFLAG | Total packets | Discarded packets |
| A | 0 | 134 | 0 |
| B | 0 | 134 | 0 |
| C | 0 | 134 | 0 |
| D | 0 | 134 | 0 |
| Mode M0 | |||
|---|---|---|---|
| Quadrant | BADHDUFLAG | Total packets | Discarded packets |
| A | 0 | 13798 | 2 |
| B | 0 | 14356 | 3 |
| C | 0 | 14684 | 2 |
| D | 0 | 18381 | 2 |
| Mode M9 | |||
|---|---|---|---|
| Quadrant | BADHDUFLAG | Total packets | Discarded packets |
| A | 0 | 22 | 0 |
| B | 0 | 22 | 0 |
| C | 0 | 22 | 0 |
| D | 0 | 22 | 0 |
| Quadrant | Total seconds | Saturated seconds | Saturation percentage |
|---|---|---|---|
| A | 6453 | 60 | 0.929800% |
| B | 6452 | 94 | 1.456913% |
| C | 6452 | 512 | 7.935524% |
| D | 6452 | 216 | 3.347799% |
Noise dominated data is calculated using 1-second bins in cleaned event files. If a bin has >2000 counts, and if more than 50% of those come from <1% of pixels, then it is considered to be noise-dominated and hence unusable.
| Quadrant | # 1 sec bins | Bins with >0 counts | Bins with >2000 counts | High rate bins dominated by noise | Noise dominated (total time) | Noise dominated (detector-on time) | Marked lightcurve |
|---|---|---|---|---|---|---|---|
| A | 8698 | 6455 | 0 | 0 | 0.00% | 0.00% | 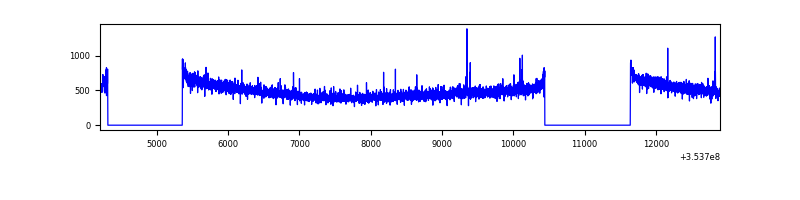 |
| B | 8697 | 6453 | 7 | 7 | 0.08% | 0.11% | 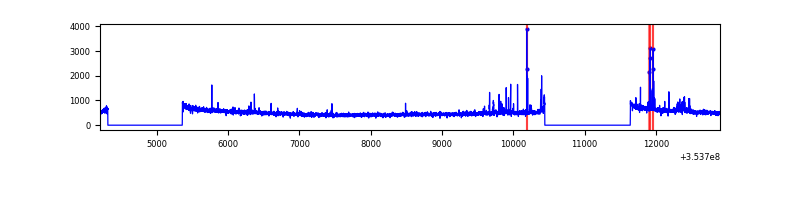 |
| C | 8697 | 6453 | 0 | 0 | 0.00% | 0.00% | 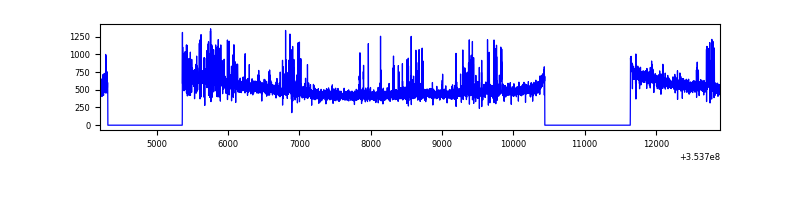 |
| D | 8697 | 6454 | 117 | 117 | 1.35% | 1.81% | 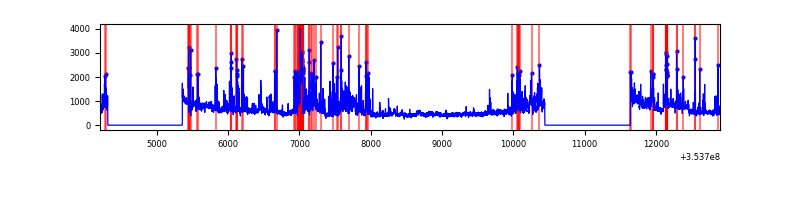 |
Top three noisy pixels from each quadrant. If the there are fewer than three noisy pixels in the level2.evt file, extra rows are filled as -1
| Pixel properties | Quadrant properties | ||||||
|---|---|---|---|---|---|---|---|
| Quadrant | DetID | PixID | Counts | Sigma | Mean | Median | Sigma |
| A | 0 | 13 | 20568 | 121.67 | 814 | 797 | 162.5 |
| A | 13 | 254 | 12330 | 70.98 | 814 | 797 | 162.5 |
| A | 3 | 137 | 7788 | 43.02 | 814 | 797 | 162.5 |
| B | 0 | 229 | 39640 | 254.32 | 820 | 801 | 152.7 |
| B | 0 | 189 | 30715 | 195.88 | 820 | 801 | 152.7 |
| B | 0 | 190 | 28191 | 179.35 | 820 | 801 | 152.7 |
| C | 14 | 238 | 239970 | 1318.54 | 783 | 789 | 181.4 |
| C | 14 | 254 | 156661 | 859.28 | 783 | 789 | 181.4 |
| C | 2 | 114 | 14980 | 78.23 | 783 | 789 | 181.4 |
| D | 8 | 195 | 455142 | 2433.45 | 790 | 770 | 186.7 |
| D | 13 | 153 | 443982 | 2373.68 | 790 | 770 | 186.7 |
| D | 13 | 104 | 421320 | 2252.31 | 790 | 770 | 186.7 |
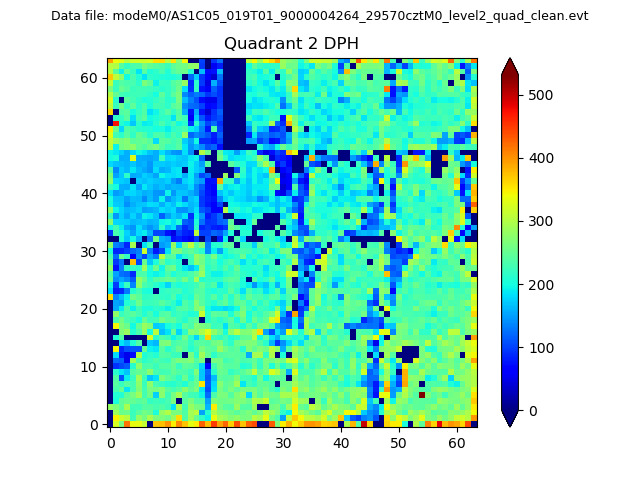
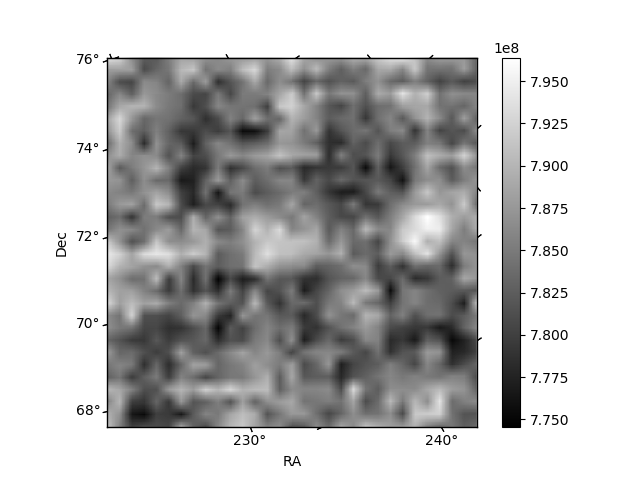
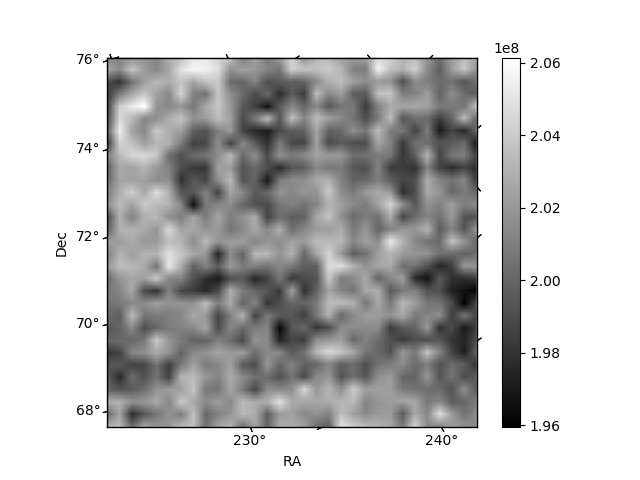
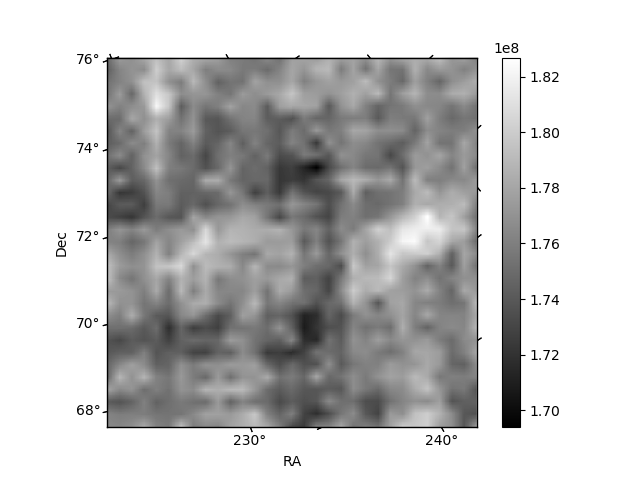
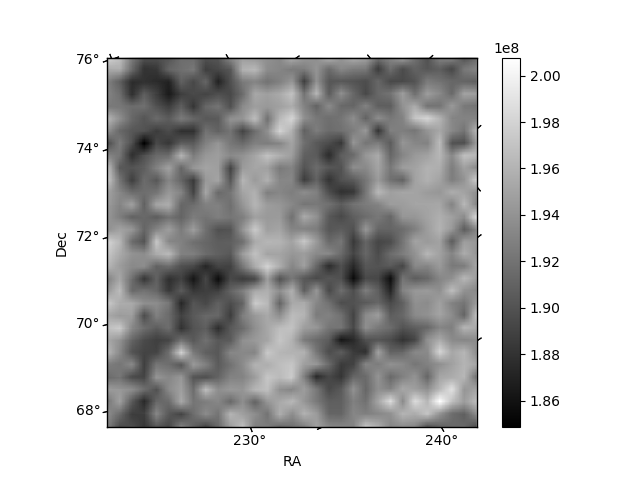
Histogram calculated using DETX and DETY for each event in the final _common_clean file
| Quadrant A | 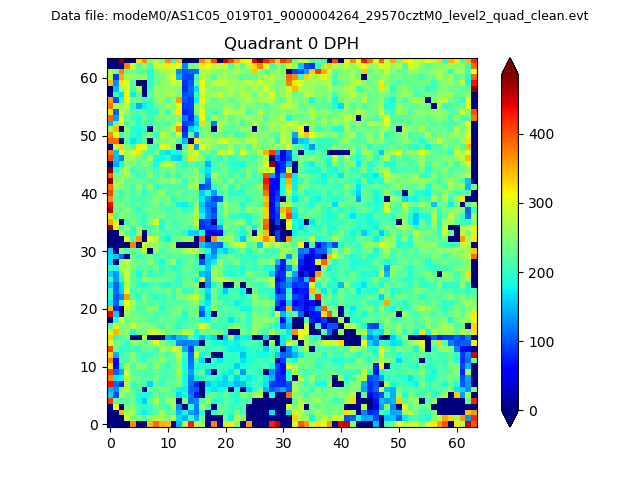 |
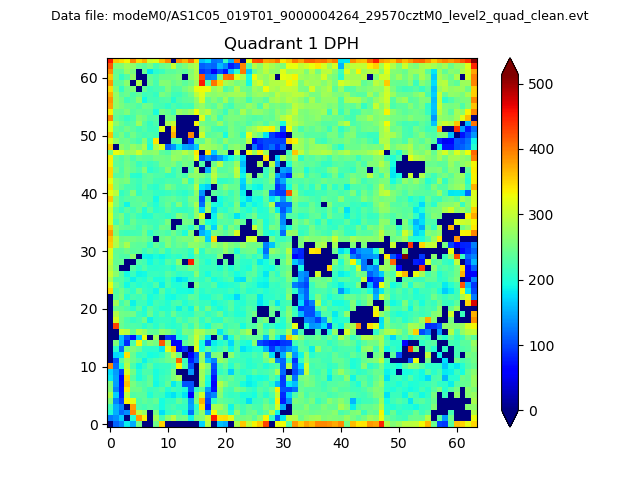 |
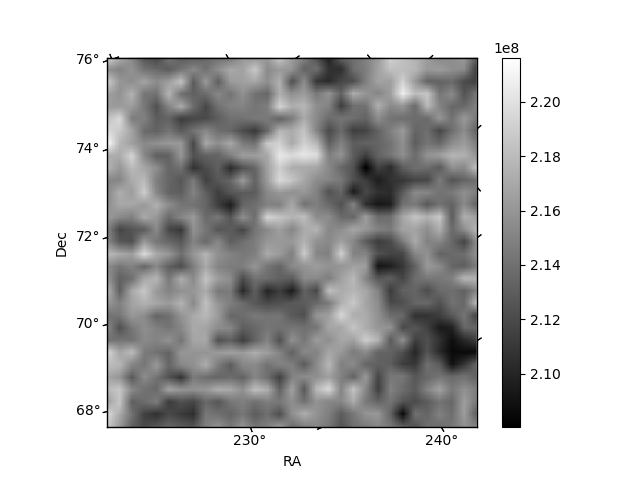
Quadrant B |
|---|---|---|---|
| Quadrant D | 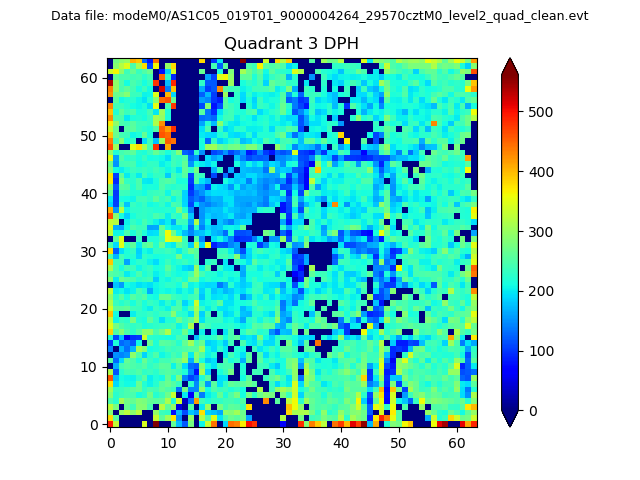 |
 |
Quadrant C |
| Plot type | Count rate plots | Images |
|---|---|---|
| Comparison with Poisson distribution Blue bars denote a histogram of data divided into 1 sec bins. Red curve is a Poisson curve with rate = median count rate of data. |
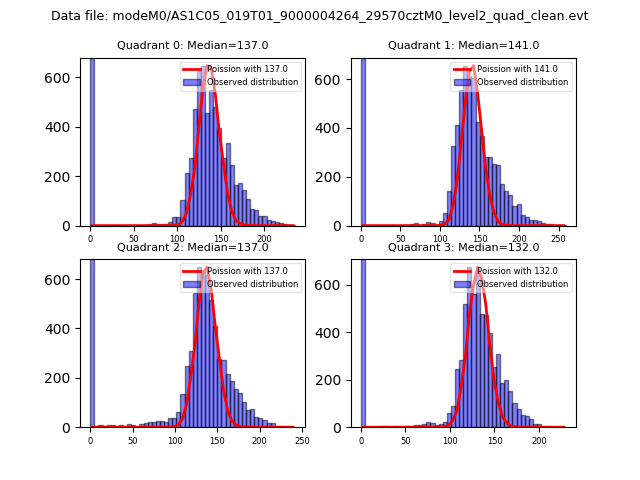 |
 |
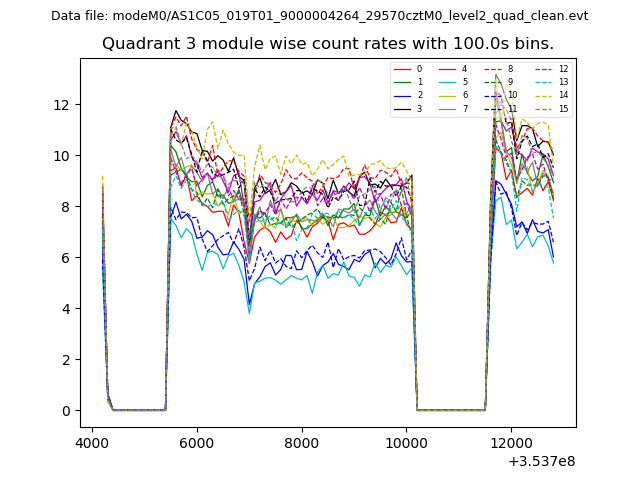
| Quadrant-wise count rates Data is divided into 100 sec bins |
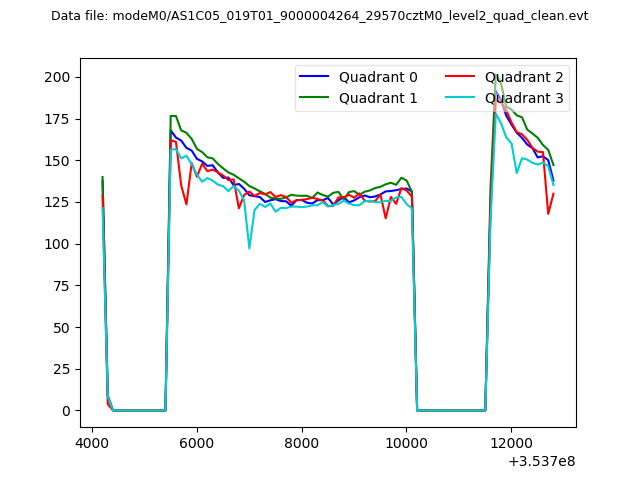 |
|
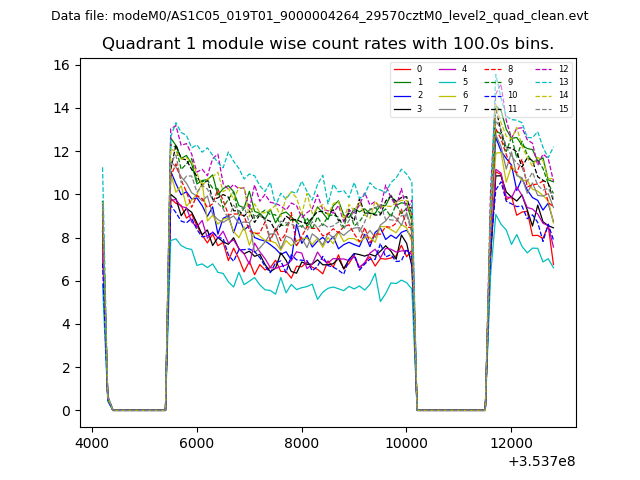
| Module-wise count rates for Quadrant A Data is divided into 100 sec bins |
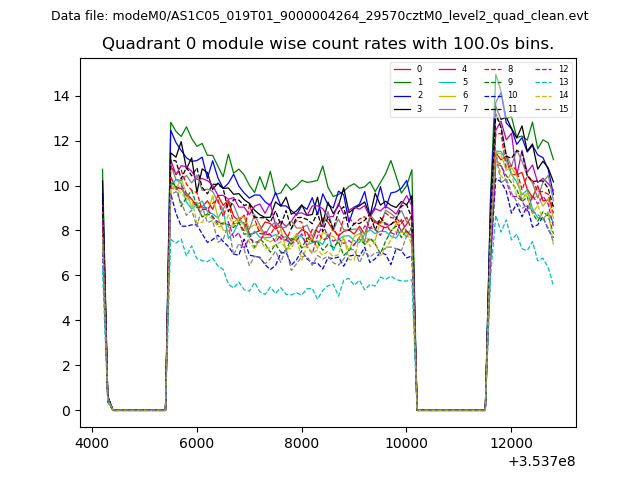 |
 |
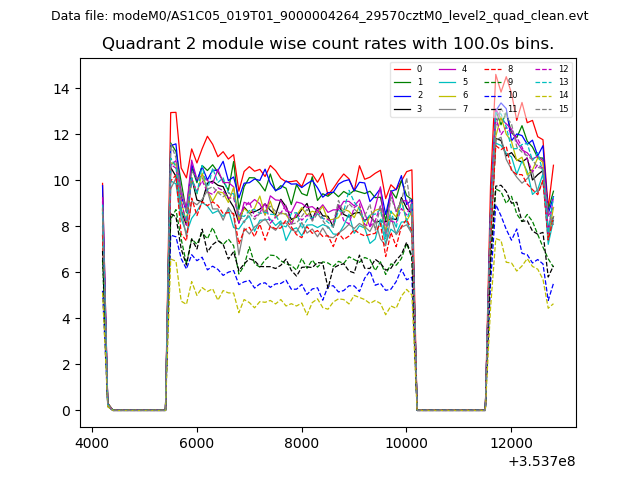
| Module-wise count rates for Quadrant B Data is divided into 100 sec bins |
 |
 |
| Module-wise count rates for Quadrant C Data is divided into 100 sec bins |
 |
 |
| Module-wise count rates for Quadrant D Data is divided into 100 sec bins |
 |
 |
| Parameter | Plot |
|---|---|
| CZT HV Monitor | 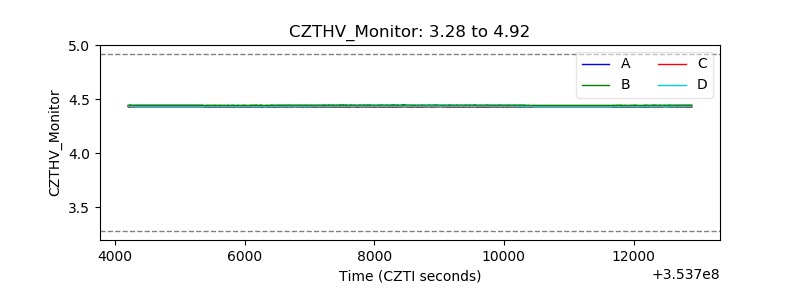 |
| D_VDD | 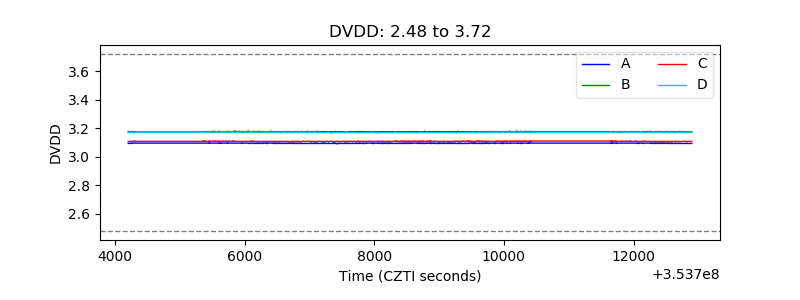 |
| Temperature 1 | 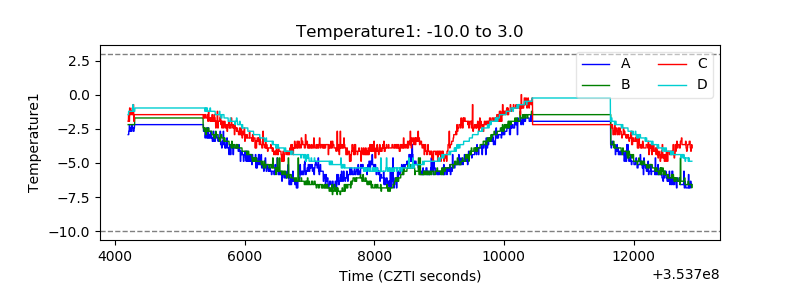 |
| Veto HV Monitor | 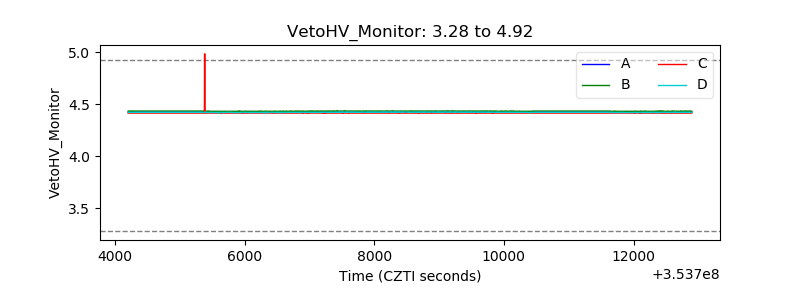 |
| Veto LLD | 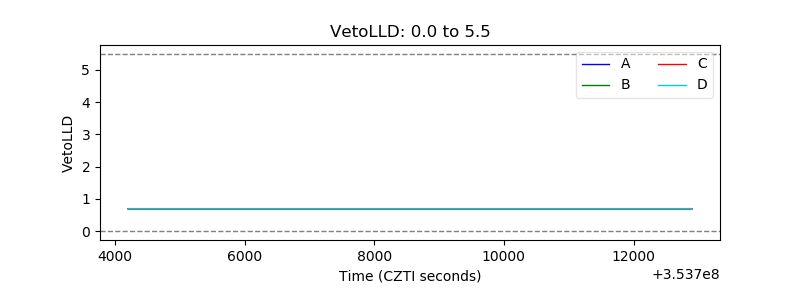 |
| Alpha Counter | 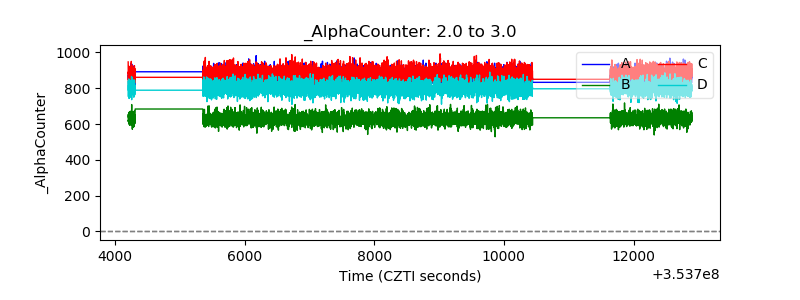 |
| _CPM_Rate | 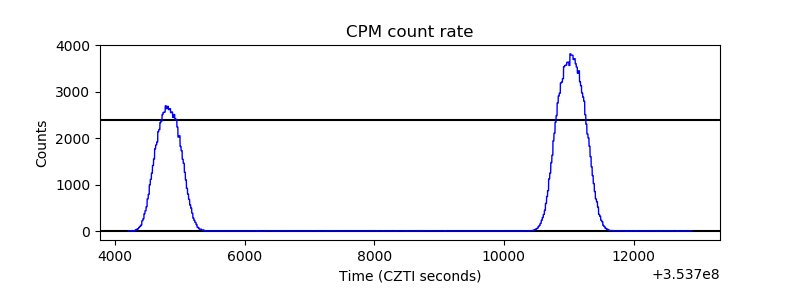 |
| CZT Counter | 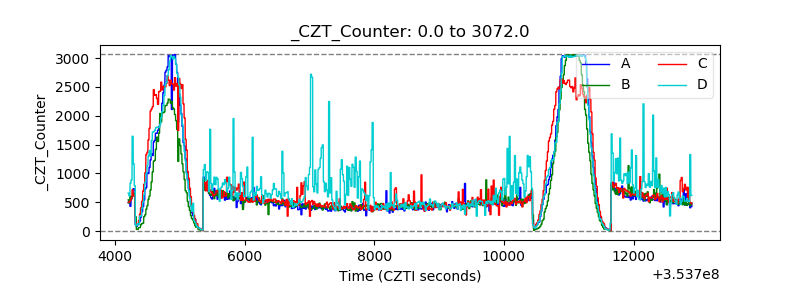 |
| +2.5 Volts monitor |  |
| +5 Volts monitor |  |
| _ROLL_ROT | 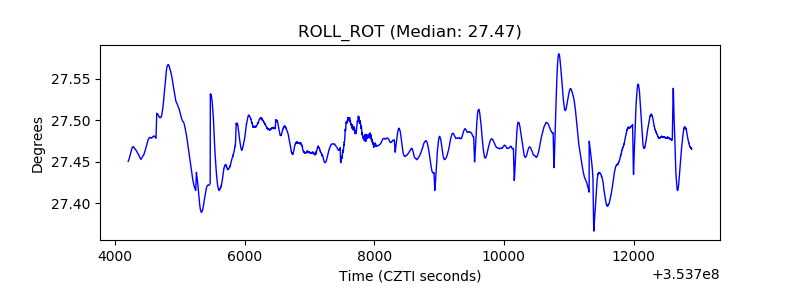 |
| _Roll_DEC | 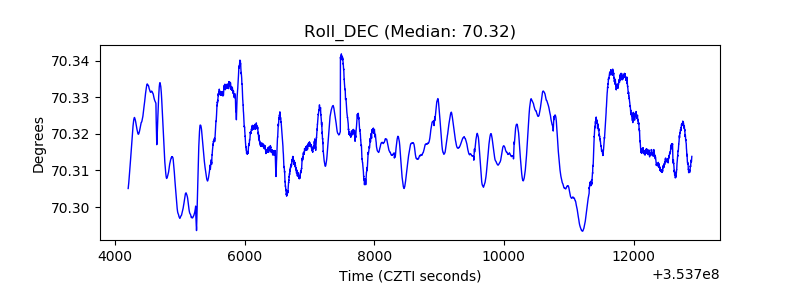 |
| _Roll_RA | 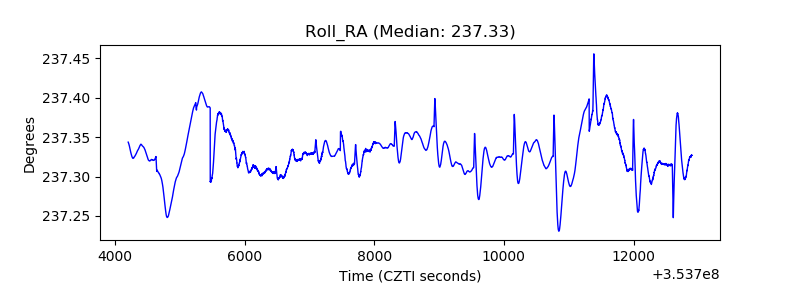 |
| Veto Counter |  |