| Param | Original file | Final file |
|---|---|---|
| Filename | modeM0/AS1C05_019T01_9000004264_29571cztM0_level2.evt | modeM0/AS1C05_019T01_9000004264_29571cztM0_level2_quad_clean.evt |
| Size (bytes) | 477,034,560 | 123,981,120 |
| Size | 454.9 MB | 118.2 MB |
| Events in quadrant A | 3,062,209 | 828,325 |
| Events in quadrant B | 3,328,204 | 869,276 |
| Events in quadrant C | 3,266,776 | 835,672 |
| Events in quadrant D | 4,370,481 | 790,521 |
| Mode SS | |||
|---|---|---|---|
| Quadrant | BADHDUFLAG | Total packets | Discarded packets |
| A | 0 | 128 | 0 |
| B | 0 | 128 | 0 |
| C | 0 | 128 | 0 |
| D | 0 | 128 | 0 |
| Mode M0 | |||
|---|---|---|---|
| Quadrant | BADHDUFLAG | Total packets | Discarded packets |
| A | 0 | 13189 | 2 |
| B | 0 | 14056 | 2 |
| C | 0 | 13791 | 2 |
| D | 0 | 17307 | 2 |
| Mode M9 | |||
|---|---|---|---|
| Quadrant | BADHDUFLAG | Total packets | Discarded packets |
| A | 0 | 25 | 0 |
| B | 0 | 25 | 0 |
| C | 0 | 25 | 0 |
| D | 0 | 25 | 0 |
| Quadrant | Total seconds | Saturated seconds | Saturation percentage |
|---|---|---|---|
| A | 6177 | 27 | 0.437105% |
| B | 6178 | 64 | 1.035934% |
| C | 6178 | 196 | 3.172548% |
| D | 6177 | 176 | 2.849280% |
Noise dominated data is calculated using 1-second bins in cleaned event files. If a bin has >2000 counts, and if more than 50% of those come from <1% of pixels, then it is considered to be noise-dominated and hence unusable.
| Quadrant | # 1 sec bins | Bins with >0 counts | Bins with >2000 counts | High rate bins dominated by noise | Noise dominated (total time) | Noise dominated (detector-on time) | Marked lightcurve |
|---|---|---|---|---|---|---|---|
| A | 8697 | 6179 | 0 | 0 | 0.00% | 0.00% | 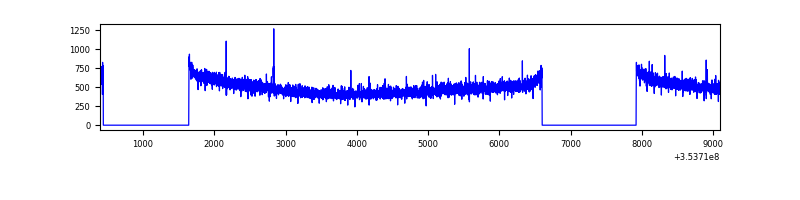 |
| B | 8698 | 6179 | 8 | 8 | 0.09% | 0.13% | 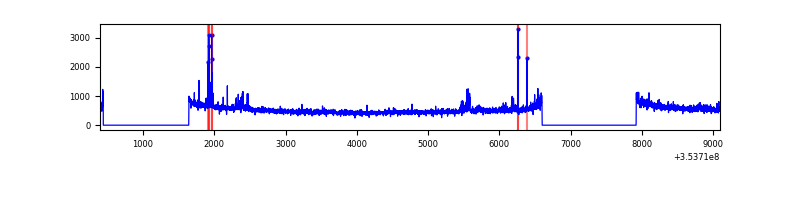 |
| C | 8698 | 6180 | 0 | 0 | 0.00% | 0.00% | 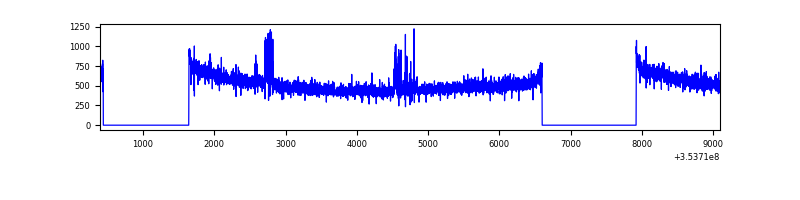 |
| D | 8697 | 6179 | 99 | 99 | 1.14% | 1.60% | 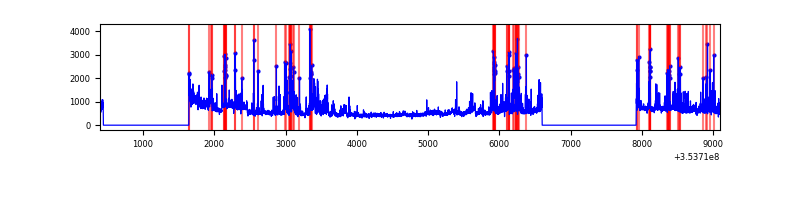 |
Top three noisy pixels from each quadrant. If the there are fewer than three noisy pixels in the level2.evt file, extra rows are filled as -1
| Pixel properties | Quadrant properties | ||||||
|---|---|---|---|---|---|---|---|
| Quadrant | DetID | PixID | Counts | Sigma | Mean | Median | Sigma |
| A | 13 | 254 | 11989 | 71.66 | 791 | 777 | 156.5 |
| A | 3 | 137 | 7342 | 41.96 | 791 | 777 | 156.5 |
| A | 0 | 13 | 7084 | 40.31 | 791 | 777 | 156.5 |
| B | 0 | 189 | 108335 | 731.55 | 800 | 780 | 147.0 |
| B | 0 | 190 | 39377 | 262.52 | 800 | 780 | 147.0 |
| B | 4 | 216 | 25102 | 165.43 | 800 | 780 | 147.0 |
| C | 14 | 238 | 160604 | 893.17 | 780 | 786 | 178.9 |
| C | 14 | 254 | 46600 | 256.04 | 780 | 786 | 178.9 |
| C | 2 | 114 | 14336 | 75.73 | 780 | 786 | 178.9 |
| D | 13 | 104 | 495188 | 2724.22 | 767 | 747 | 181.5 |
| D | 8 | 195 | 395729 | 2176.23 | 767 | 747 | 181.5 |
| D | 13 | 153 | 310168 | 1704.81 | 767 | 747 | 181.5 |
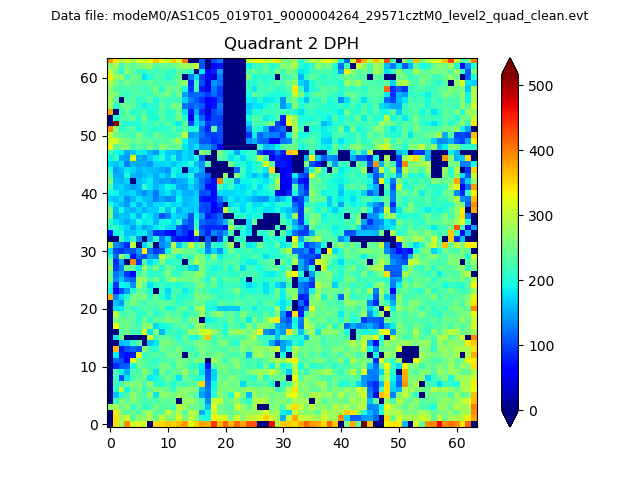
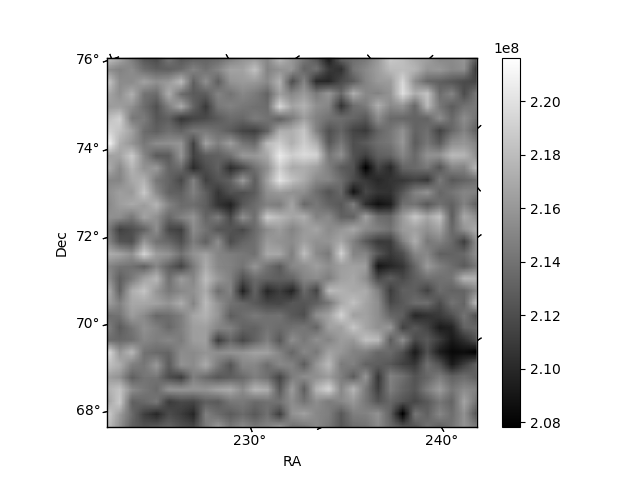
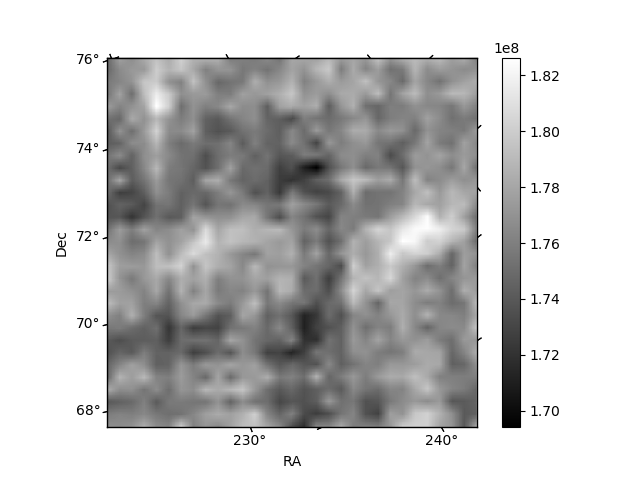
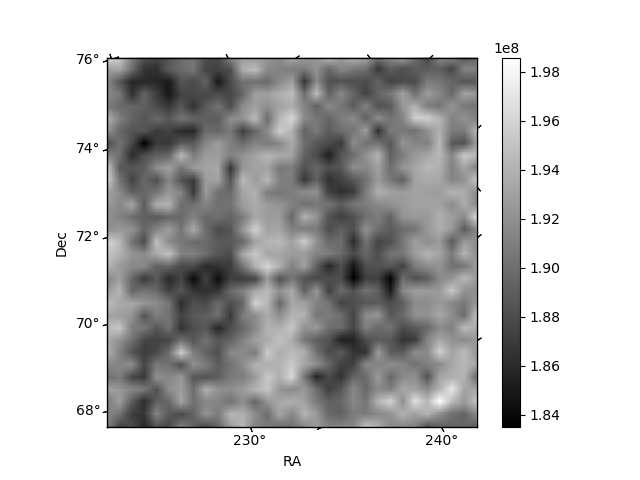
Histogram calculated using DETX and DETY for each event in the final _common_clean file
| Quadrant A | 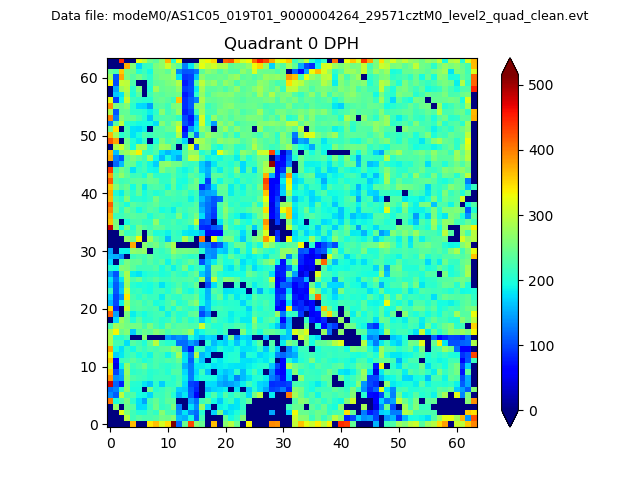 |
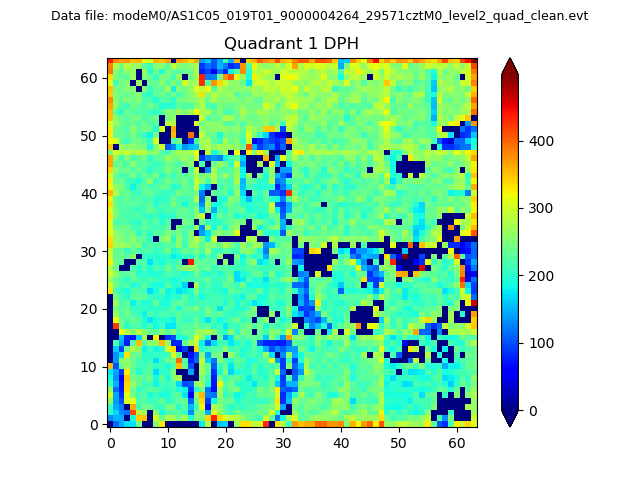 |
Quadrant B |
|---|---|---|---|
| Quadrant D | 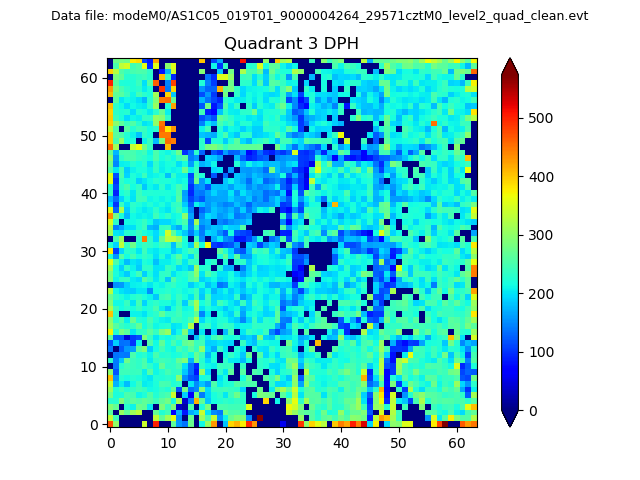 |
 |
Quadrant C |
| Plot type | Count rate plots | Images |
|---|---|---|
| Comparison with Poisson distribution Blue bars denote a histogram of data divided into 1 sec bins. Red curve is a Poisson curve with rate = median count rate of data. |
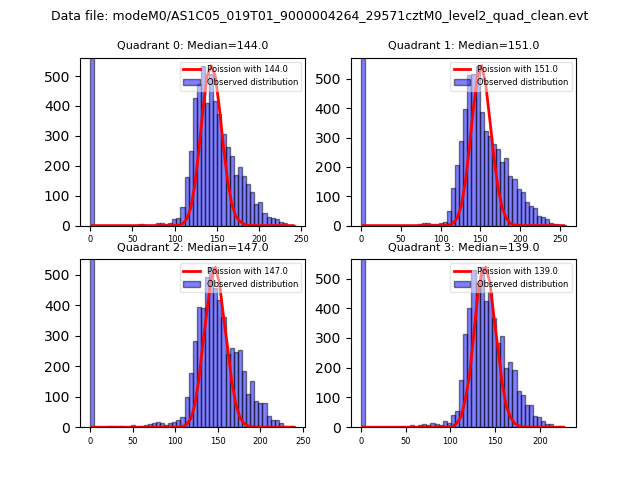 |
 |
| Quadrant-wise count rates Data is divided into 100 sec bins |
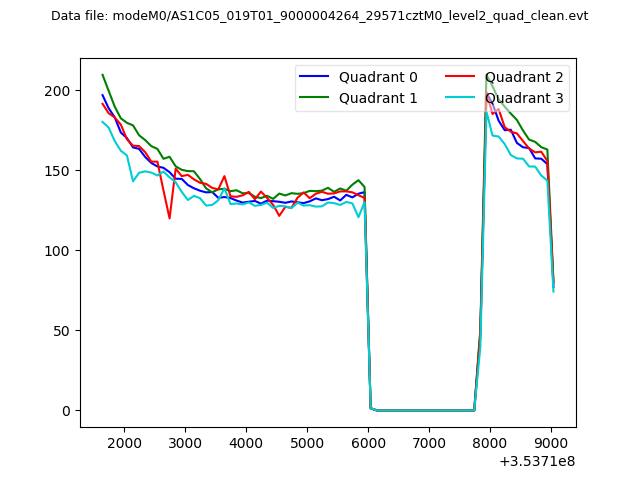 |
|
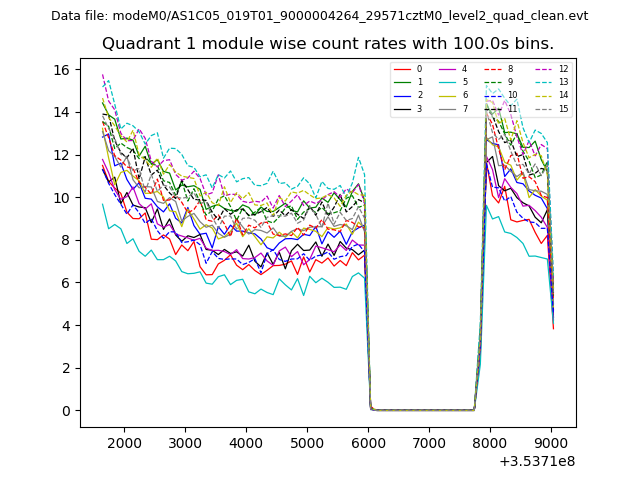
| Module-wise count rates for Quadrant A Data is divided into 100 sec bins |
 |
 |
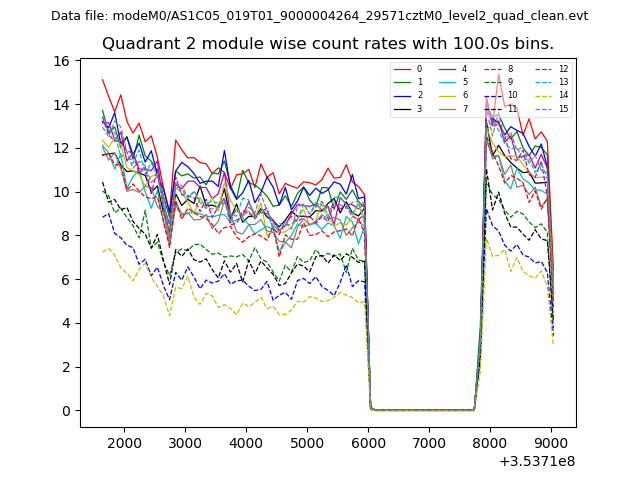
| Module-wise count rates for Quadrant B Data is divided into 100 sec bins |
 |
 |
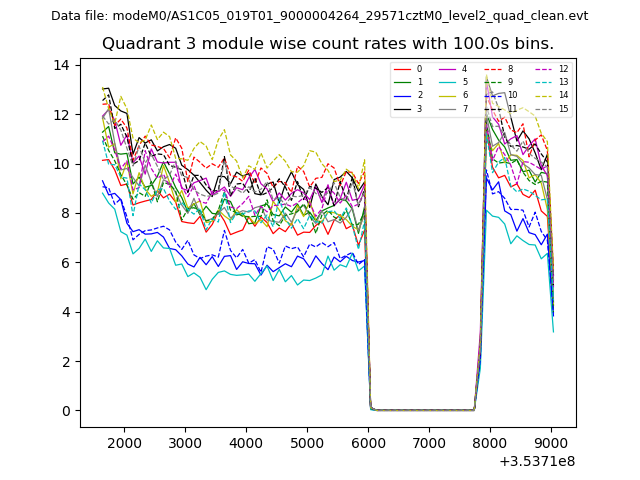
| Module-wise count rates for Quadrant C Data is divided into 100 sec bins |
 |
 |
| Module-wise count rates for Quadrant D Data is divided into 100 sec bins |
 |
 |
| Parameter | Plot |
|---|---|
| CZT HV Monitor |  |
| D_VDD | 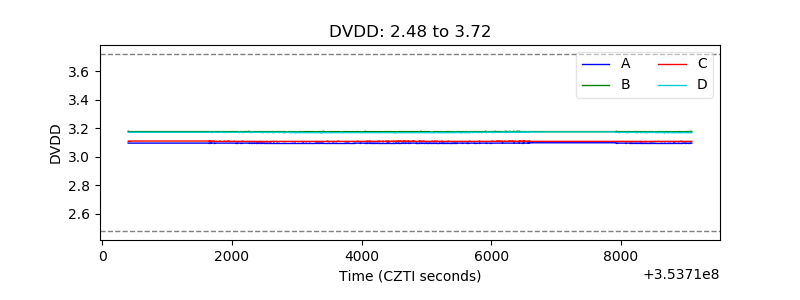 |
| Temperature 1 | 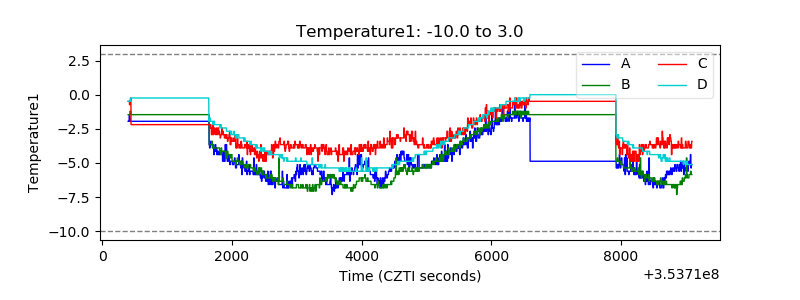 |
| Veto HV Monitor | 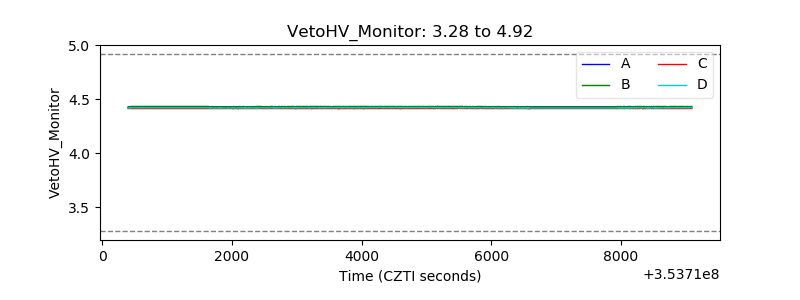 |
| Veto LLD |  |
| Alpha Counter | 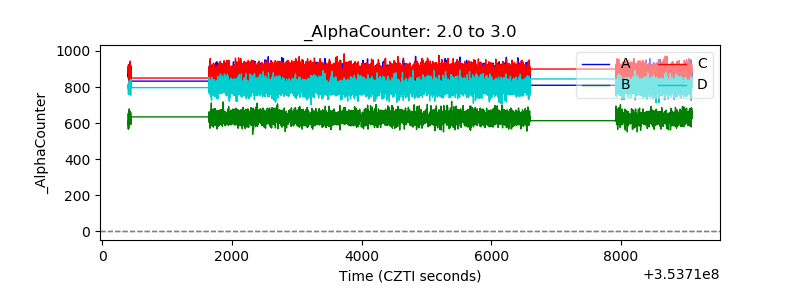 |
| _CPM_Rate | 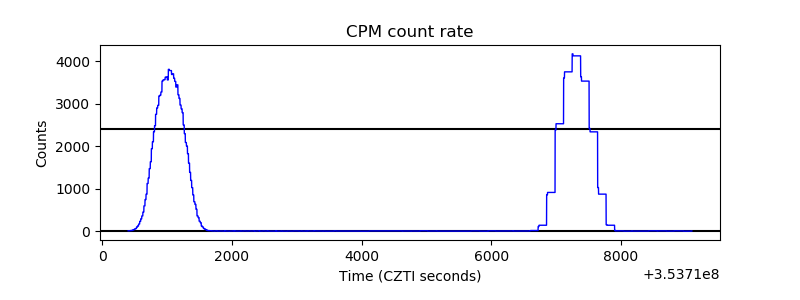 |
| CZT Counter | 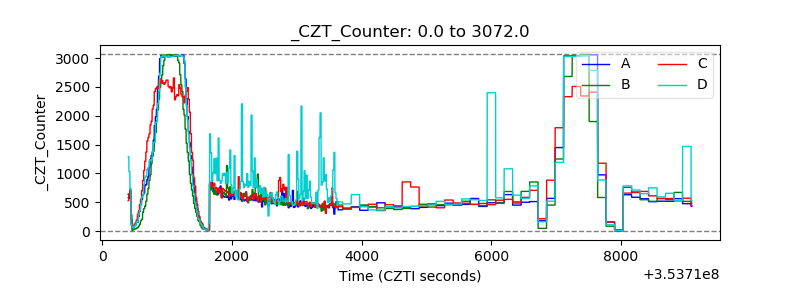 |
| +2.5 Volts monitor |  |
| +5 Volts monitor |  |
| _ROLL_ROT |  |
| _Roll_DEC | 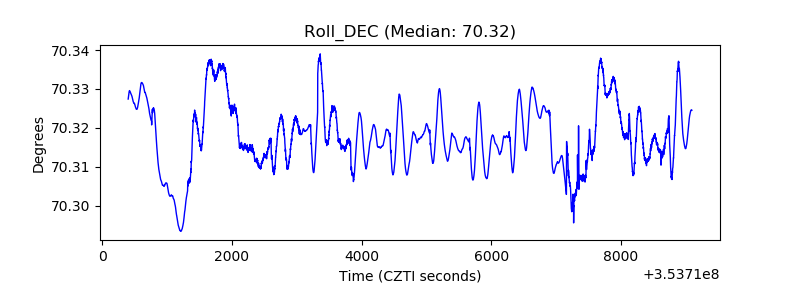 |
| _Roll_RA | 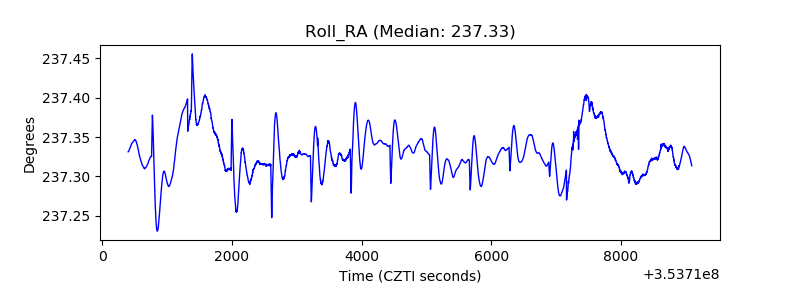 |
| Veto Counter | 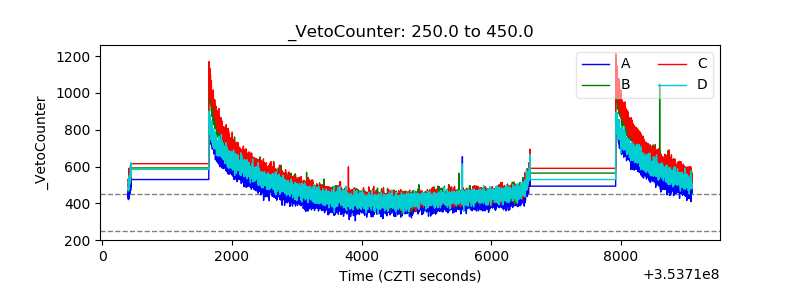 |