| Param | Original file | Final file |
|---|---|---|
| Filename | modeM0/AS1C05_019T01_9000004264_29573cztM0_level2.evt | modeM0/AS1C05_019T01_9000004264_29573cztM0_level2_quad_clean.evt |
| Size (bytes) | 514,232,640 | 117,336,960 |
| Size | 490.4 MB | 111.9 MB |
| Events in quadrant A | 3,141,305 | 788,830 |
| Events in quadrant B | 3,767,225 | 818,646 |
| Events in quadrant C | 3,722,013 | 754,110 |
| Events in quadrant D | 4,504,490 | 741,341 |
| Mode SS | |||
|---|---|---|---|
| Quadrant | BADHDUFLAG | Total packets | Discarded packets |
| A | 0 | 130 | 0 |
| B | 0 | 130 | 0 |
| C | 0 | 130 | 0 |
| D | 0 | 130 | 0 |
| Mode M0 | |||
|---|---|---|---|
| Quadrant | BADHDUFLAG | Total packets | Discarded packets |
| A | 0 | 13459 | 3 |
| B | 0 | 15322 | 2 |
| C | 0 | 15110 | 2 |
| D | 0 | 17909 | 2 |
| Mode M9 | |||
|---|---|---|---|
| Quadrant | BADHDUFLAG | Total packets | Discarded packets |
| A | 0 | 16 | 0 |
| B | 0 | 17 | 0 |
| C | 0 | 17 | 0 |
| D | 0 | 17 | 0 |
| Quadrant | Total seconds | Saturated seconds | Saturation percentage |
|---|---|---|---|
| A | 6465 | 21 | 0.324826% |
| B | 6465 | 64 | 0.989946% |
| C | 6465 | 539 | 8.337200% |
| D | 6465 | 187 | 2.892498% |
Noise dominated data is calculated using 1-second bins in cleaned event files. If a bin has >2000 counts, and if more than 50% of those come from <1% of pixels, then it is considered to be noise-dominated and hence unusable.
| Quadrant | # 1 sec bins | Bins with >0 counts | Bins with >2000 counts | High rate bins dominated by noise | Noise dominated (total time) | Noise dominated (detector-on time) | Marked lightcurve |
|---|---|---|---|---|---|---|---|
| A | 7800 | 6466 | 0 | 0 | 0.00% | 0.00% | 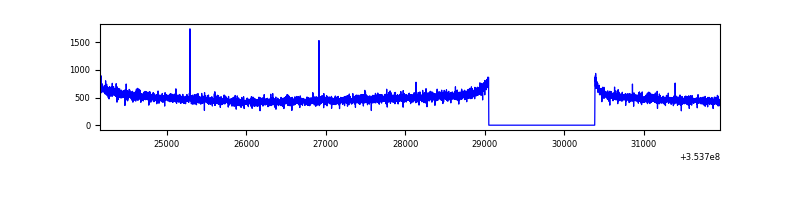 |
| B | 7800 | 6466 | 3 | 3 | 0.04% | 0.05% | 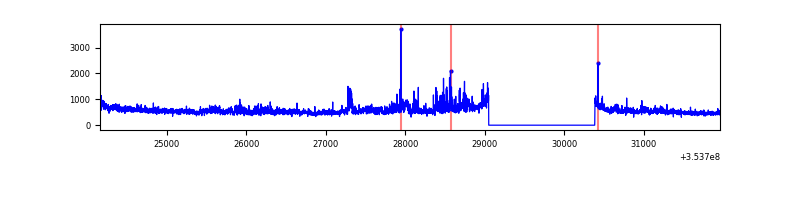 |
| C | 7800 | 6466 | 19 | 19 | 0.24% | 0.29% | 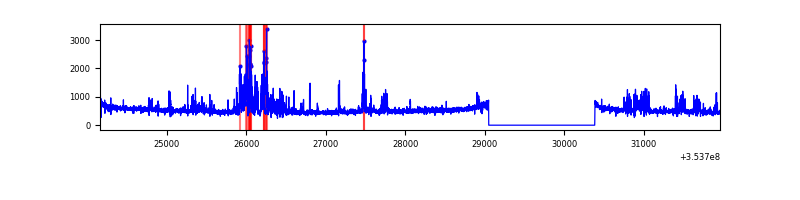 |
| D | 7800 | 6466 | 164 | 164 | 2.10% | 2.54% | 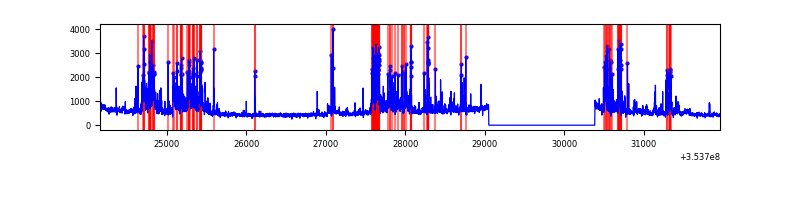 |
Top three noisy pixels from each quadrant. If the there are fewer than three noisy pixels in the level2.evt file, extra rows are filled as -1
| Pixel properties | Quadrant properties | ||||||
|---|---|---|---|---|---|---|---|
| Quadrant | DetID | PixID | Counts | Sigma | Mean | Median | Sigma |
| A | 13 | 254 | 12441 | 72.47 | 812 | 801 | 160.6 |
| A | 3 | 137 | 7526 | 41.87 | 812 | 801 | 160.6 |
| A | 0 | 13 | 7013 | 38.67 | 812 | 801 | 160.6 |
| B | 0 | 189 | 492437 | 3233.83 | 820 | 801 | 152.0 |
| B | 0 | 190 | 29897 | 191.38 | 820 | 801 | 152.0 |
| B | 0 | 156 | 19305 | 121.71 | 820 | 801 | 152.0 |
| C | 14 | 238 | 275721 | 1563.52 | 764 | 771 | 175.9 |
| C | 9 | 54 | 212976 | 1206.71 | 764 | 771 | 175.9 |
| C | 14 | 254 | 205065 | 1161.73 | 764 | 771 | 175.9 |
| D | 13 | 104 | 829040 | 4594.85 | 772 | 750 | 180.3 |
| D | 8 | 195 | 280057 | 1549.43 | 772 | 750 | 180.3 |
| D | 13 | 153 | 220399 | 1218.48 | 772 | 750 | 180.3 |
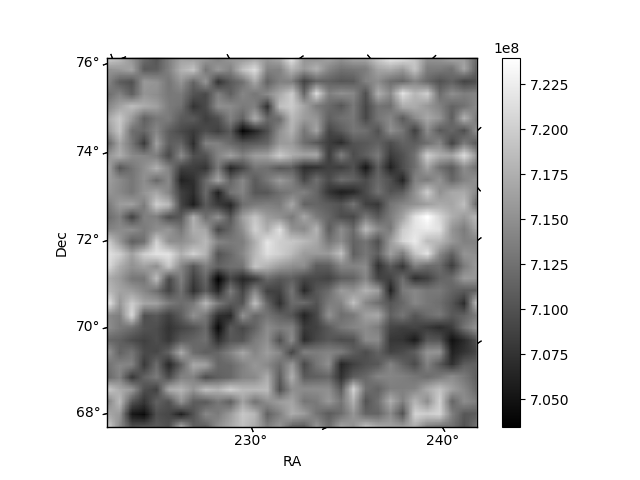
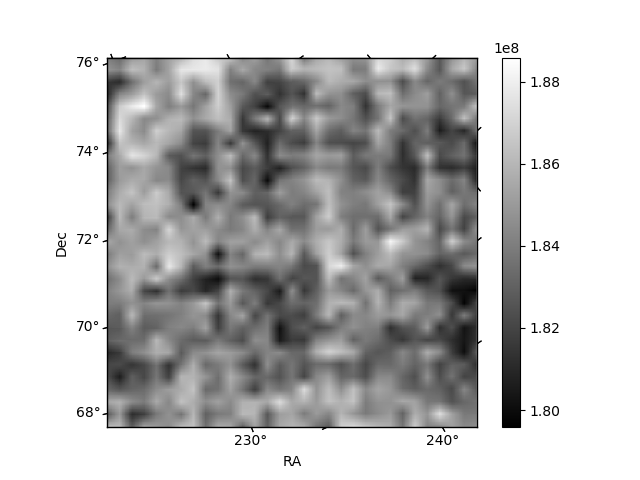
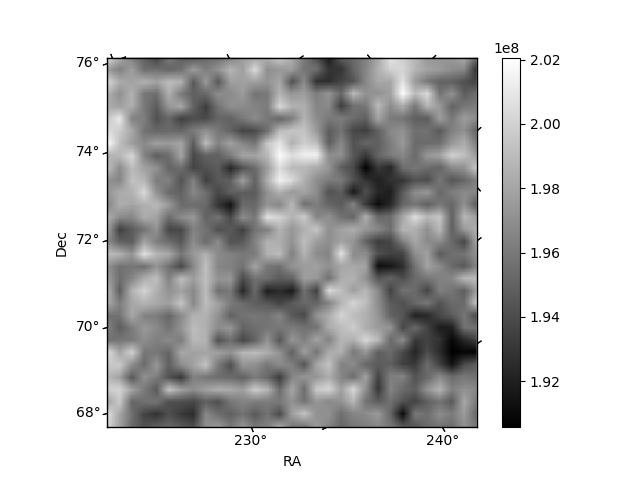
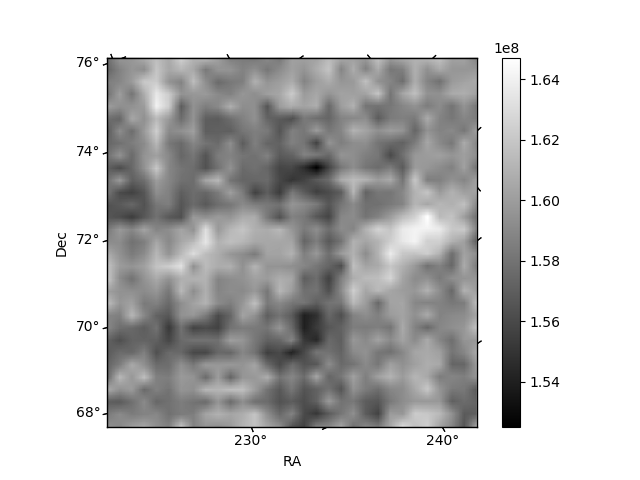
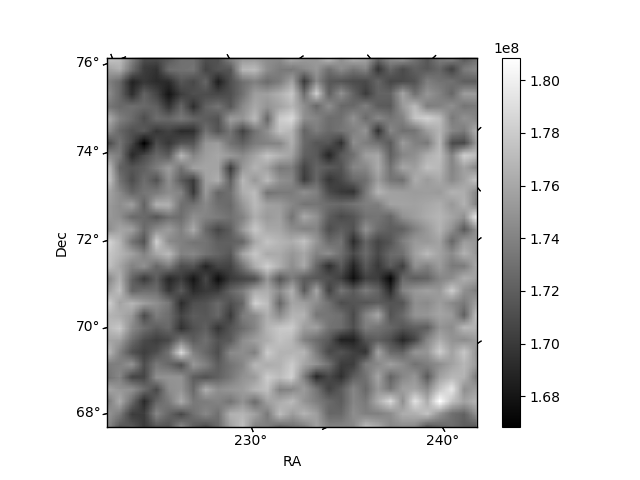
Histogram calculated using DETX and DETY for each event in the final _common_clean file
| Quadrant A | 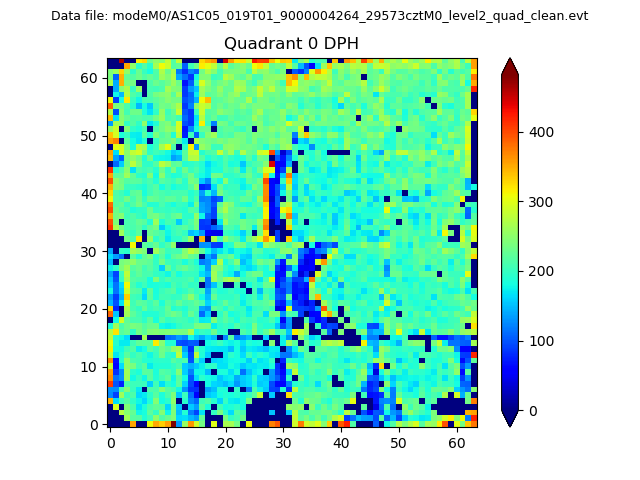 |
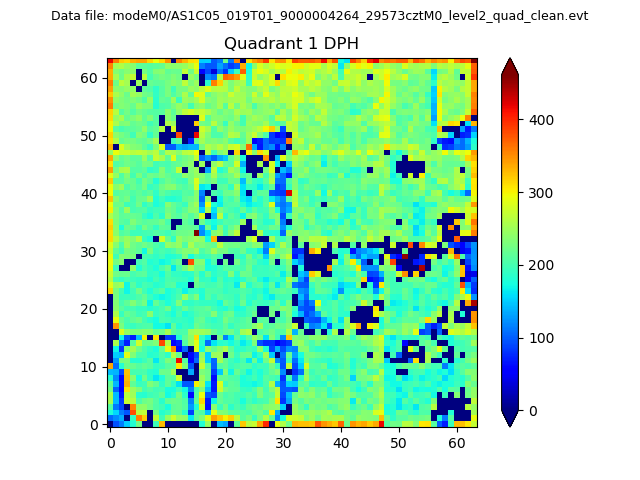 |
Quadrant B |
|---|---|---|---|
| Quadrant D | 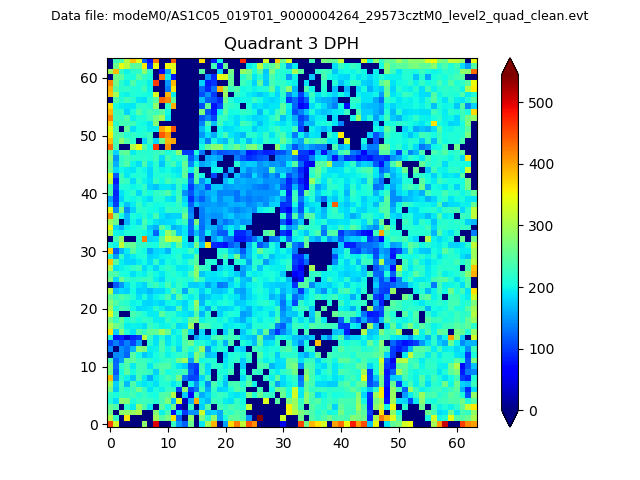 |
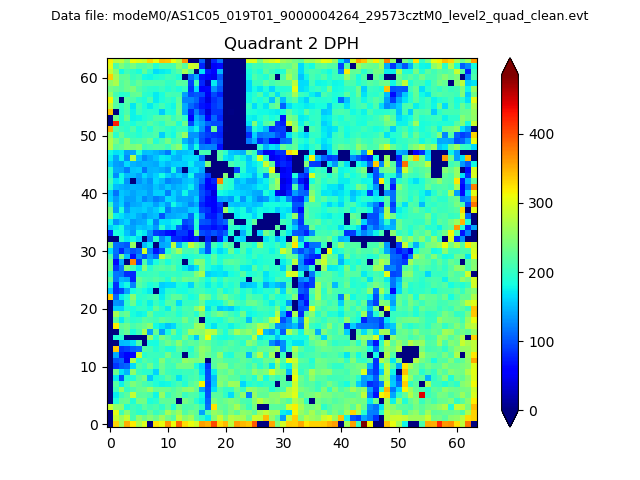 |
Quadrant C |
| Plot type | Count rate plots | Images |
|---|---|---|
| Comparison with Poisson distribution Blue bars denote a histogram of data divided into 1 sec bins. Red curve is a Poisson curve with rate = median count rate of data. |
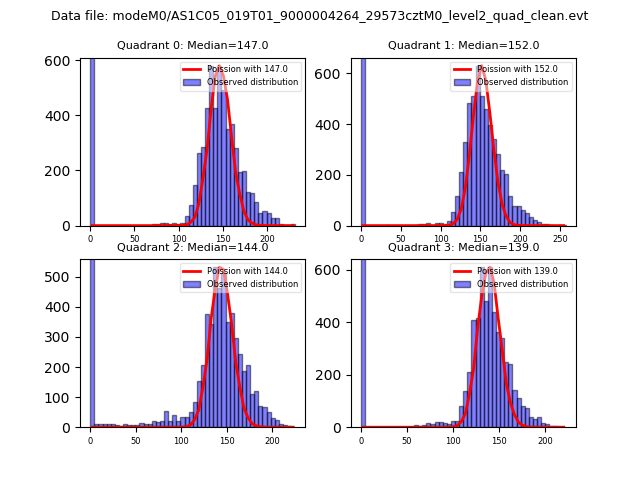 |
 |
| Quadrant-wise count rates Data is divided into 100 sec bins |
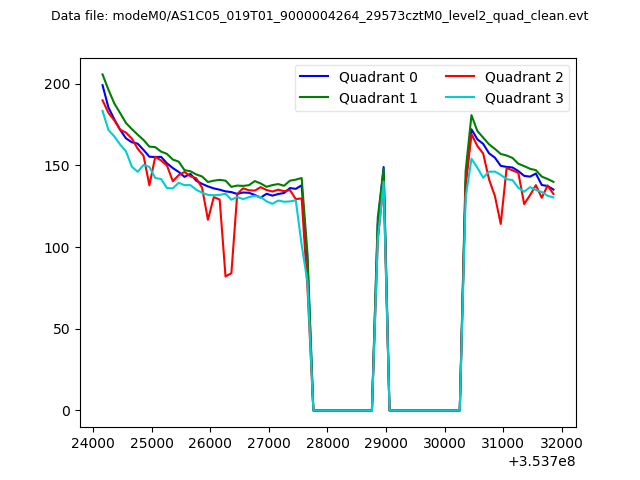 |
|
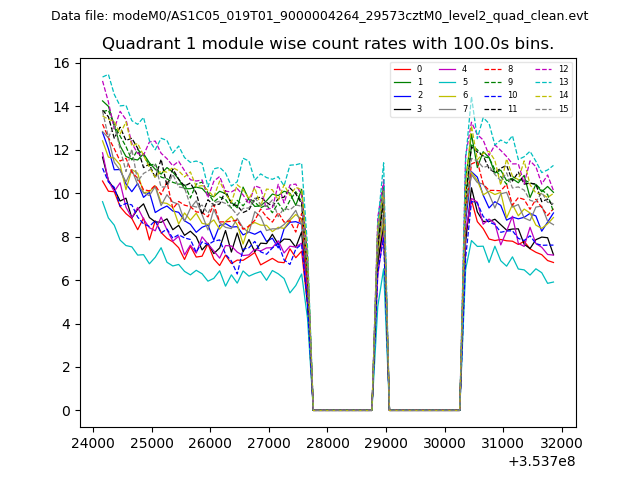
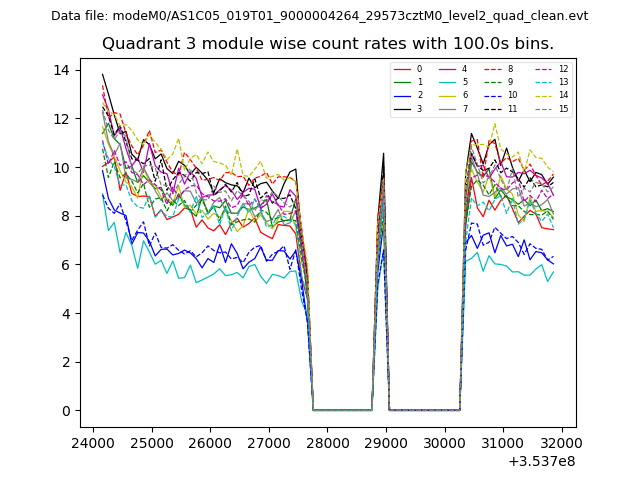
| Module-wise count rates for Quadrant A Data is divided into 100 sec bins |
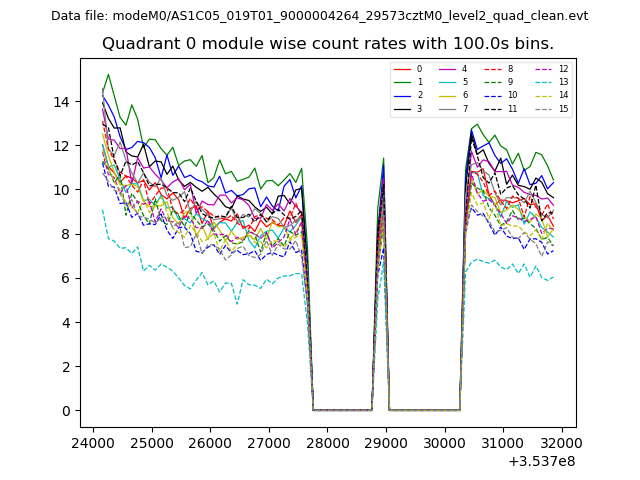 |
 |
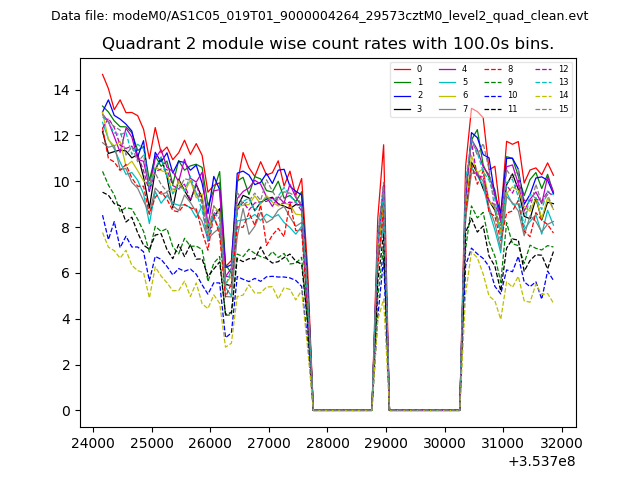
| Module-wise count rates for Quadrant B Data is divided into 100 sec bins |
 |
 |
| Module-wise count rates for Quadrant C Data is divided into 100 sec bins |
 |
 |
| Module-wise count rates for Quadrant D Data is divided into 100 sec bins |
 |
 |
| Parameter | Plot |
|---|---|
| CZT HV Monitor |  |
| D_VDD | 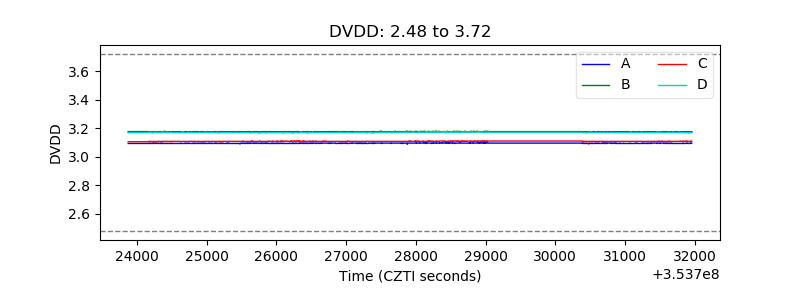 |
| Temperature 1 | 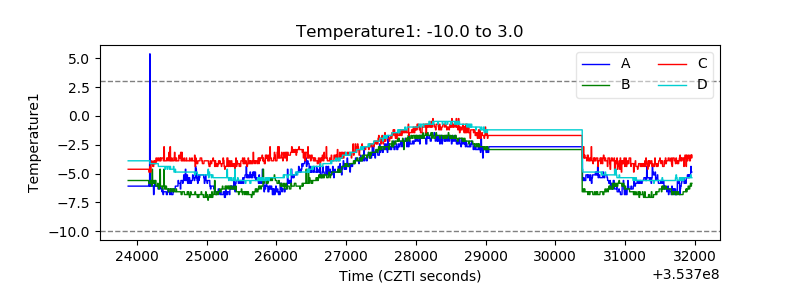 |
| Veto HV Monitor | 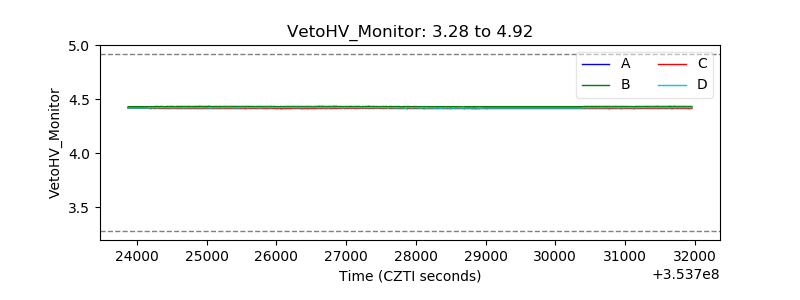 |
| Veto LLD | 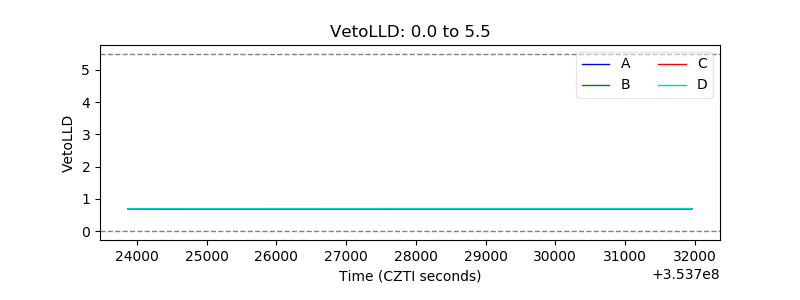 |
| Alpha Counter | 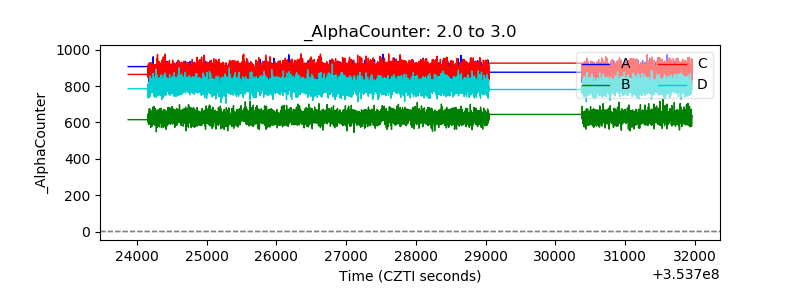 |
| _CPM_Rate | 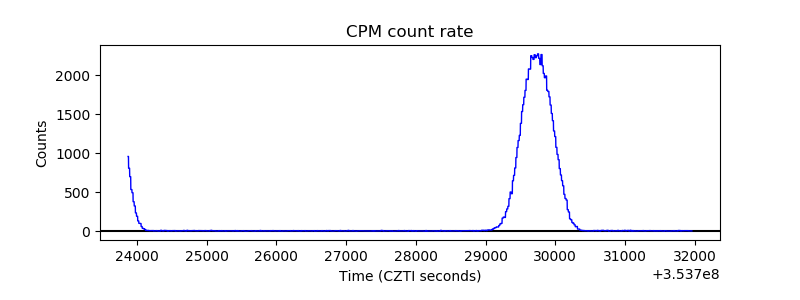 |
| CZT Counter | 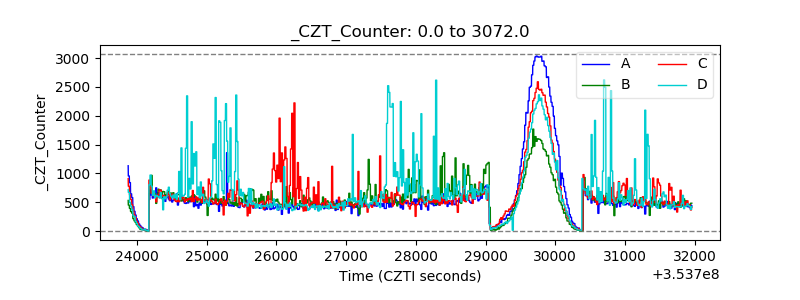 |
| +2.5 Volts monitor |  |
| +5 Volts monitor |  |
| _ROLL_ROT | 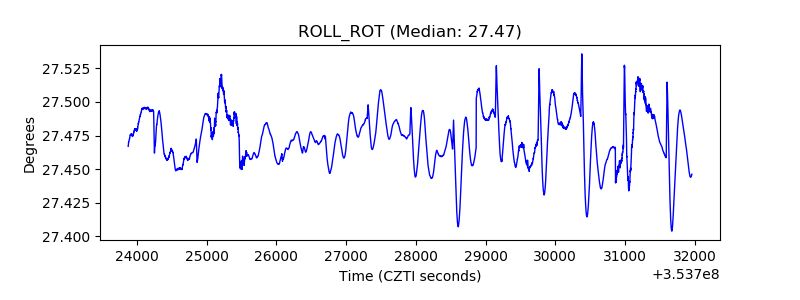 |
| _Roll_DEC | 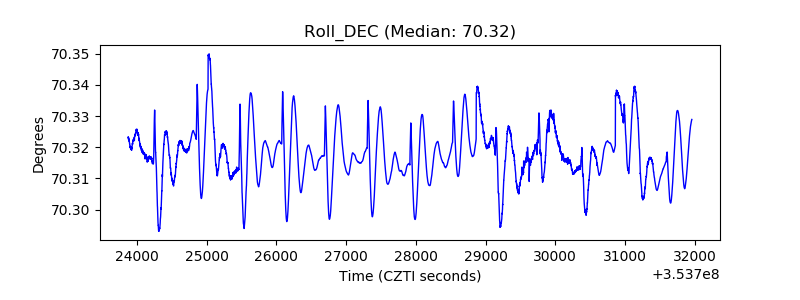 |
| _Roll_RA | 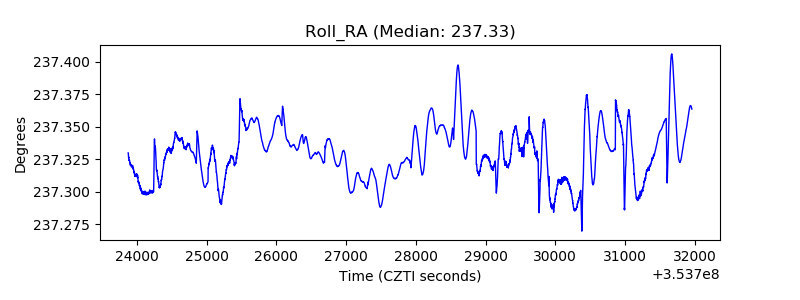 |
| Veto Counter |  |