| Param | Original file | Final file |
|---|---|---|
| Filename | modeM0/AS1C05_019T01_9000004264_29574cztM0_level2.evt | modeM0/AS1C05_019T01_9000004264_29574cztM0_level2_quad_clean.evt |
| Size (bytes) | 447,621,120 | 98,196,480 |
| Size | 426.9 MB | 93.6 MB |
| Events in quadrant A | 2,749,653 | 652,028 |
| Events in quadrant B | 3,351,886 | 672,304 |
| Events in quadrant C | 3,077,469 | 623,471 |
| Events in quadrant D | 3,977,069 | 614,784 |
| Mode SS | |||
|---|---|---|---|
| Quadrant | BADHDUFLAG | Total packets | Discarded packets |
| A | 0 | 120 | 0 |
| B | 0 | 120 | 0 |
| C | 0 | 120 | 0 |
| D | 0 | 120 | 0 |
| Mode M0 | |||
|---|---|---|---|
| Quadrant | BADHDUFLAG | Total packets | Discarded packets |
| A | 0 | 12036 | 1 |
| B | 0 | 13675 | 1 |
| C | 0 | 12941 | 1 |
| D | 0 | 15989 | 1 |
| Mode M9 | |||
|---|---|---|---|
| Quadrant | BADHDUFLAG | Total packets | Discarded packets |
| A | 0 | 12 | 0 |
| B | 0 | 12 | 0 |
| C | 0 | 12 | 0 |
| D | 0 | 12 | 0 |
| Quadrant | Total seconds | Saturated seconds | Saturation percentage |
|---|---|---|---|
| A | 5883 | 14 | 0.237974% |
| B | 5884 | 85 | 1.444596% |
| C | 5884 | 522 | 8.871516% |
| D | 5884 | 264 | 4.486744% |
Noise dominated data is calculated using 1-second bins in cleaned event files. If a bin has >2000 counts, and if more than 50% of those come from <1% of pixels, then it is considered to be noise-dominated and hence unusable.
| Quadrant | # 1 sec bins | Bins with >0 counts | Bins with >2000 counts | High rate bins dominated by noise | Noise dominated (total time) | Noise dominated (detector-on time) | Marked lightcurve |
|---|---|---|---|---|---|---|---|
| A | 7088 | 5884 | 0 | 0 | 0.00% | 0.00% | 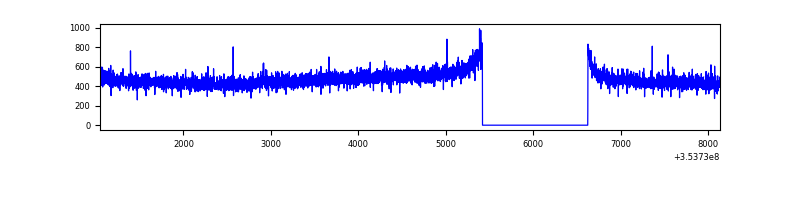 |
| B | 7089 | 5885 | 5 | 5 | 0.07% | 0.08% | 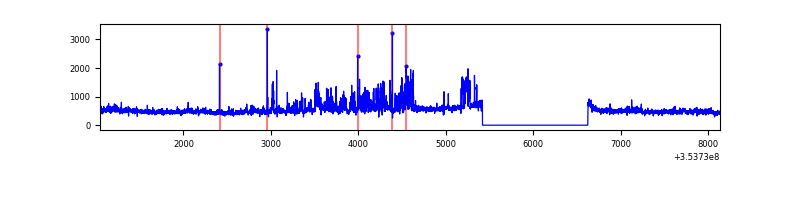 |
| C | 7089 | 5885 | 0 | 0 | 0.00% | 0.00% |  |
| D | 7089 | 5885 | 204 | 204 | 2.88% | 3.47% | 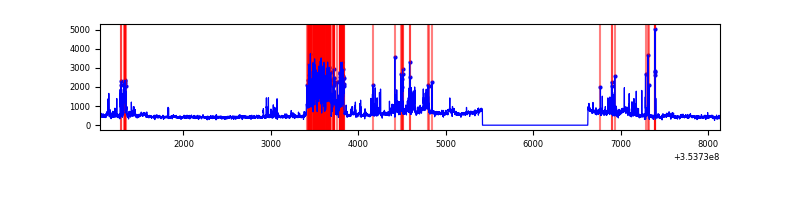 |
Top three noisy pixels from each quadrant. If the there are fewer than three noisy pixels in the level2.evt file, extra rows are filled as -1
| Pixel properties | Quadrant properties | ||||||
|---|---|---|---|---|---|---|---|
| Quadrant | DetID | PixID | Counts | Sigma | Mean | Median | Sigma |
| A | 13 | 254 | 10734 | 70.41 | 710 | 694 | 142.6 |
| A | 3 | 137 | 6733 | 42.35 | 710 | 694 | 142.6 |
| A | 0 | 226 | 6037 | 37.47 | 710 | 694 | 142.6 |
| B | 0 | 189 | 486024 | 3646.02 | 712 | 694 | 133.1 |
| B | 0 | 229 | 30076 | 220.73 | 712 | 694 | 133.1 |
| B | 0 | 190 | 21107 | 153.35 | 712 | 694 | 133.1 |
| C | 14 | 238 | 267579 | 1779.04 | 654 | 659 | 150.0 |
| C | 14 | 254 | 220653 | 1466.27 | 654 | 659 | 150.0 |
| C | 2 | 114 | 13029 | 82.44 | 654 | 659 | 150.0 |
| D | 13 | 104 | 872432 | 5524.55 | 671 | 652 | 157.8 |
| D | 8 | 195 | 290179 | 1834.76 | 671 | 652 | 157.8 |
| D | 12 | 33 | 92324 | 580.93 | 671 | 652 | 157.8 |
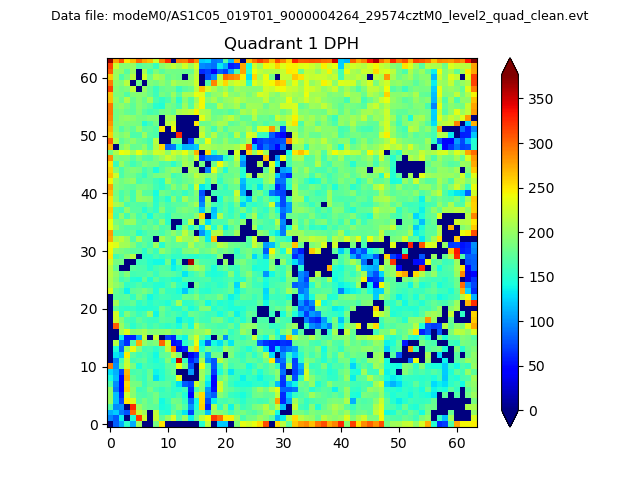
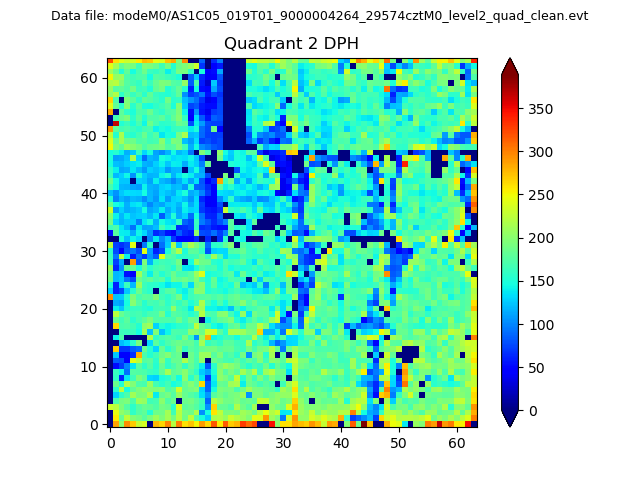
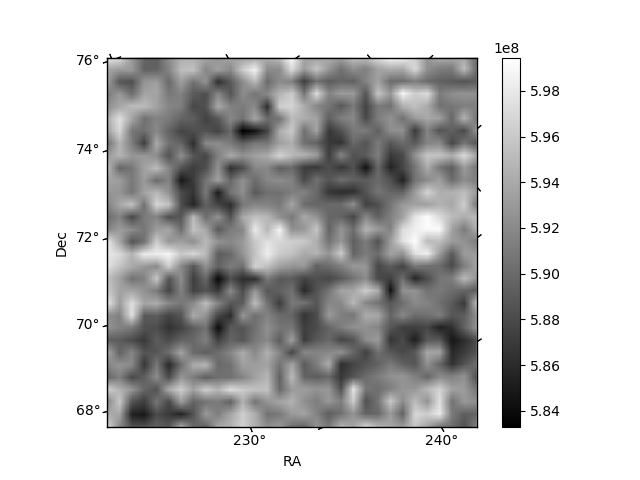
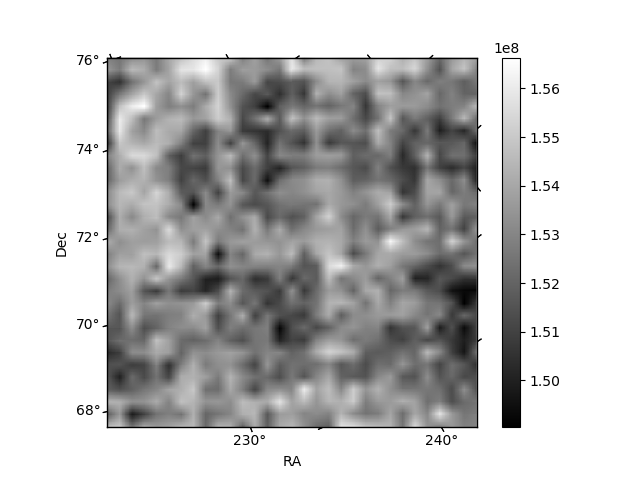
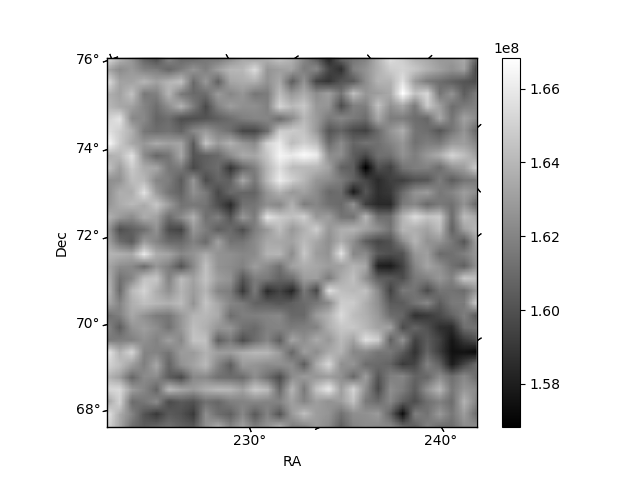
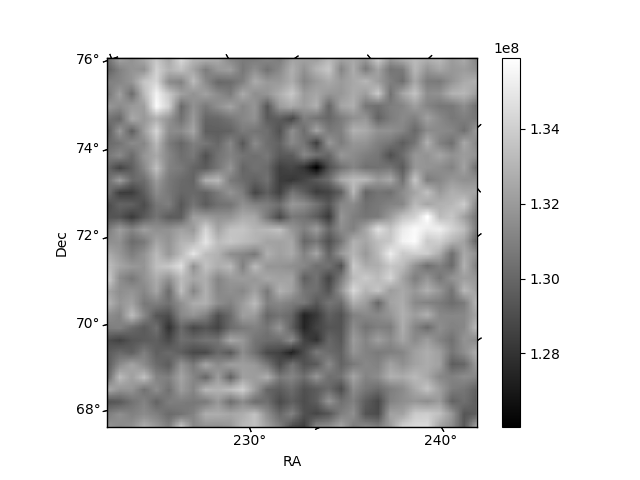
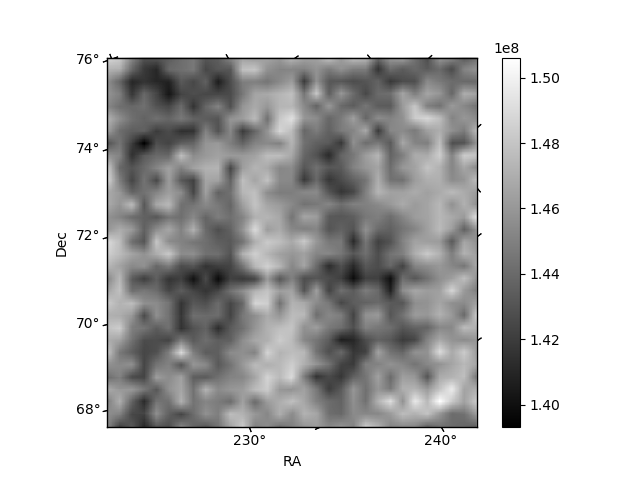
Histogram calculated using DETX and DETY for each event in the final _common_clean file
| Quadrant A | 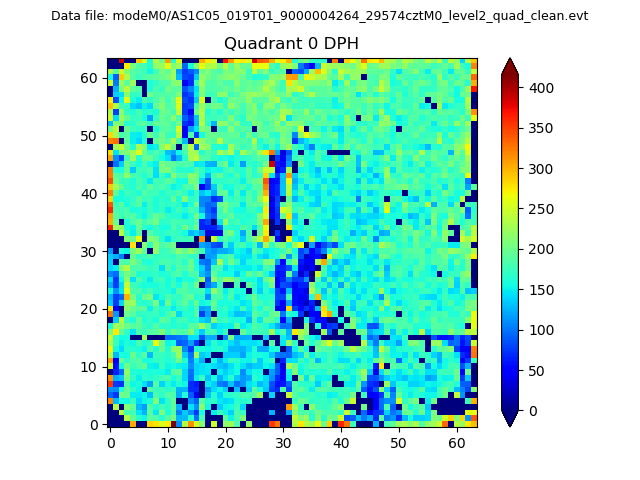 |
 |
Quadrant B |
|---|---|---|---|
| Quadrant D | 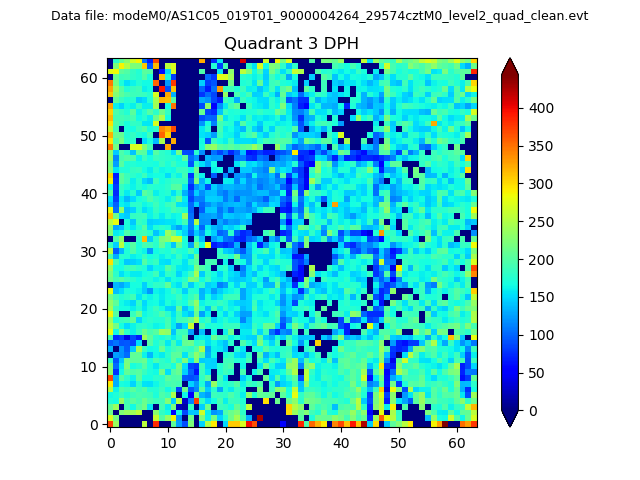 |
 |
Quadrant C |
| Plot type | Count rate plots | Images |
|---|---|---|
| Comparison with Poisson distribution Blue bars denote a histogram of data divided into 1 sec bins. Red curve is a Poisson curve with rate = median count rate of data. |
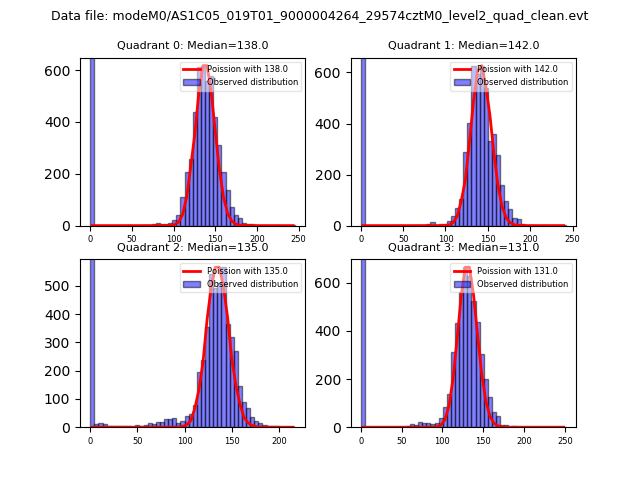 |
 |
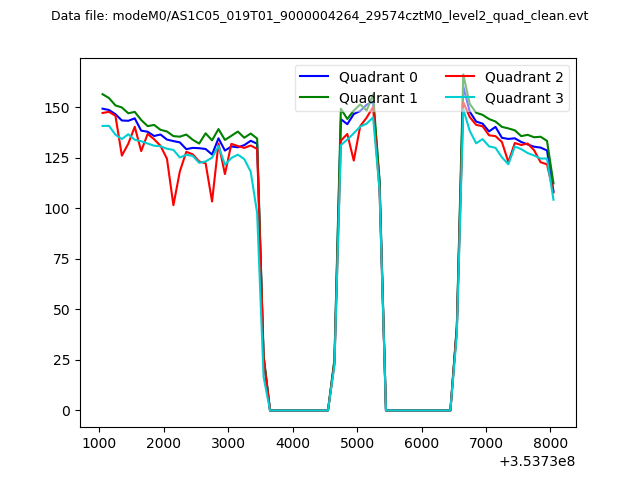
| Quadrant-wise count rates Data is divided into 100 sec bins |
 |
|
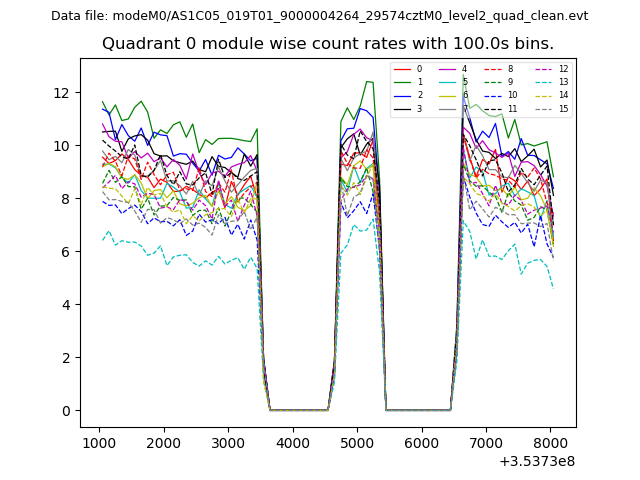
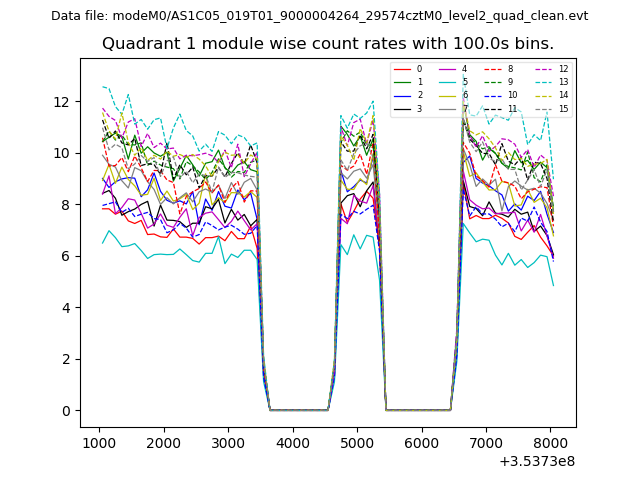
| Module-wise count rates for Quadrant A Data is divided into 100 sec bins |
 |
 |
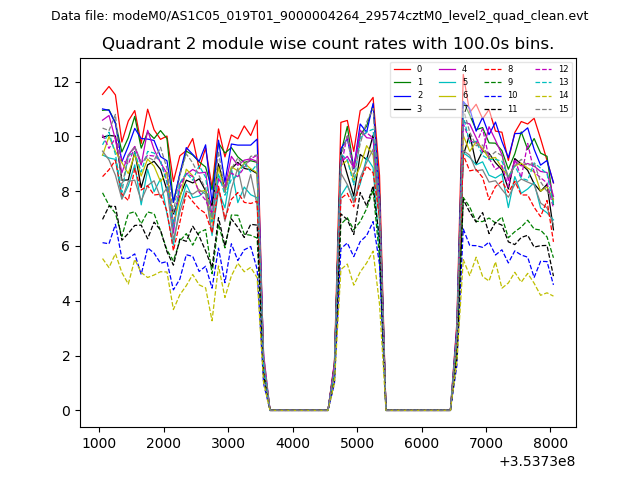
| Module-wise count rates for Quadrant B Data is divided into 100 sec bins |
 |
 |
| Module-wise count rates for Quadrant C Data is divided into 100 sec bins |
 |
 |
| Module-wise count rates for Quadrant D Data is divided into 100 sec bins |
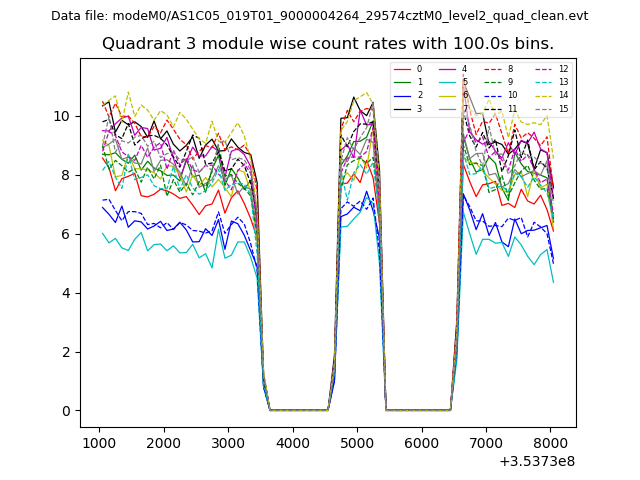 |
 |
| Parameter | Plot |
|---|---|
| CZT HV Monitor | 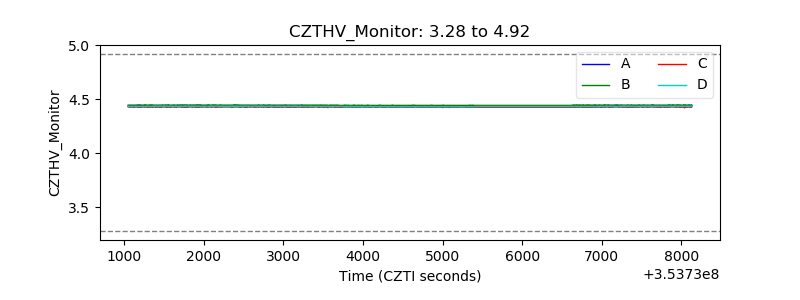 |
| D_VDD | 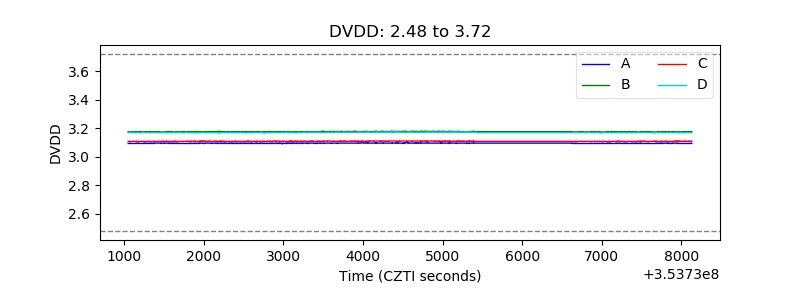 |
| Temperature 1 | 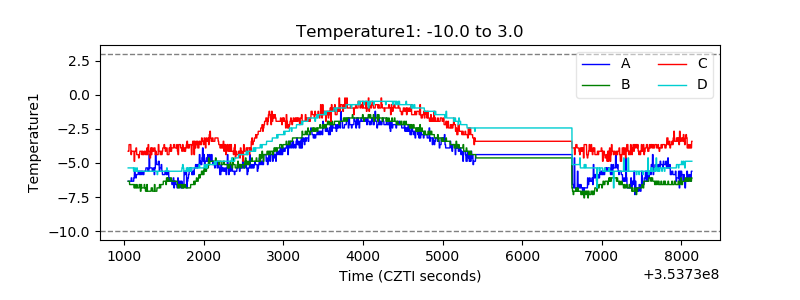 |
| Veto HV Monitor | 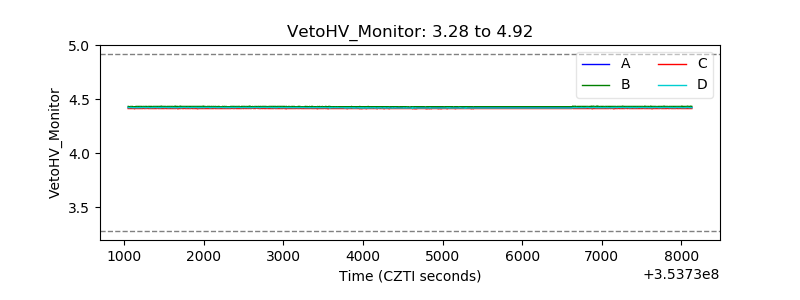 |
| Veto LLD | 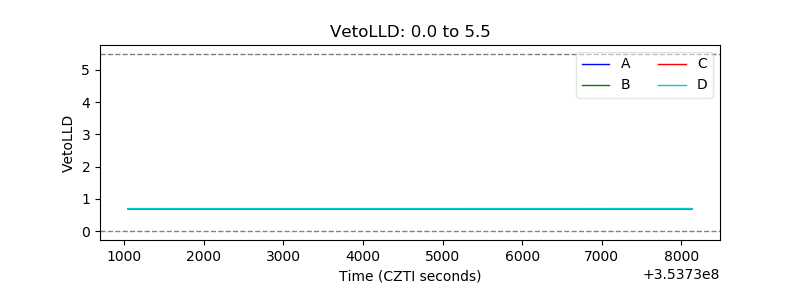 |
| Alpha Counter | 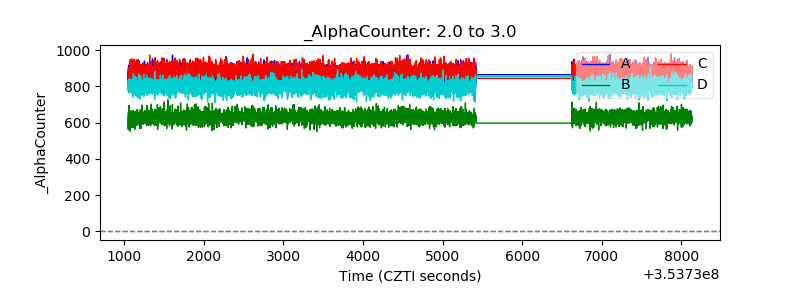 |
| _CPM_Rate | 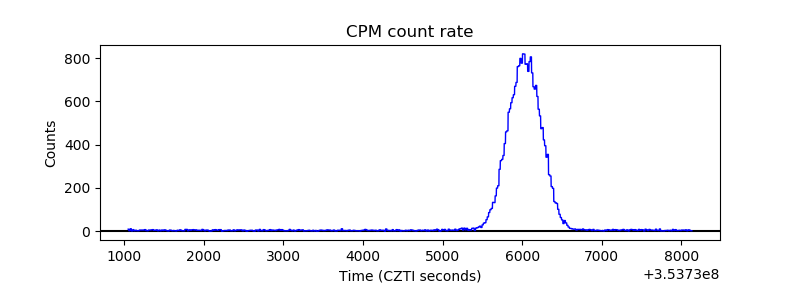 |
| CZT Counter | 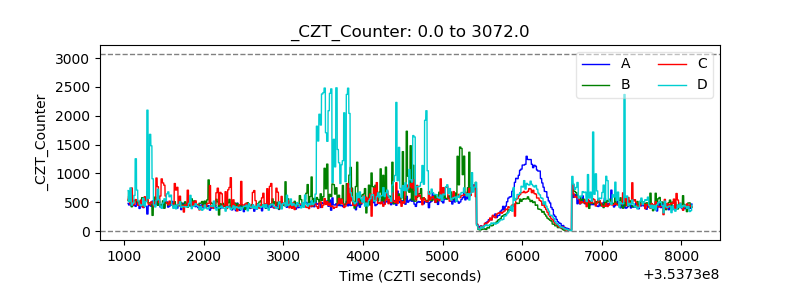 |
| +2.5 Volts monitor |  |
| +5 Volts monitor |  |
| _ROLL_ROT | 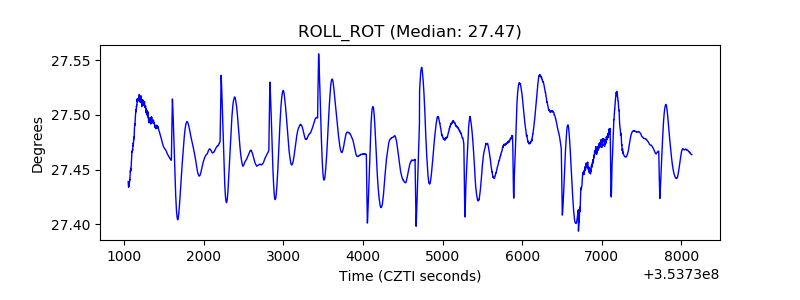 |
| _Roll_DEC | 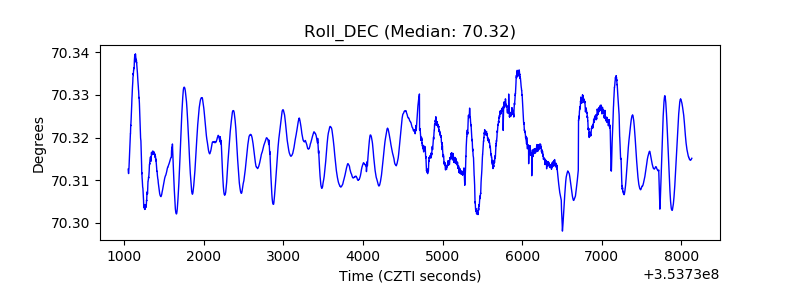 |
| _Roll_RA | 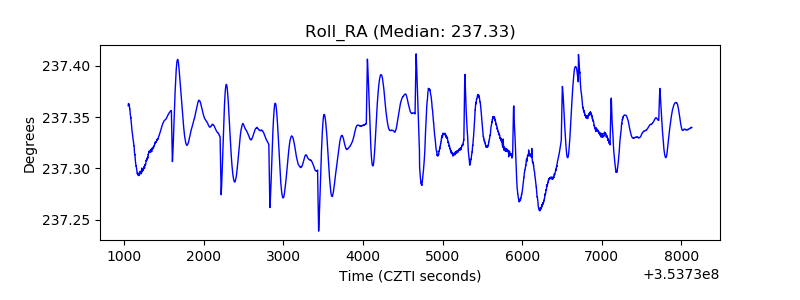 |
| Veto Counter | 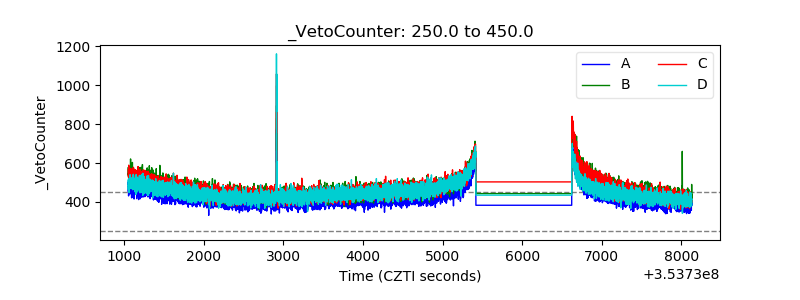 |