| Param | Original file | Final file |
|---|---|---|
| Filename | modeM0/AS1C05_019T01_9000004264_29576cztM0_level2.evt | modeM0/AS1C05_019T01_9000004264_29576cztM0_level2_quad_clean.evt |
| Size (bytes) | 469,062,720 | 86,690,880 |
| Size | 447.3 MB | 82.7 MB |
| Events in quadrant A | 2,542,418 | 570,354 |
| Events in quadrant B | 3,361,691 | 583,194 |
| Events in quadrant C | 2,966,725 | 546,292 |
| Events in quadrant D | 4,957,614 | 536,861 |
| Mode SS | |||
|---|---|---|---|
| Quadrant | BADHDUFLAG | Total packets | Discarded packets |
| A | 0 | 114 | 0 |
| B | 0 | 114 | 0 |
| C | 0 | 114 | 0 |
| D | 0 | 114 | 0 |
| Mode M0 | |||
|---|---|---|---|
| Quadrant | BADHDUFLAG | Total packets | Discarded packets |
| A | 0 | 11266 | 1 |
| B | 0 | 13617 | 1 |
| C | 0 | 12419 | 1 |
| D | 0 | 18704 | 1 |
| Mode M9 | |||
|---|---|---|---|
| Quadrant | BADHDUFLAG | Total packets | Discarded packets |
| A | 0 | 9 | 0 |
| B | 0 | 9 | 0 |
| C | 0 | 9 | 0 |
| D | 0 | 9 | 0 |
| Quadrant | Total seconds | Saturated seconds | Saturation percentage |
|---|---|---|---|
| A | 5546 | 14 | 0.252434% |
| B | 5547 | 143 | 2.577970% |
| C | 5547 | 640 | 11.537768% |
| D | 5547 | 443 | 7.986299% |
Noise dominated data is calculated using 1-second bins in cleaned event files. If a bin has >2000 counts, and if more than 50% of those come from <1% of pixels, then it is considered to be noise-dominated and hence unusable.
| Quadrant | # 1 sec bins | Bins with >0 counts | Bins with >2000 counts | High rate bins dominated by noise | Noise dominated (total time) | Noise dominated (detector-on time) | Marked lightcurve |
|---|---|---|---|---|---|---|---|
| A | 6446 | 5547 | 0 | 0 | 0.00% | 0.00% | 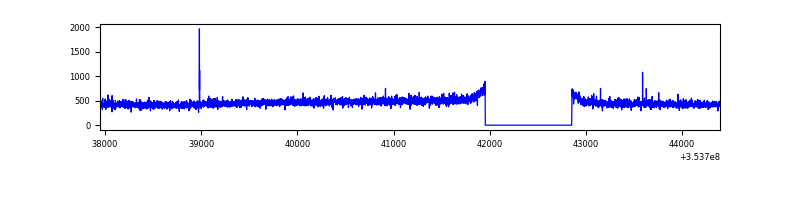 |
| B | 6447 | 5548 | 81 | 81 | 1.26% | 1.46% | 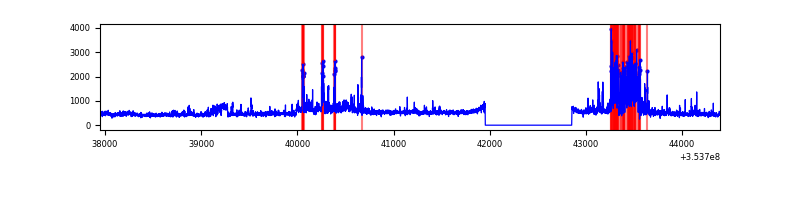 |
| C | 6447 | 5548 | 0 | 0 | 0.00% | 0.00% | 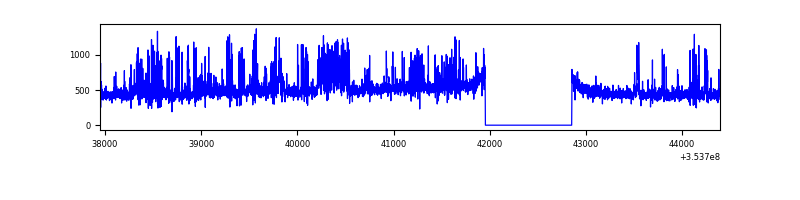 |
| D | 6447 | 5548 | 338 | 338 | 5.24% | 6.09% | 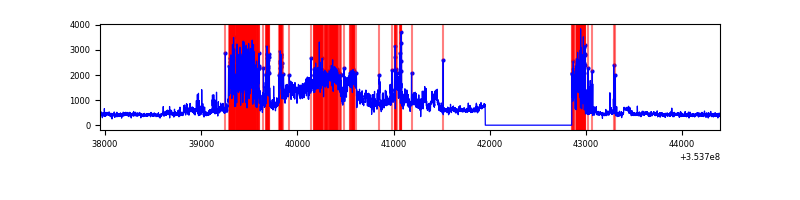 |
Top three noisy pixels from each quadrant. If the there are fewer than three noisy pixels in the level2.evt file, extra rows are filled as -1
| Pixel properties | Quadrant properties | ||||||
|---|---|---|---|---|---|---|---|
| Quadrant | DetID | PixID | Counts | Sigma | Mean | Median | Sigma |
| A | 13 | 254 | 9790 | 69.66 | 655 | 642 | 131.3 |
| A | 0 | 13 | 9633 | 68.47 | 655 | 642 | 131.3 |
| A | 3 | 137 | 6291 | 43.02 | 655 | 642 | 131.3 |
| B | 0 | 189 | 755082 | 6152.86 | 652 | 635 | 122.6 |
| B | 0 | 230 | 18155 | 142.88 | 652 | 635 | 122.6 |
| B | 0 | 190 | 16428 | 128.8 | 652 | 635 | 122.6 |
| C | 14 | 238 | 292740 | 2120.04 | 598 | 602 | 137.8 |
| C | 14 | 254 | 267213 | 1934.79 | 598 | 602 | 137.8 |
| C | 3 | 233 | 31874 | 226.94 | 598 | 602 | 137.8 |
| D | 12 | 33 | 1484588 | 10019.74 | 620 | 602 | 148.1 |
| D | 13 | 104 | 739506 | 4989.01 | 620 | 602 | 148.1 |
| D | 8 | 195 | 282893 | 1906.0 | 620 | 602 | 148.1 |
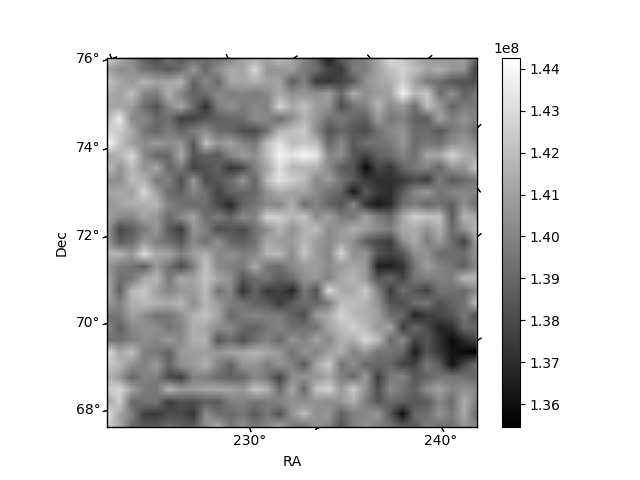
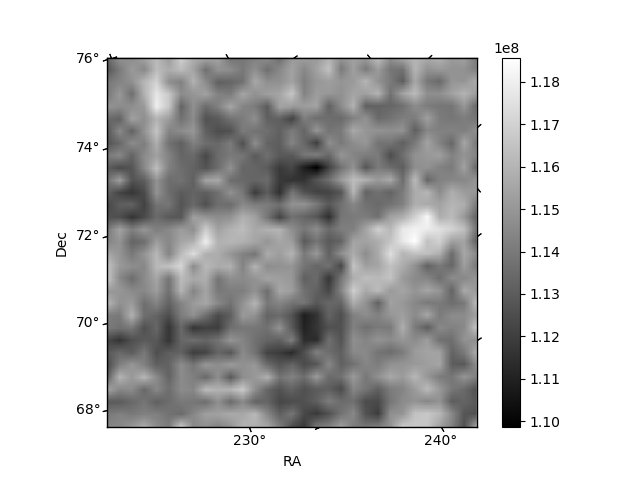
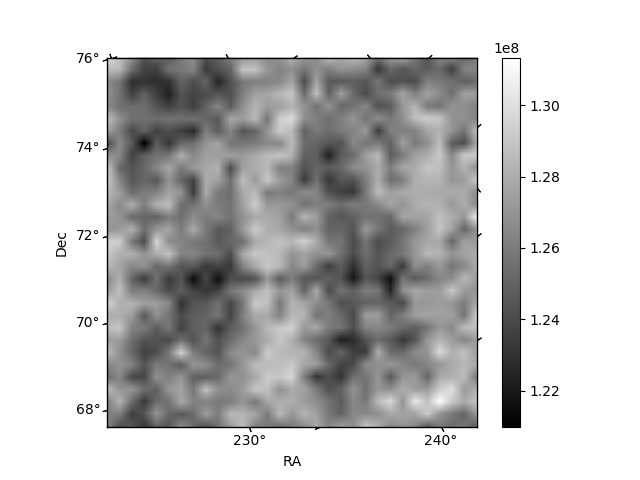
Histogram calculated using DETX and DETY for each event in the final _common_clean file
| Quadrant A | 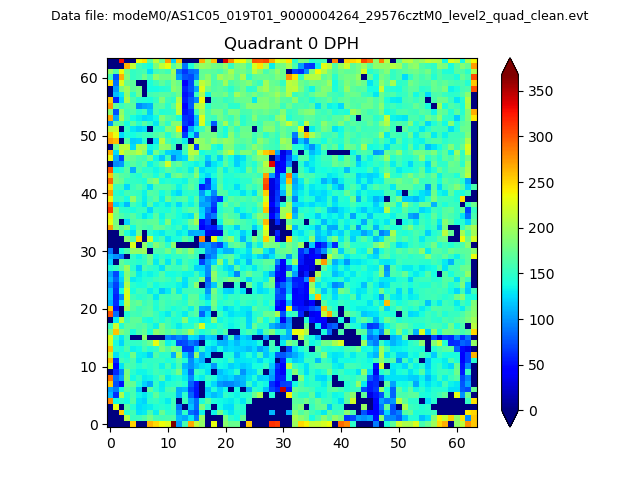 |
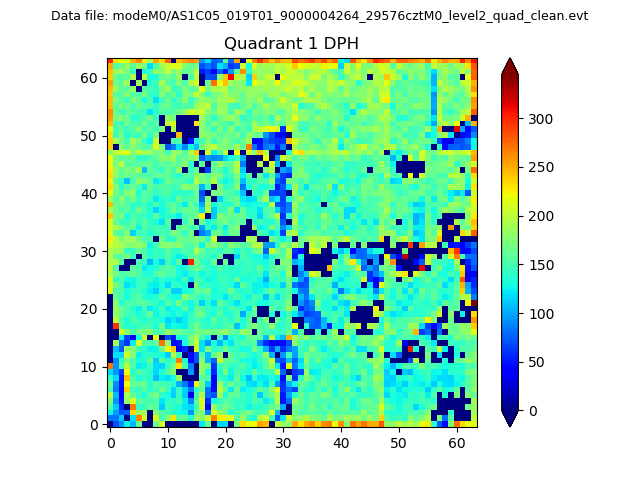 |
Quadrant B |
|---|---|---|---|
| Quadrant D | 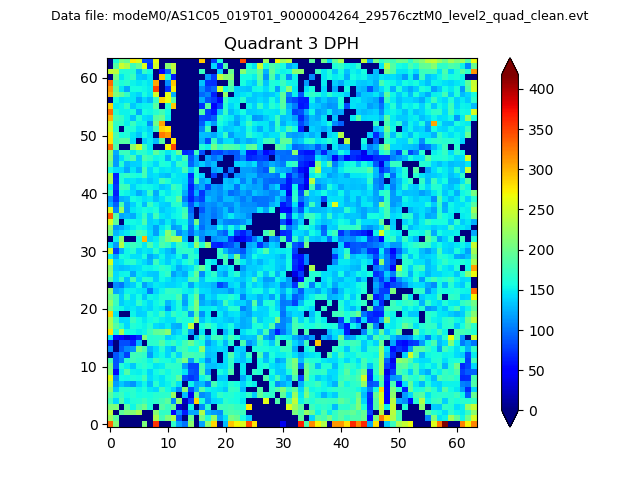 |
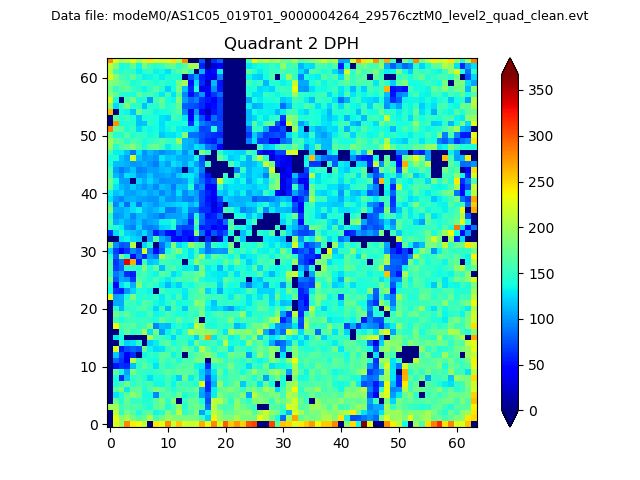 |
Quadrant C |
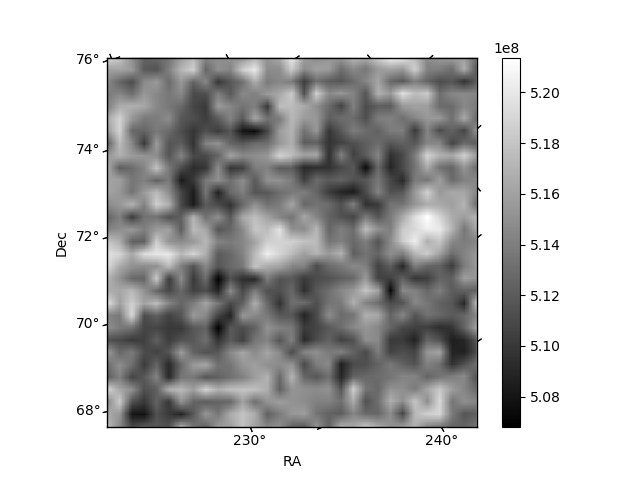
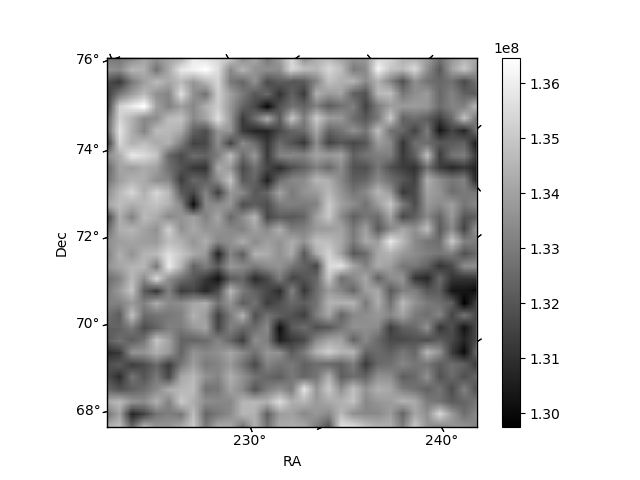
| Plot type | Count rate plots | Images |
|---|---|---|
| Comparison with Poisson distribution Blue bars denote a histogram of data divided into 1 sec bins. Red curve is a Poisson curve with rate = median count rate of data. |
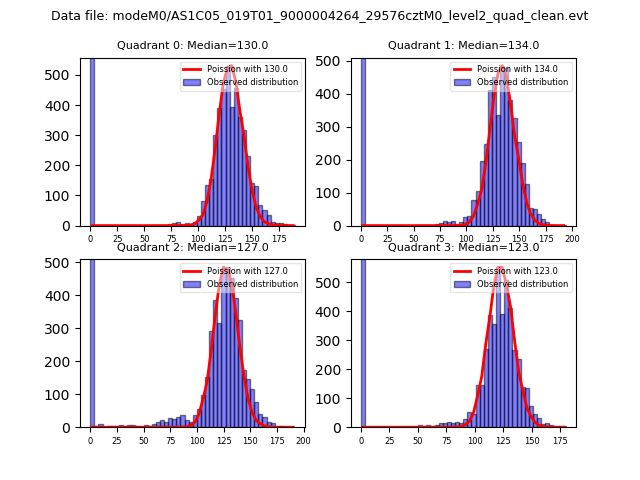 |
 |
| Quadrant-wise count rates Data is divided into 100 sec bins |
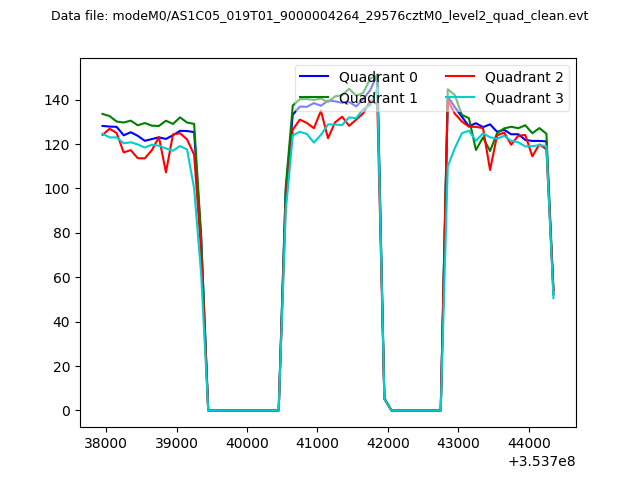 |
|
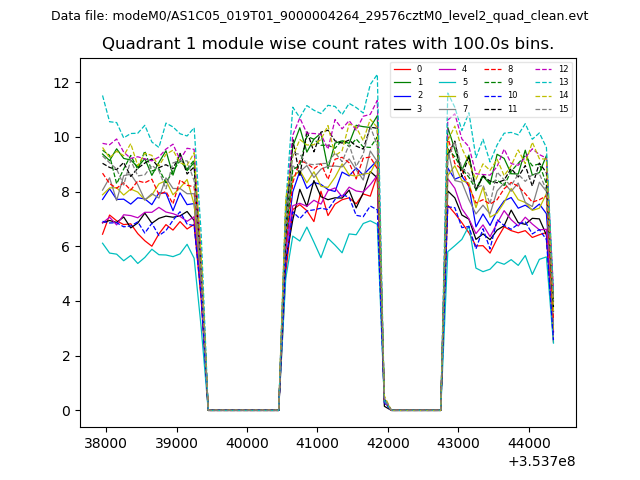
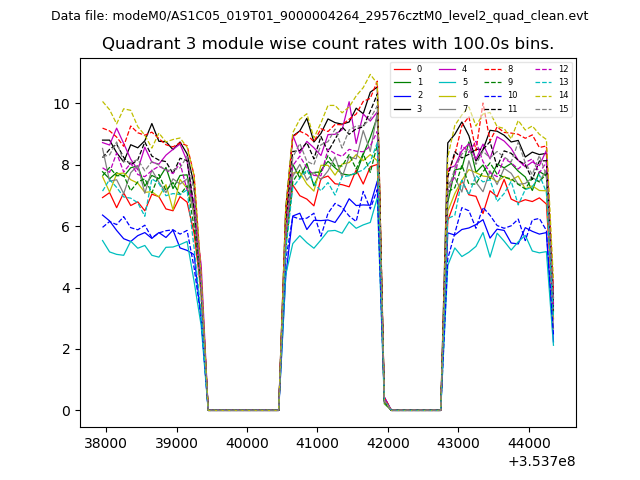
| Module-wise count rates for Quadrant A Data is divided into 100 sec bins |
 |
 |
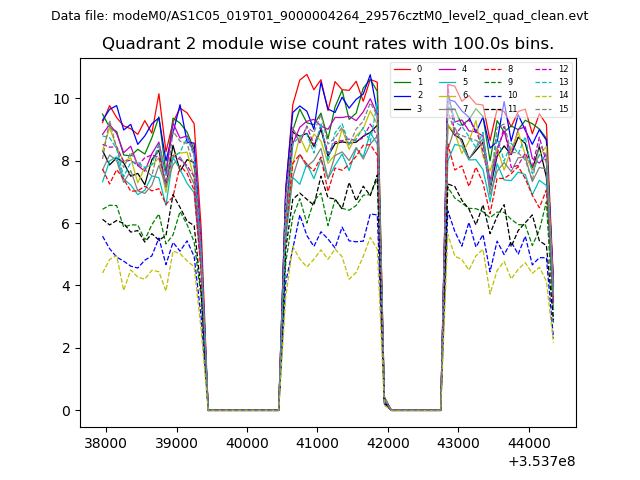
| Module-wise count rates for Quadrant B Data is divided into 100 sec bins |
 |
 |
| Module-wise count rates for Quadrant C Data is divided into 100 sec bins |
 |
 |
| Module-wise count rates for Quadrant D Data is divided into 100 sec bins |
 |
 |
| Parameter | Plot |
|---|---|
| CZT HV Monitor | 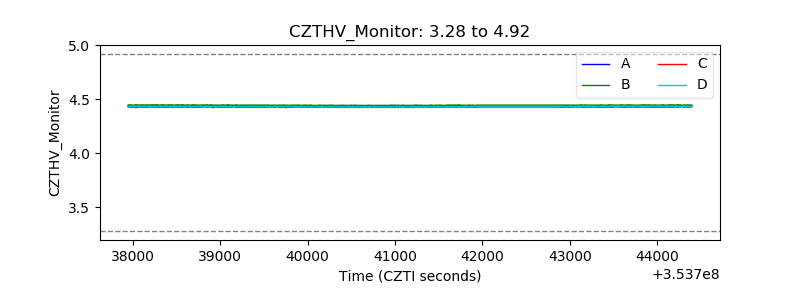 |
| D_VDD | 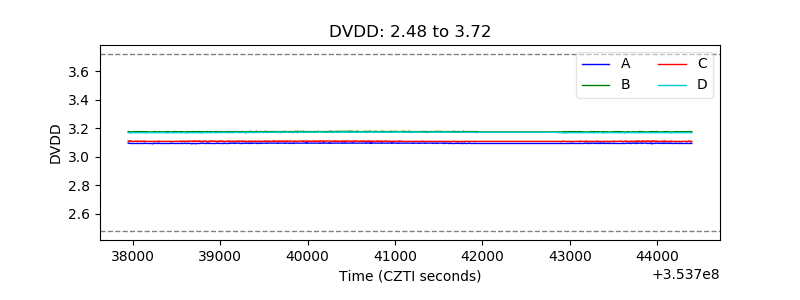 |
| Temperature 1 | 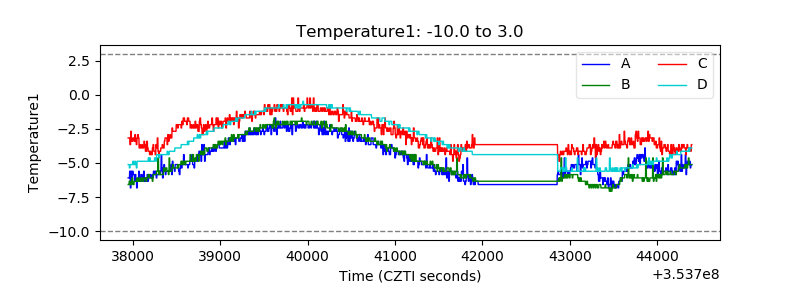 |
| Veto HV Monitor | 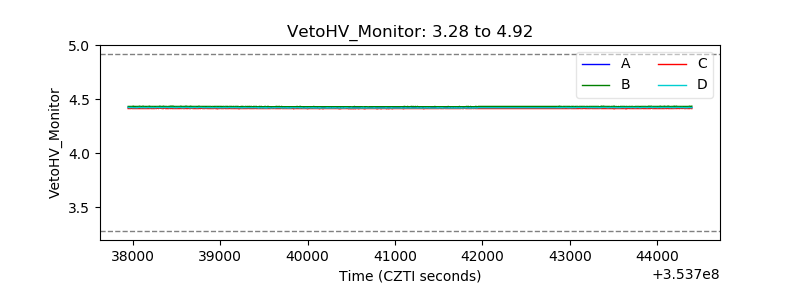 |
| Veto LLD | 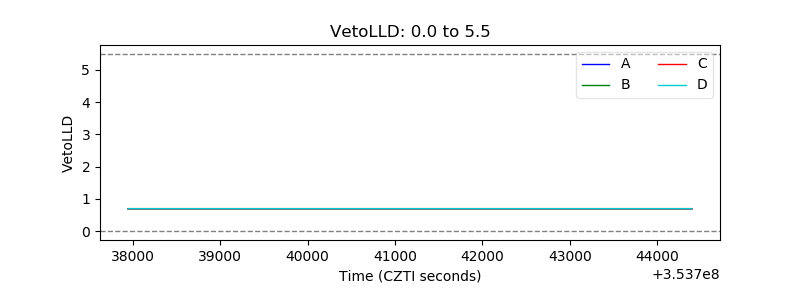 |
| Alpha Counter | 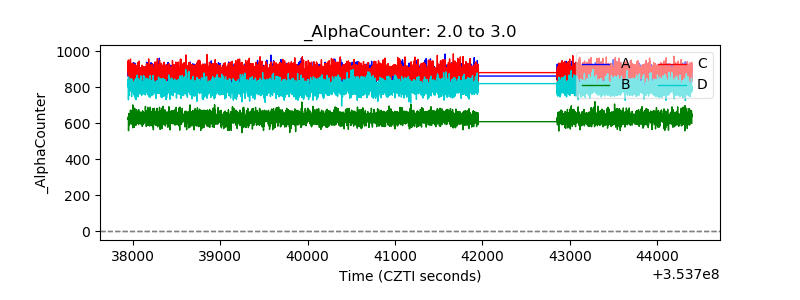 |
| _CPM_Rate | 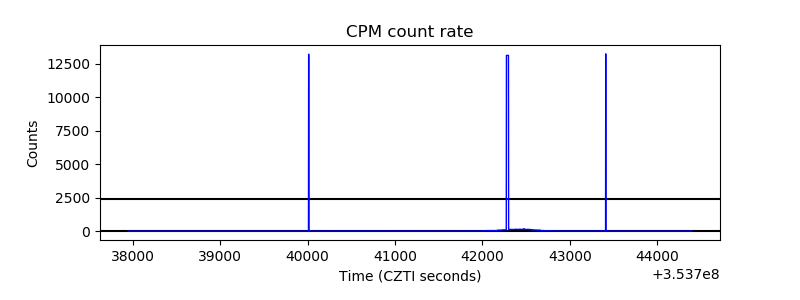 |
| CZT Counter | 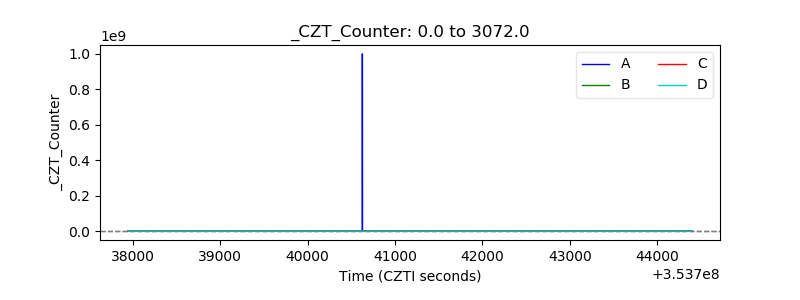 |
| +2.5 Volts monitor |  |
| +5 Volts monitor |  |
| _ROLL_ROT |  |
| _Roll_DEC | 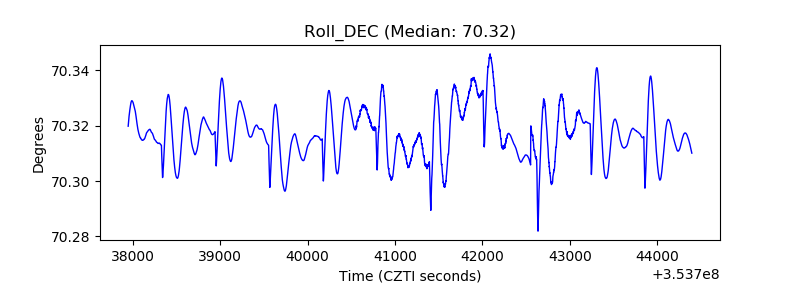 |
| _Roll_RA | 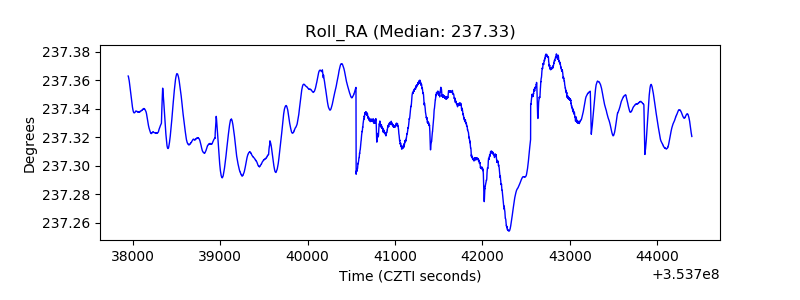 |
| Veto Counter |  |