| Param | Original file | Final file |
|---|---|---|
| Filename | modeM0/AS1A10_093T01_9000004266_29576cztM0_level2.evt | modeM0/AS1A10_093T01_9000004266_29576cztM0_level2_quad_clean.evt |
| Size (bytes) | 450,354,240 | 70,623,360 |
| Size | 429.5 MB | 67.4 MB |
| Events in quadrant A | 2,417,721 | 466,766 |
| Events in quadrant B | 3,214,069 | 470,014 |
| Events in quadrant C | 2,717,774 | 429,696 |
| Events in quadrant D | 4,942,593 | 414,102 |
| Mode M9 | |||
|---|---|---|---|
| Quadrant | BADHDUFLAG | Total packets | Discarded packets |
| A | 0 | 4 | 0 |
| B | 0 | 4 | 0 |
| C | 0 | 4 | 0 |
| D | 0 | 4 | 0 |
| Mode M0 | |||
|---|---|---|---|
| Quadrant | BADHDUFLAG | Total packets | Discarded packets |
| A | 0 | 10514 | 1 |
| B | 0 | 12759 | 1 |
| C | 0 | 11374 | 1 |
| D | 0 | 18166 | 1 |
| Mode SS | |||
|---|---|---|---|
| Quadrant | BADHDUFLAG | Total packets | Discarded packets |
| A | 0 | 104 | 0 |
| B | 0 | 104 | 0 |
| C | 0 | 104 | 0 |
| D | 0 | 104 | 0 |
| Quadrant | Total seconds | Saturated seconds | Saturation percentage |
|---|---|---|---|
| A | 5105 | 128 | 2.507346% |
| B | 5105 | 175 | 3.428012% |
| C | 5105 | 651 | 12.752204% |
| D | 5105 | 471 | 9.226249% |
Noise dominated data is calculated using 1-second bins in cleaned event files. If a bin has >2000 counts, and if more than 50% of those come from <1% of pixels, then it is considered to be noise-dominated and hence unusable.
| Quadrant | # 1 sec bins | Bins with >0 counts | Bins with >2000 counts | High rate bins dominated by noise | Noise dominated (total time) | Noise dominated (detector-on time) | Marked lightcurve |
|---|---|---|---|---|---|---|---|
| A | 5490 | 5106 | 0 | 0 | 0.00% | 0.00% | 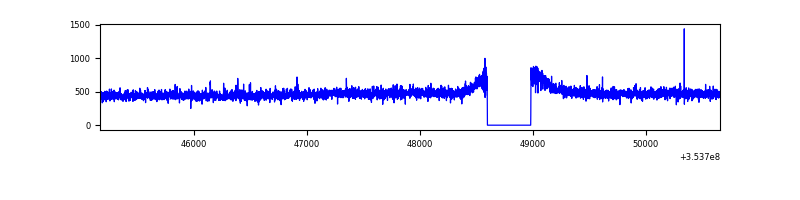 |
| B | 5490 | 5106 | 11 | 11 | 0.20% | 0.22% | 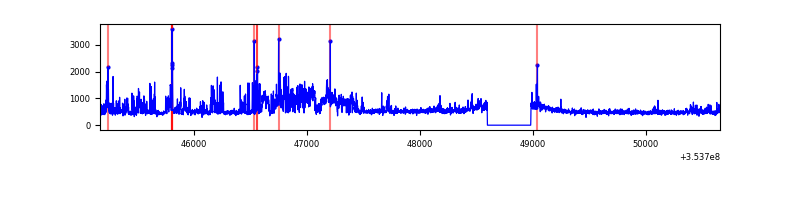 |
| C | 5490 | 5106 | 0 | 0 | 0.00% | 0.00% | 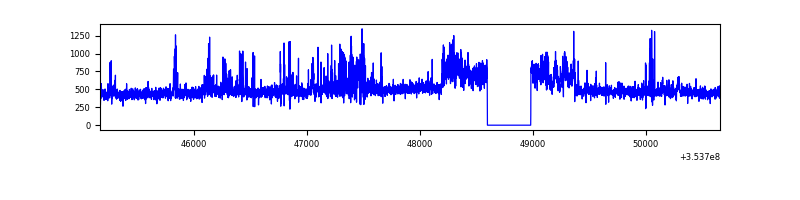 |
| D | 5490 | 5106 | 384 | 384 | 6.99% | 7.52% | 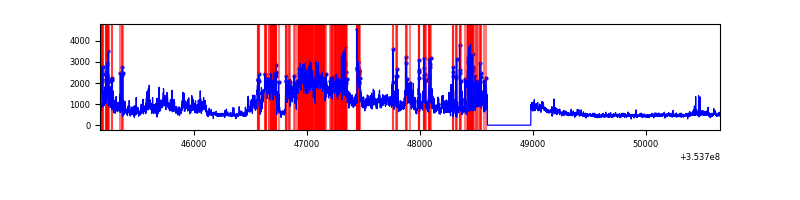 |
Top three noisy pixels from each quadrant. If the there are fewer than three noisy pixels in the level2.evt file, extra rows are filled as -1
| Pixel properties | Quadrant properties | ||||||
|---|---|---|---|---|---|---|---|
| Quadrant | DetID | PixID | Counts | Sigma | Mean | Median | Sigma |
| A | 13 | 254 | 9938 | 73.48 | 622 | 607 | 127.0 |
| A | 0 | 13 | 7140 | 51.44 | 622 | 607 | 127.0 |
| A | 3 | 137 | 6439 | 45.92 | 622 | 607 | 127.0 |
| B | 0 | 189 | 696138 | 5792.06 | 618 | 600 | 120.1 |
| B | 0 | 190 | 35047 | 286.86 | 618 | 600 | 120.1 |
| B | 0 | 156 | 22861 | 185.38 | 618 | 600 | 120.1 |
| C | 14 | 238 | 254639 | 1903.32 | 566 | 569 | 133.5 |
| C | 14 | 254 | 229920 | 1718.15 | 566 | 569 | 133.5 |
| C | 2 | 114 | 11240 | 79.94 | 566 | 569 | 133.5 |
| D | 12 | 33 | 1745537 | 12399.58 | 587 | 571 | 140.7 |
| D | 13 | 104 | 341446 | 2422.23 | 587 | 571 | 140.7 |
| D | 7 | 80 | 280025 | 1985.78 | 587 | 571 | 140.7 |
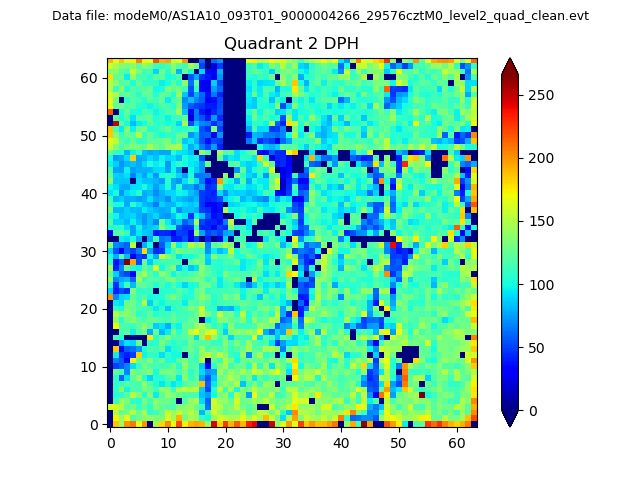
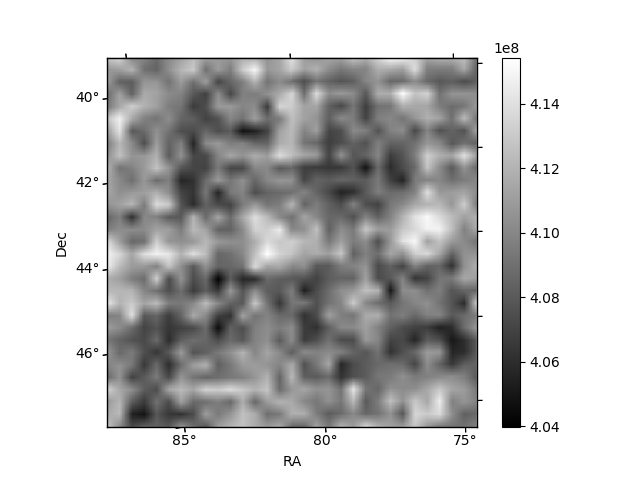
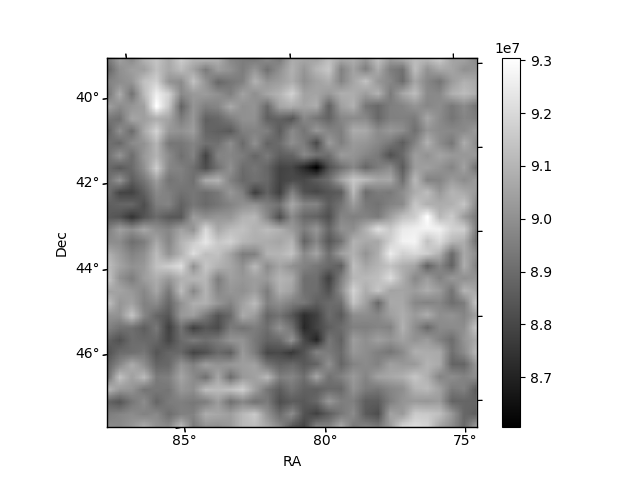
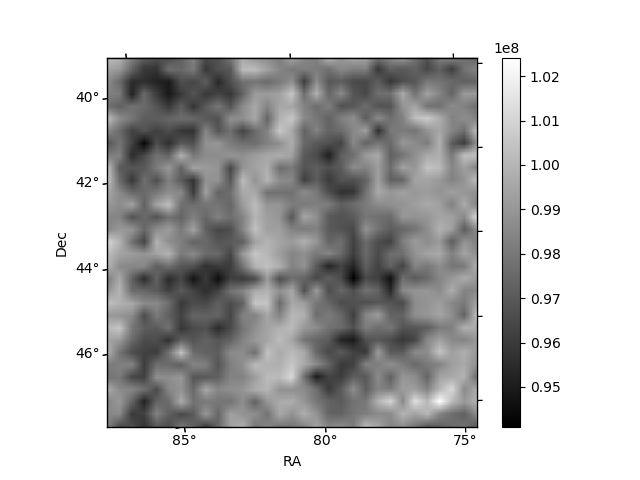
Histogram calculated using DETX and DETY for each event in the final _common_clean file
| Quadrant A | 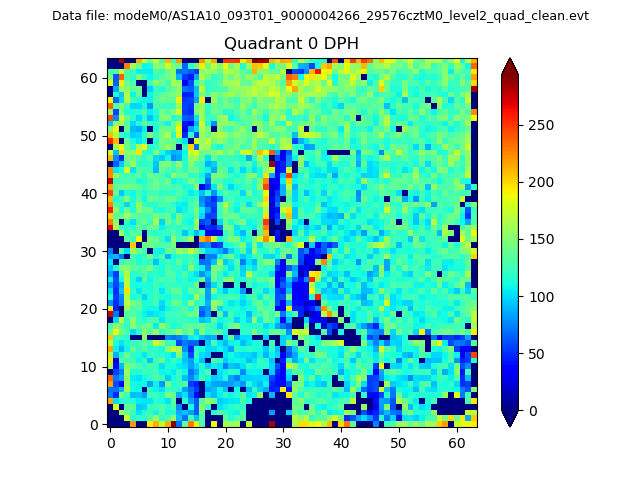 |
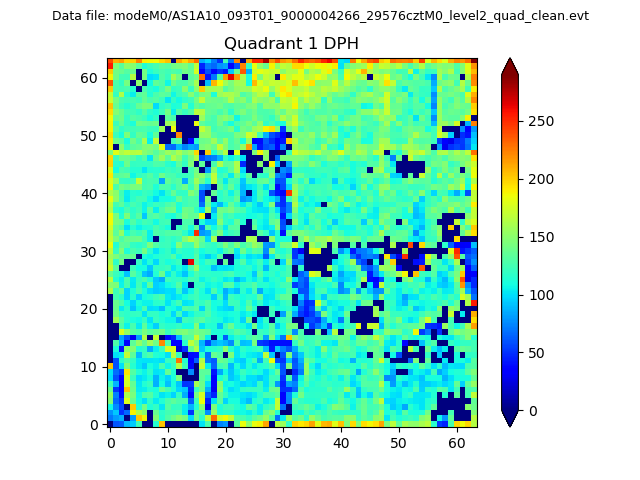 |
Quadrant B |
|---|---|---|---|
| Quadrant D | 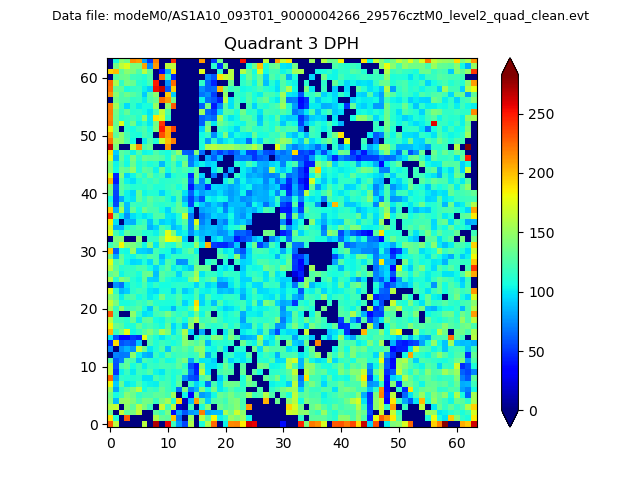 |
 |
Quadrant C |
| Plot type | Count rate plots | Images |
|---|---|---|
| Comparison with Poisson distribution Blue bars denote a histogram of data divided into 1 sec bins. Red curve is a Poisson curve with rate = median count rate of data. |
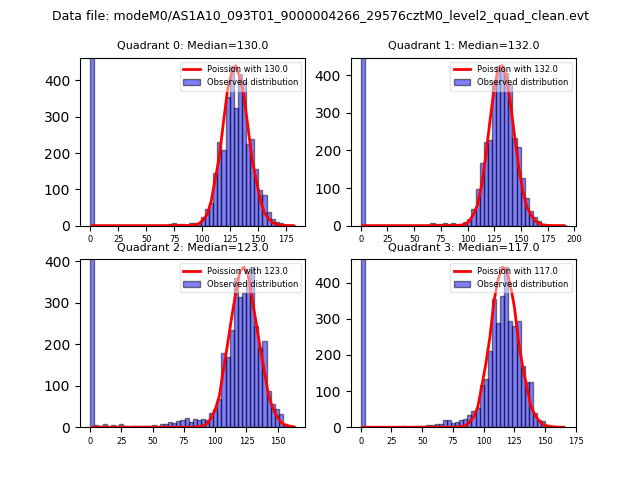 |
 |
| Quadrant-wise count rates Data is divided into 100 sec bins |
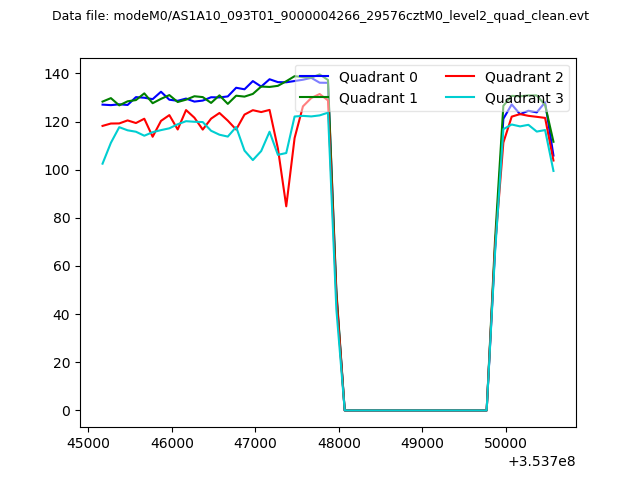 |
|
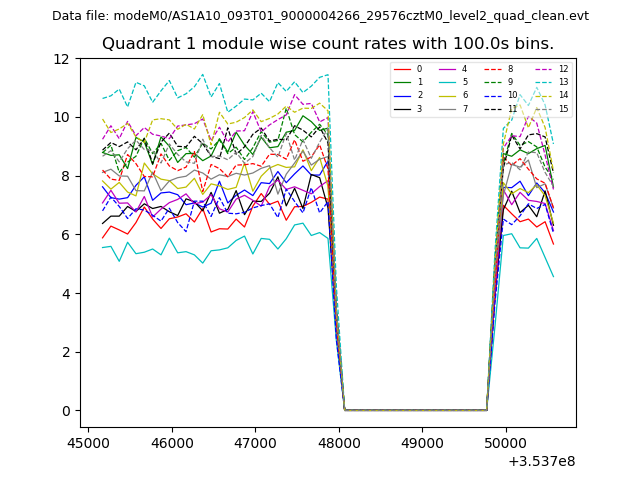
| Module-wise count rates for Quadrant A Data is divided into 100 sec bins |
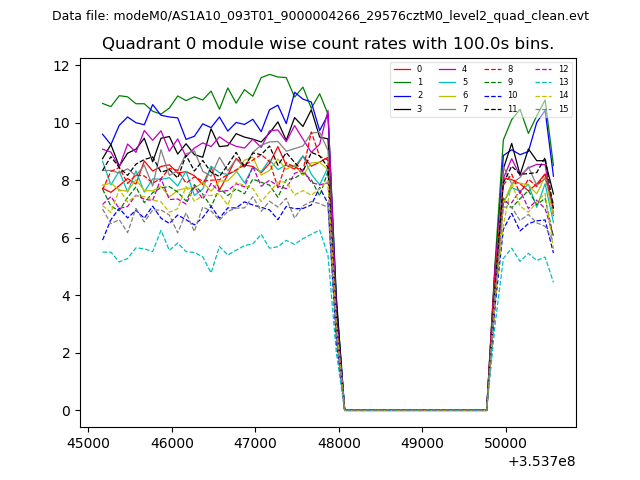 |
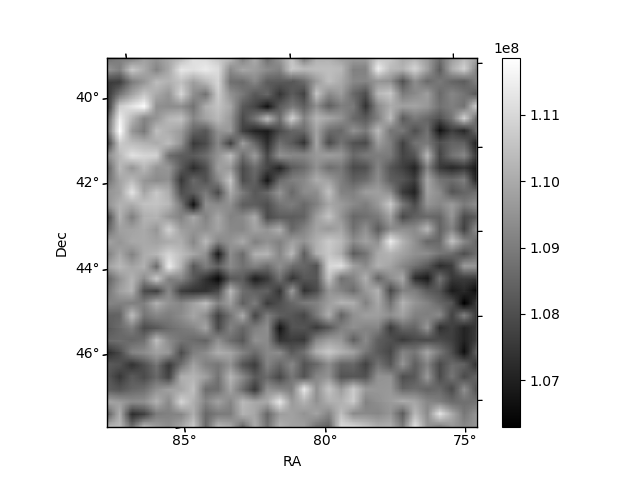 |
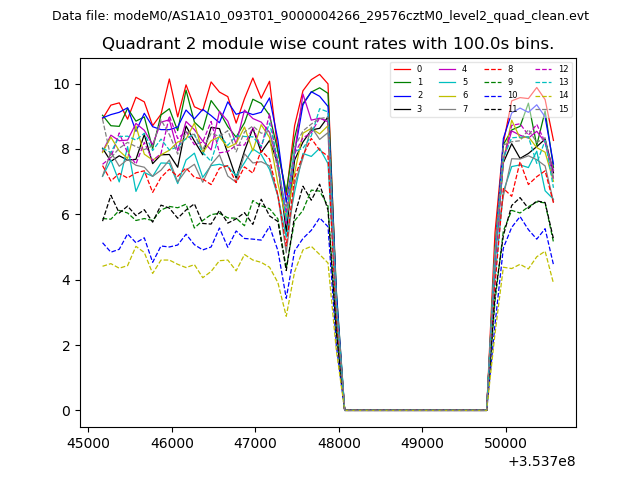
| Module-wise count rates for Quadrant B Data is divided into 100 sec bins |
 |
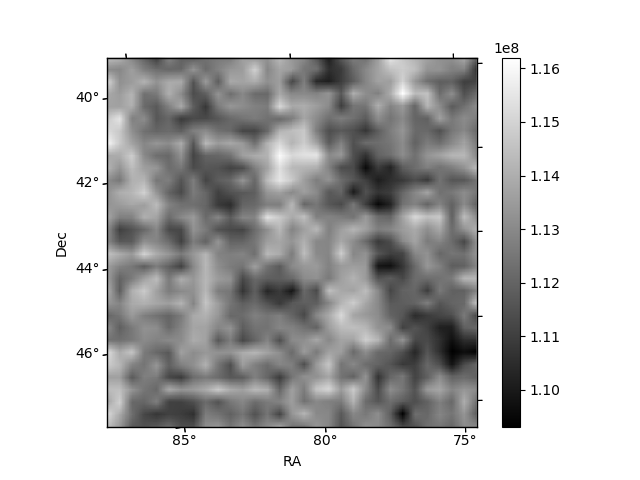 |
| Module-wise count rates for Quadrant C Data is divided into 100 sec bins |
 |
 |
| Module-wise count rates for Quadrant D Data is divided into 100 sec bins |
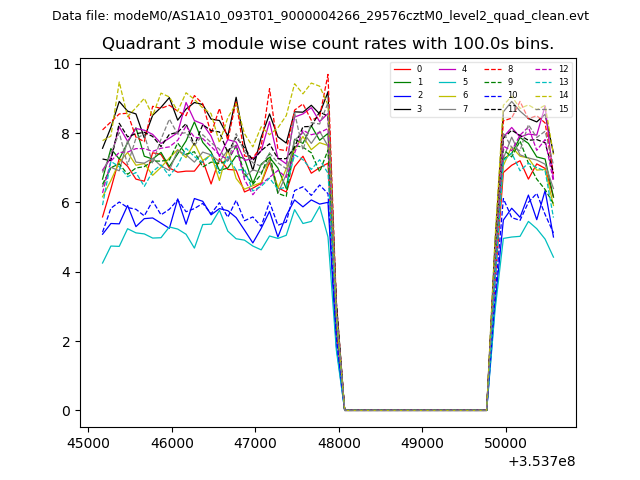 |
 |
| Parameter | Plot |
|---|---|
| CZT HV Monitor | 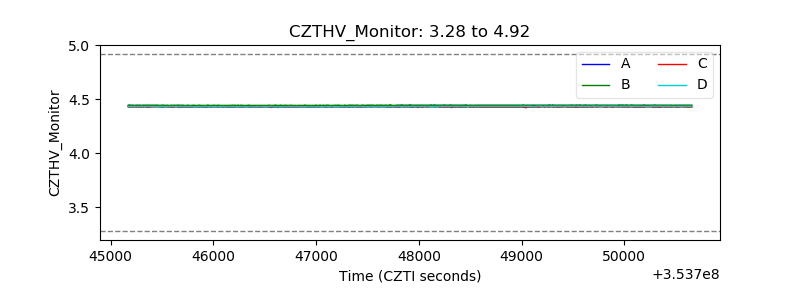 |
| D_VDD | 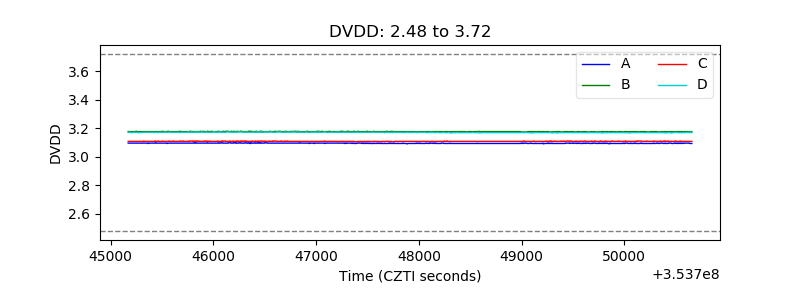 |
| Temperature 1 | 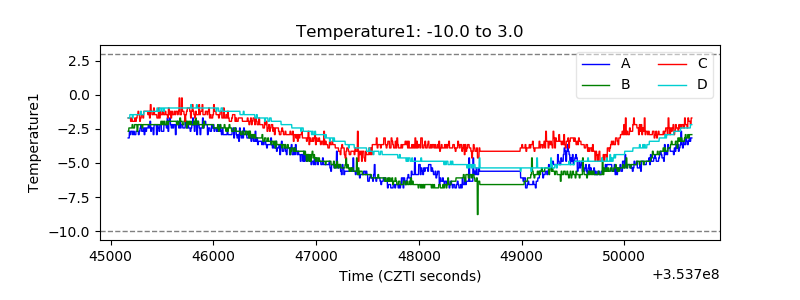 |
| Veto HV Monitor | 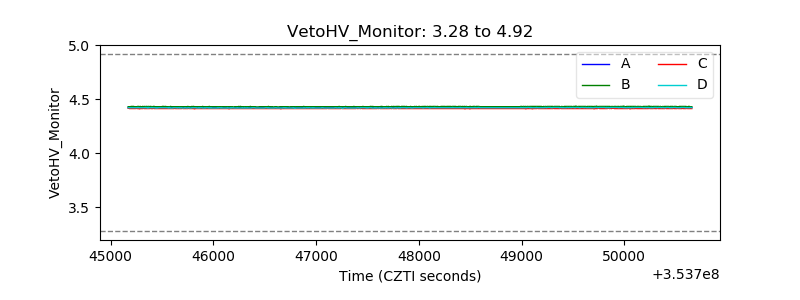 |
| Veto LLD | 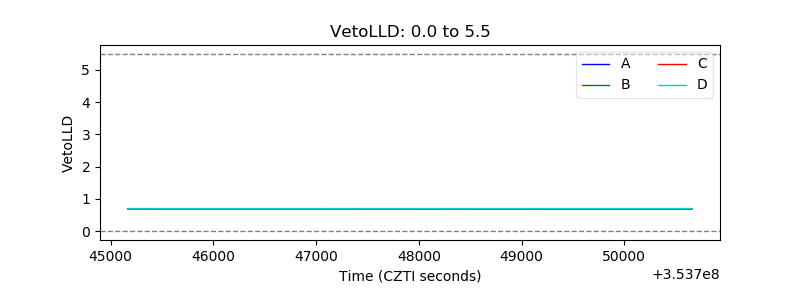 |
| Alpha Counter | 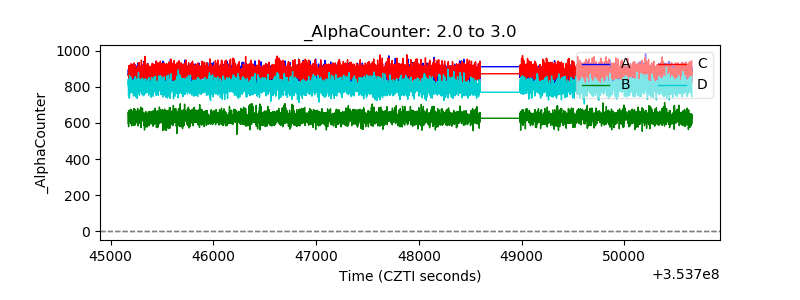 |
| _CPM_Rate | 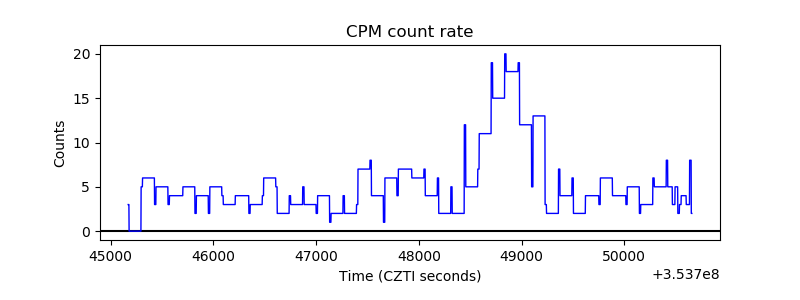 |
| CZT Counter | 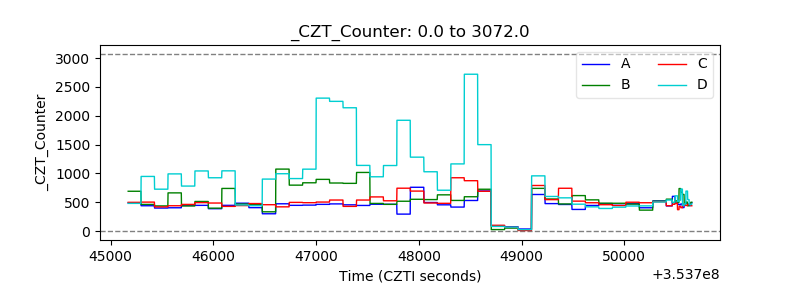 |
| +2.5 Volts monitor |  |
| +5 Volts monitor | 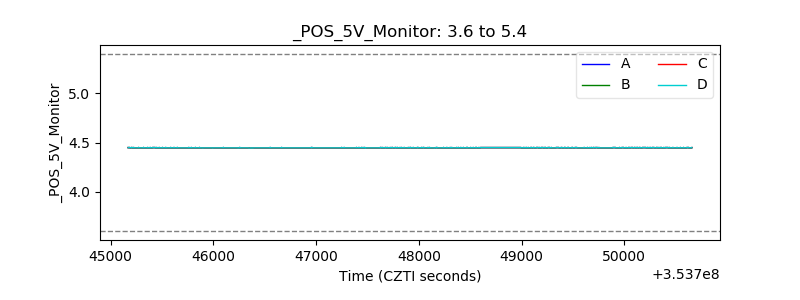 |
| _ROLL_ROT | 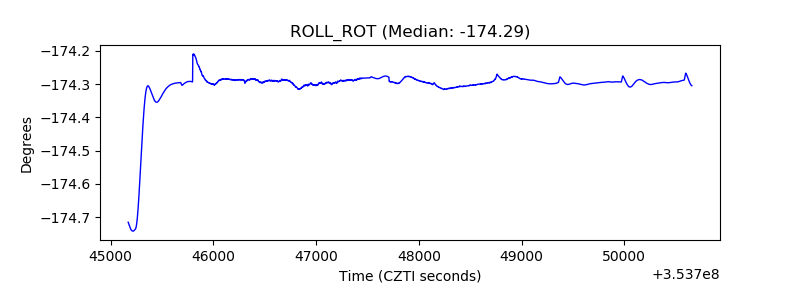 |
| _Roll_DEC | 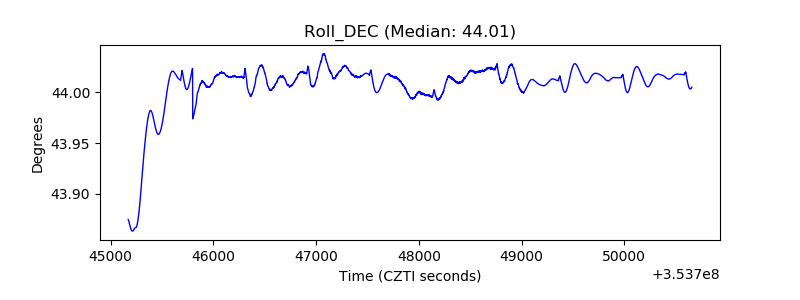 |
| _Roll_RA | 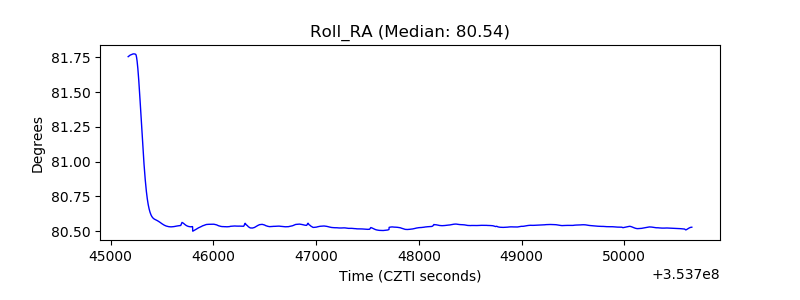 |
| Veto Counter | 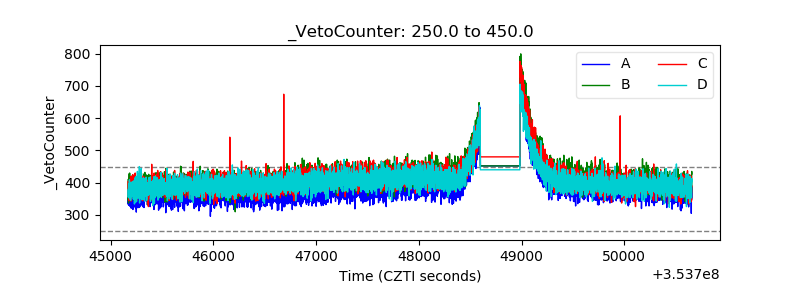 |