| Param | Original file | Final file |
|---|---|---|
| Filename | modeM0/AS1A10_093T01_9000004266_29577cztM0_level2.evt | modeM0/AS1A10_093T01_9000004266_29577cztM0_level2_quad_clean.evt |
| Size (bytes) | 553,210,560 | 98,879,040 |
| Size | 527.6 MB | 94.3 MB |
| Events in quadrant A | 3,431,154 | 646,015 |
| Events in quadrant B | 3,964,460 | 656,523 |
| Events in quadrant C | 3,682,145 | 600,428 |
| Events in quadrant D | 5,184,514 | 587,343 |
| Mode M0 | |||
|---|---|---|---|
| Quadrant | BADHDUFLAG | Total packets | Discarded packets |
| A | 0 | 14942 | 2 |
| B | 0 | 16332 | 2 |
| C | 0 | 15684 | 2 |
| D | 0 | 20168 | 2 |
| Mode SS | |||
|---|---|---|---|
| Quadrant | BADHDUFLAG | Total packets | Discarded packets |
| A | 0 | 146 | 0 |
| B | 0 | 146 | 0 |
| C | 0 | 146 | 0 |
| D | 0 | 146 | 0 |
| Quadrant | Total seconds | Saturated seconds | Saturation percentage |
|---|---|---|---|
| A | 7237 | 216 | 2.984662% |
| B | 7238 | 291 | 4.020448% |
| C | 7238 | 640 | 8.842222% |
| D | 7238 | 216 | 2.984250% |
Noise dominated data is calculated using 1-second bins in cleaned event files. If a bin has >2000 counts, and if more than 50% of those come from <1% of pixels, then it is considered to be noise-dominated and hence unusable.
| Quadrant | # 1 sec bins | Bins with >0 counts | Bins with >2000 counts | High rate bins dominated by noise | Noise dominated (total time) | Noise dominated (detector-on time) | Marked lightcurve |
|---|---|---|---|---|---|---|---|
| A | 7267 | 7239 | 0 | 0 | 0.00% | 0.00% | 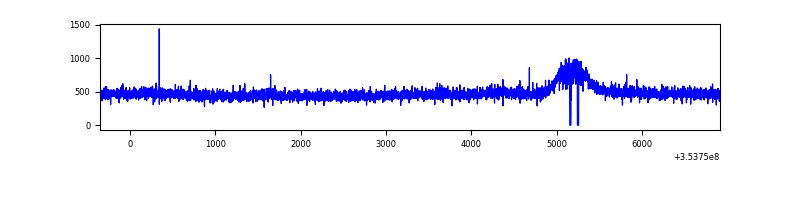 |
| B | 7268 | 7240 | 40 | 40 | 0.55% | 0.55% | 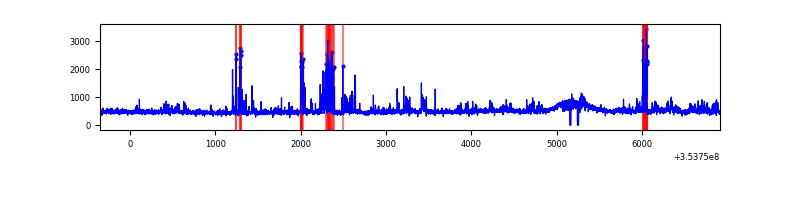 |
| C | 7268 | 7240 | 0 | 0 | 0.00% | 0.00% | 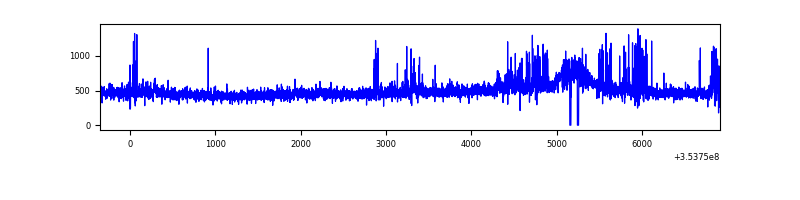 |
| D | 7268 | 7240 | 56 | 56 | 0.77% | 0.77% | 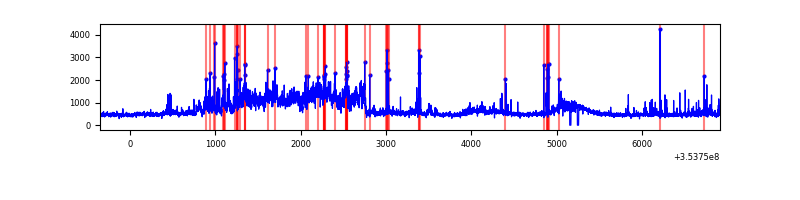 |
Top three noisy pixels from each quadrant. If the there are fewer than three noisy pixels in the level2.evt file, extra rows are filled as -1
| Pixel properties | Quadrant properties | ||||||
|---|---|---|---|---|---|---|---|
| Quadrant | DetID | PixID | Counts | Sigma | Mean | Median | Sigma |
| A | 13 | 254 | 13121 | 67.99 | 886 | 866 | 180.2 |
| A | 3 | 137 | 9134 | 45.87 | 886 | 866 | 180.2 |
| A | 0 | 13 | 8721 | 43.58 | 886 | 866 | 180.2 |
| B | 0 | 189 | 371072 | 2173.78 | 876 | 853 | 170.3 |
| B | 0 | 230 | 58235 | 336.92 | 876 | 853 | 170.3 |
| B | 0 | 156 | 35170 | 201.5 | 876 | 853 | 170.3 |
| C | 14 | 238 | 262960 | 1368.49 | 817 | 822 | 191.6 |
| C | 14 | 254 | 184848 | 960.7 | 817 | 822 | 191.6 |
| C | 3 | 233 | 35629 | 181.71 | 817 | 822 | 191.6 |
| D | 12 | 33 | 1334456 | 6564.04 | 852 | 826 | 203.2 |
| D | 8 | 195 | 206132 | 1010.5 | 852 | 826 | 203.2 |
| D | 13 | 104 | 150793 | 738.13 | 852 | 826 | 203.2 |
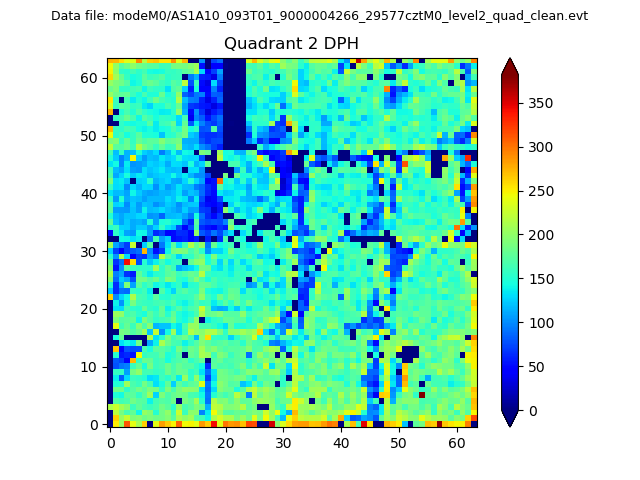
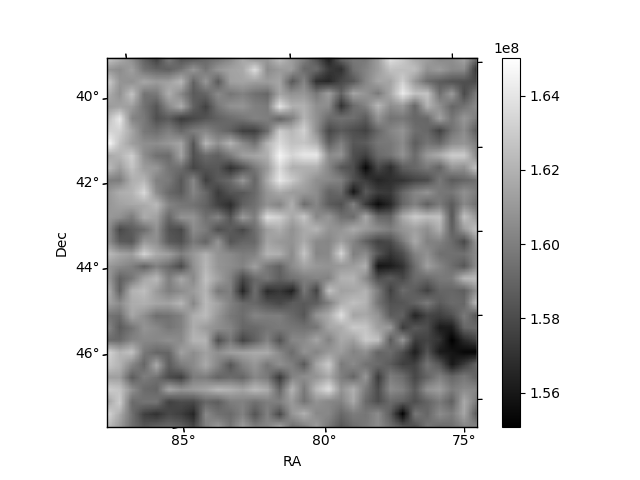
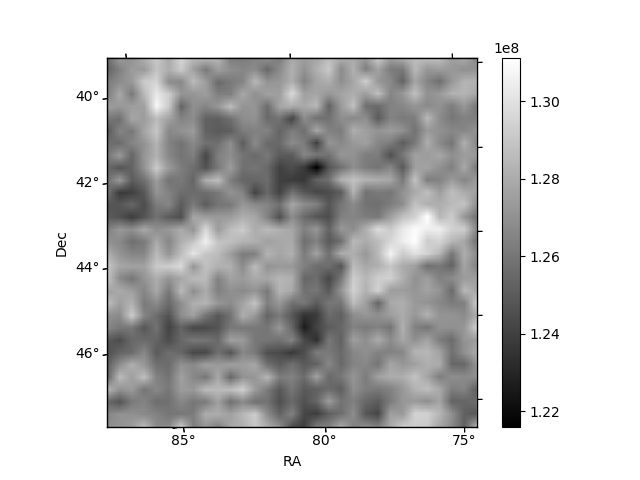
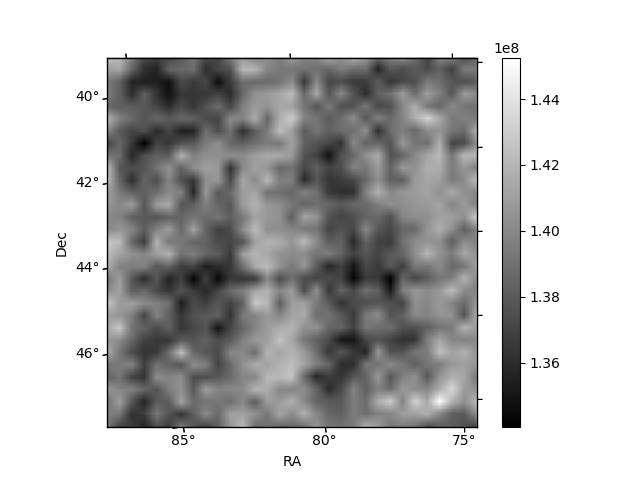
Histogram calculated using DETX and DETY for each event in the final _common_clean file
| Quadrant A | 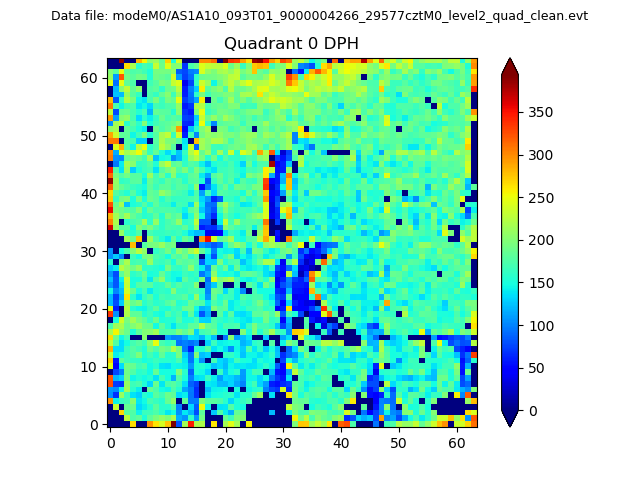 |
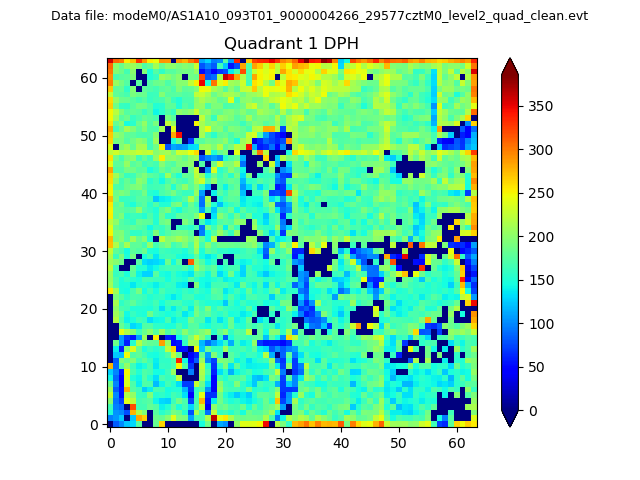 |
Quadrant B |
|---|---|---|---|
| Quadrant D | 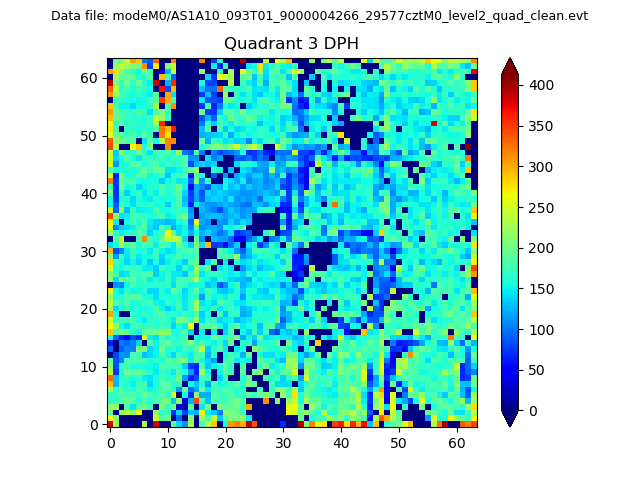 |
 |
Quadrant C |
| Plot type | Count rate plots | Images |
|---|---|---|
| Comparison with Poisson distribution Blue bars denote a histogram of data divided into 1 sec bins. Red curve is a Poisson curve with rate = median count rate of data. |
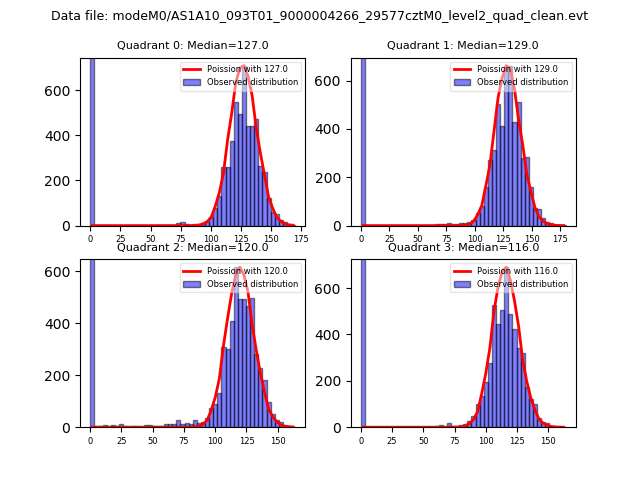 |
 |
| Quadrant-wise count rates Data is divided into 100 sec bins |
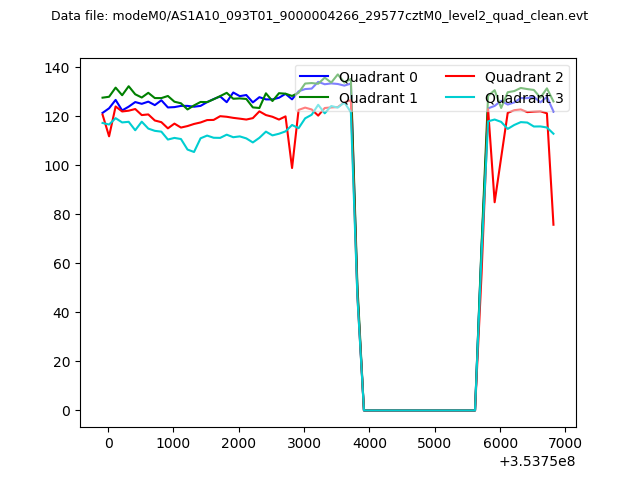 |
|
| Module-wise count rates for Quadrant A Data is divided into 100 sec bins |
 |
 |
| Module-wise count rates for Quadrant B Data is divided into 100 sec bins |
 |
 |
| Module-wise count rates for Quadrant C Data is divided into 100 sec bins |
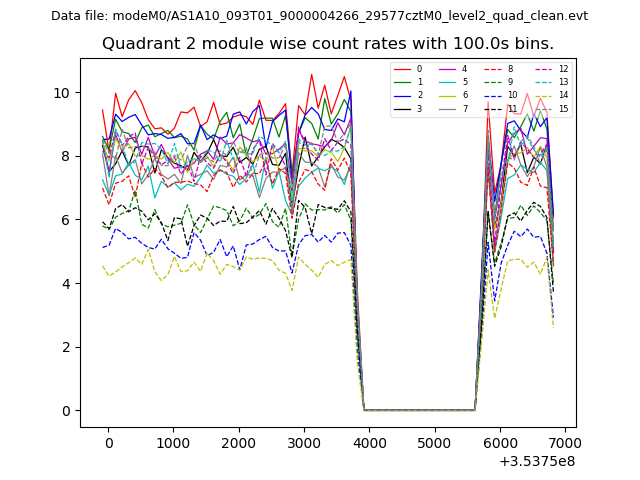 |
 |
| Module-wise count rates for Quadrant D Data is divided into 100 sec bins |
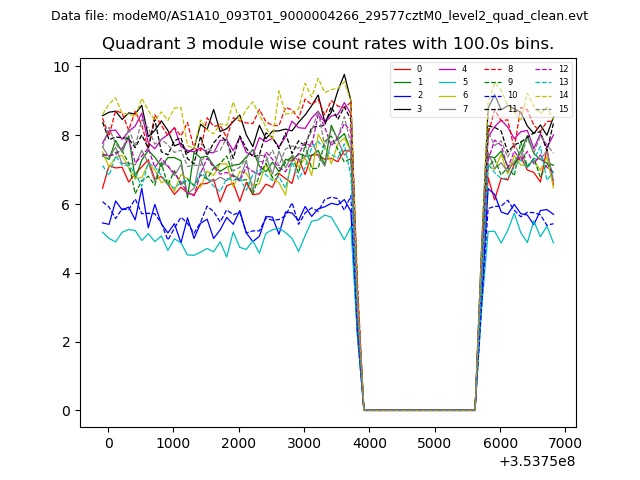 |
 |
| Parameter | Plot |
|---|---|
| CZT HV Monitor | 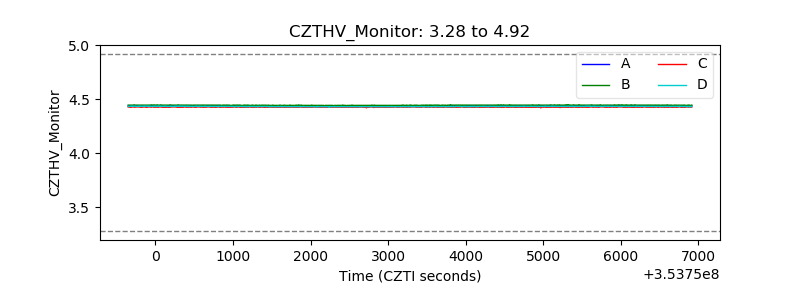 |
| D_VDD | 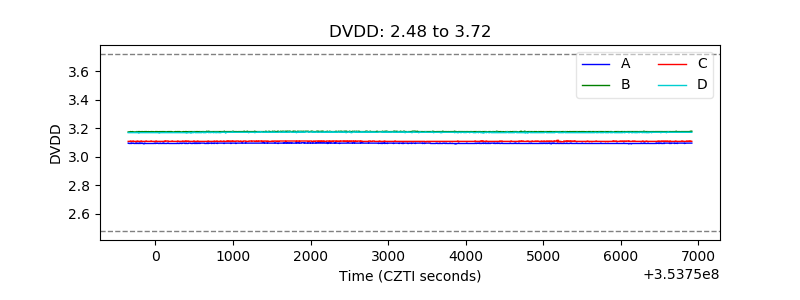 |
| Temperature 1 |  |
| Veto HV Monitor | 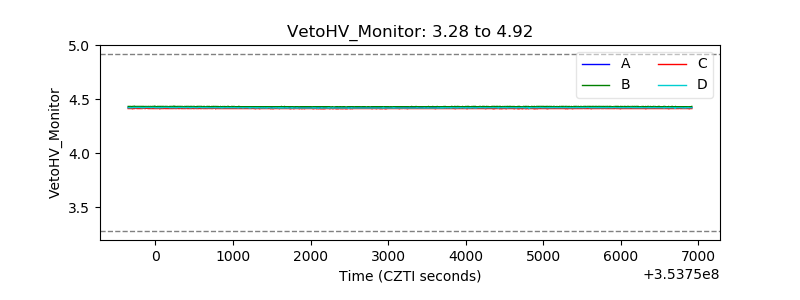 |
| Veto LLD |  |
| Alpha Counter | 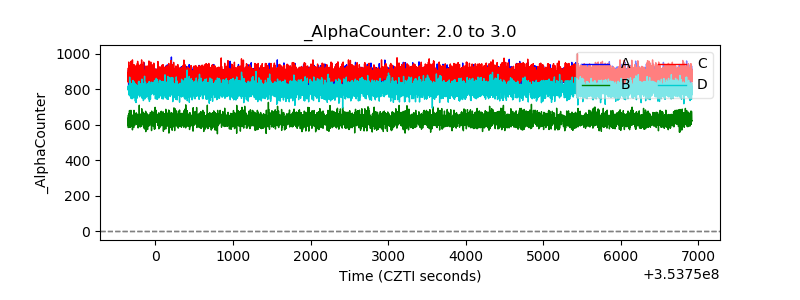 |
| _CPM_Rate | 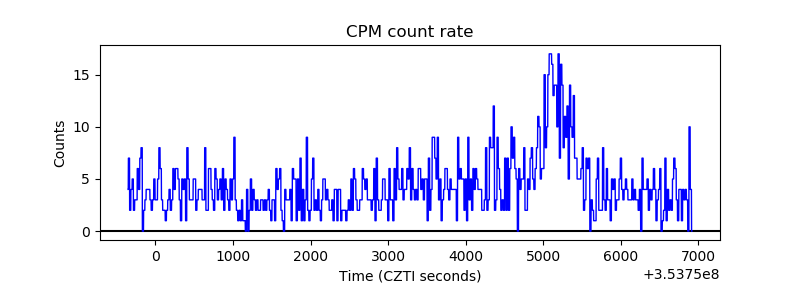 |
| CZT Counter | 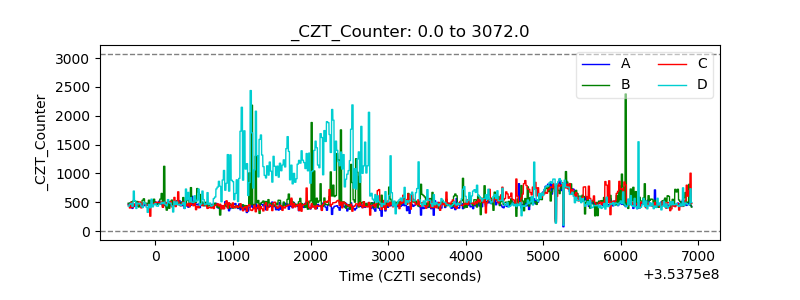 |
| +2.5 Volts monitor |  |
| +5 Volts monitor | 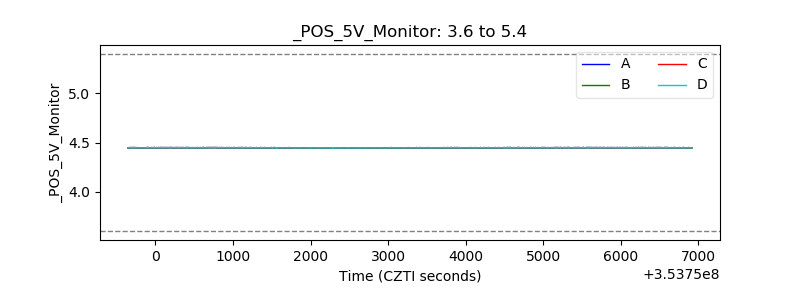 |
| _ROLL_ROT |  |
| _Roll_DEC | 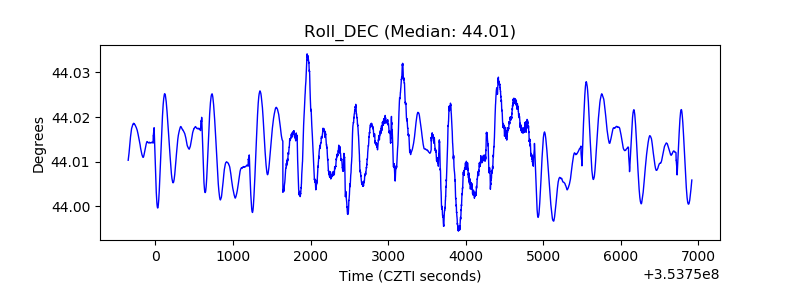 |
| _Roll_RA | 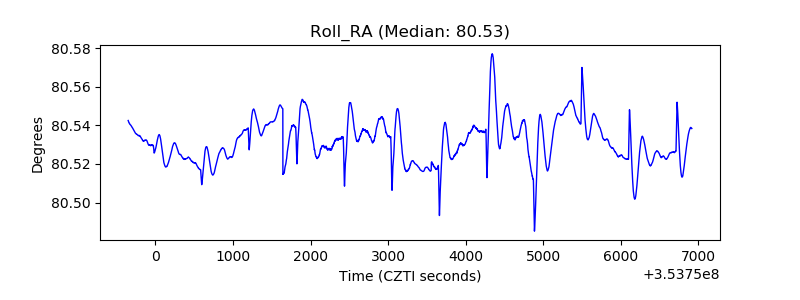 |
| Veto Counter | 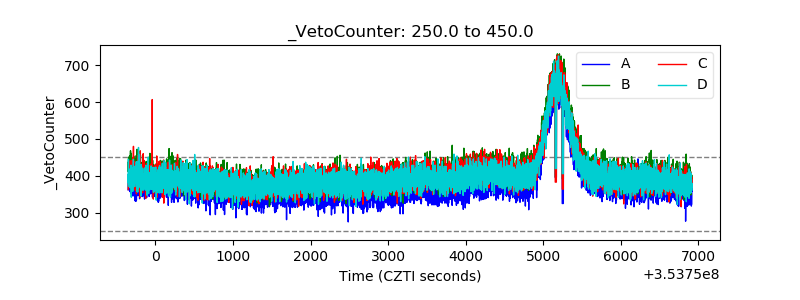 |