| Param | Original file | Final file |
|---|---|---|
| Filename | modeM0/AS1A10_093T01_9000004266_29580cztM0_level2.evt | modeM0/AS1A10_093T01_9000004266_29580cztM0_level2_quad_clean.evt |
| Size (bytes) | 844,122,240 | 136,157,760 |
| Size | 805.0 MB | 129.9 MB |
| Events in quadrant A | 5,078,101 | 880,137 |
| Events in quadrant B | 7,463,156 | 872,495 |
| Events in quadrant C | 5,477,165 | 815,629 |
| Events in quadrant D | 6,813,280 | 805,599 |
| Mode M9 | |||
|---|---|---|---|
| Quadrant | BADHDUFLAG | Total packets | Discarded packets |
| A | 0 | 9 | 0 |
| B | 0 | 9 | 0 |
| C | 0 | 9 | 0 |
| D | 0 | 9 | 0 |
| Mode M0 | |||
|---|---|---|---|
| Quadrant | BADHDUFLAG | Total packets | Discarded packets |
| A | 0 | 22462 | 1 |
| B | 0 | 29503 | 1 |
| C | 0 | 23225 | 1 |
| D | 0 | 27167 | 1 |
| Mode SS | |||
|---|---|---|---|
| Quadrant | BADHDUFLAG | Total packets | Discarded packets |
| A | 0 | 218 | 0 |
| B | 0 | 218 | 0 |
| C | 0 | 218 | 0 |
| D | 0 | 218 | 0 |
| Quadrant | Total seconds | Saturated seconds | Saturation percentage |
|---|---|---|---|
| A | 10834 | 101 | 0.932250% |
| B | 10835 | 306 | 2.824181% |
| C | 10835 | 637 | 5.879096% |
| D | 10835 | 253 | 2.335025% |
Noise dominated data is calculated using 1-second bins in cleaned event files. If a bin has >2000 counts, and if more than 50% of those come from <1% of pixels, then it is considered to be noise-dominated and hence unusable.
| Quadrant | # 1 sec bins | Bins with >0 counts | Bins with >2000 counts | High rate bins dominated by noise | Noise dominated (total time) | Noise dominated (detector-on time) | Marked lightcurve |
|---|---|---|---|---|---|---|---|
| A | 11348 | 10834 | 9 | 9 | 0.08% | 0.08% | 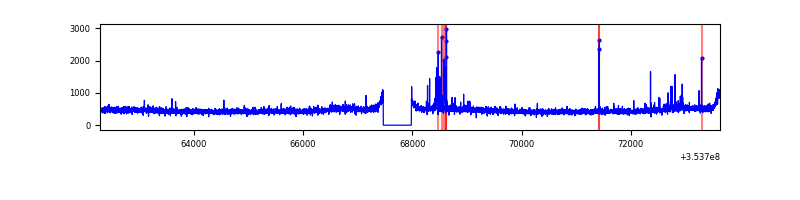 |
| B | 11349 | 10835 | 157 | 157 | 1.38% | 1.45% |  |
| C | 11349 | 10834 | 7 | 7 | 0.06% | 0.06% | 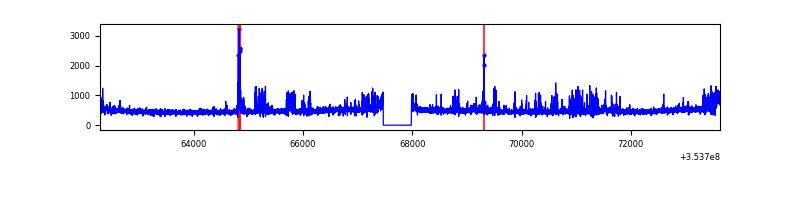 |
| D | 11349 | 10835 | 171 | 171 | 1.51% | 1.58% | 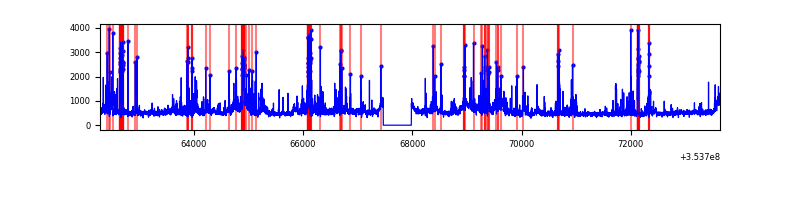 |
Top three noisy pixels from each quadrant. If the there are fewer than three noisy pixels in the level2.evt file, extra rows are filled as -1
| Pixel properties | Quadrant properties | ||||||
|---|---|---|---|---|---|---|---|
| Quadrant | DetID | PixID | Counts | Sigma | Mean | Median | Sigma |
| A | 12 | 96 | 112563 | 430.37 | 1274 | 1245 | 258.7 |
| A | 0 | 13 | 36967 | 138.11 | 1274 | 1245 | 258.7 |
| A | 13 | 254 | 19079 | 68.95 | 1274 | 1245 | 258.7 |
| B | 0 | 189 | 1899176 | 7895.65 | 1260 | 1226 | 240.4 |
| B | 4 | 171 | 441333 | 1830.89 | 1260 | 1226 | 240.4 |
| B | 0 | 156 | 52920 | 215.05 | 1260 | 1226 | 240.4 |
| C | 14 | 238 | 360290 | 1284.85 | 1198 | 1207 | 279.5 |
| C | 14 | 254 | 236290 | 841.16 | 1198 | 1207 | 279.5 |
| C | 3 | 233 | 123700 | 438.3 | 1198 | 1207 | 279.5 |
| D | 8 | 195 | 627358 | 2159.18 | 1227 | 1194 | 290.0 |
| D | 12 | 33 | 462317 | 1590.07 | 1227 | 1194 | 290.0 |
| D | 13 | 153 | 337428 | 1159.42 | 1227 | 1194 | 290.0 |
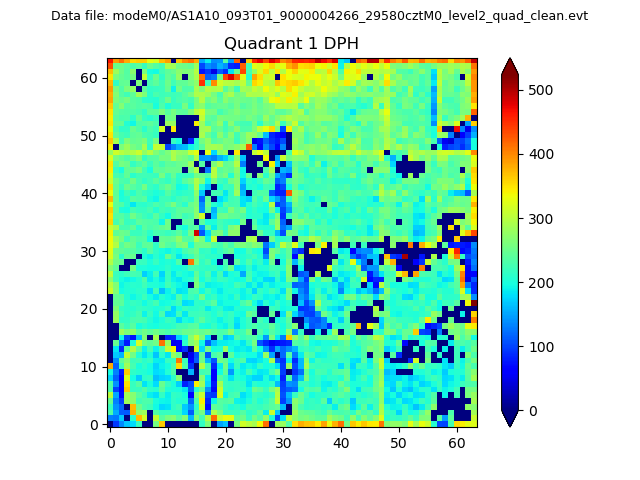
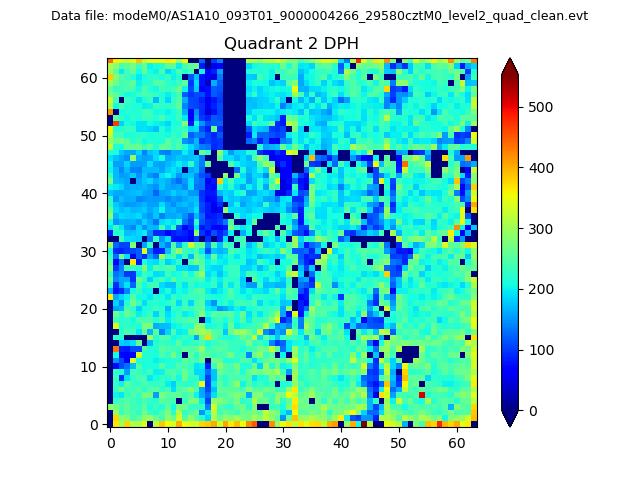
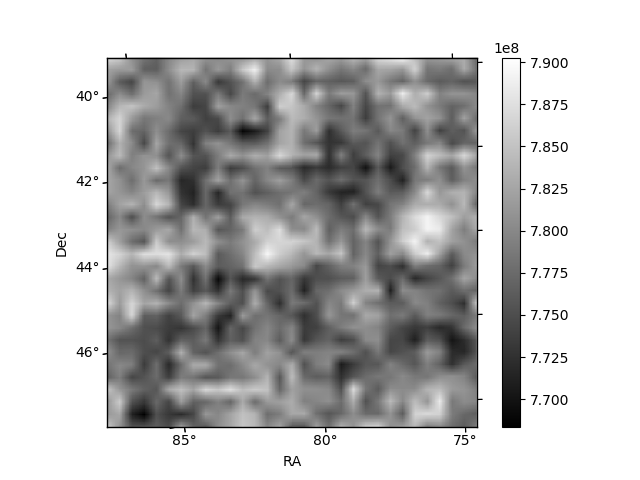
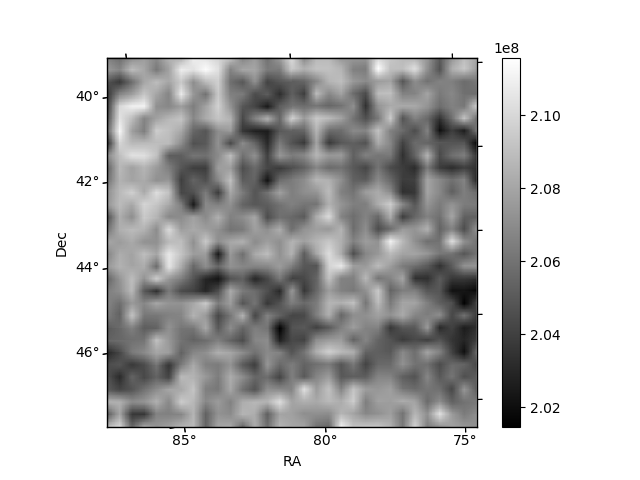
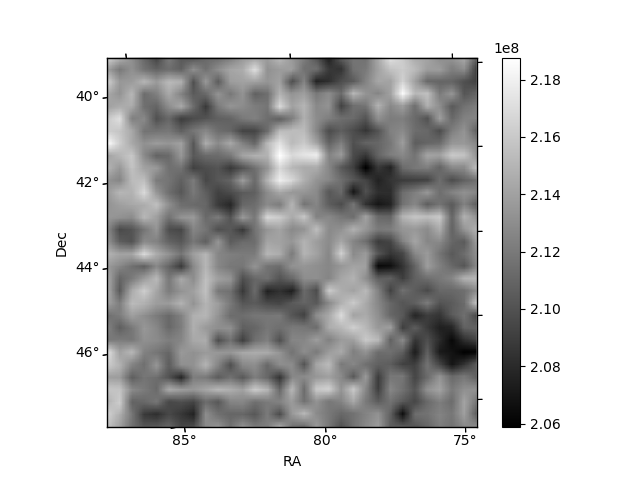
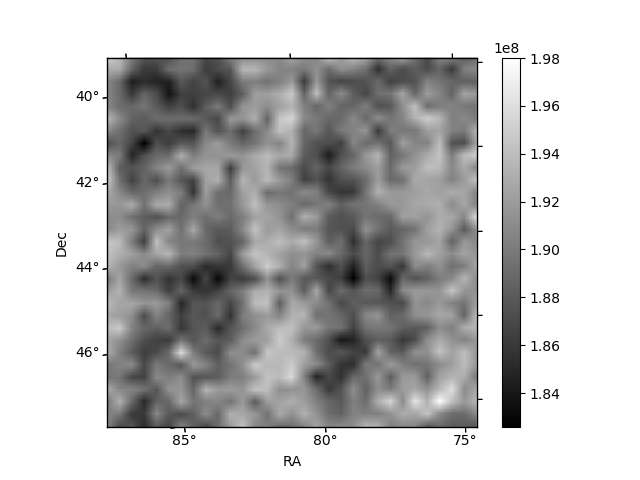
Histogram calculated using DETX and DETY for each event in the final _common_clean file
| Quadrant A | 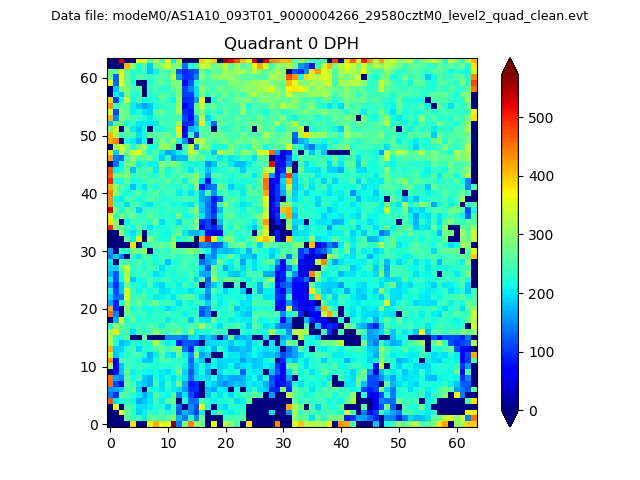 |
 |
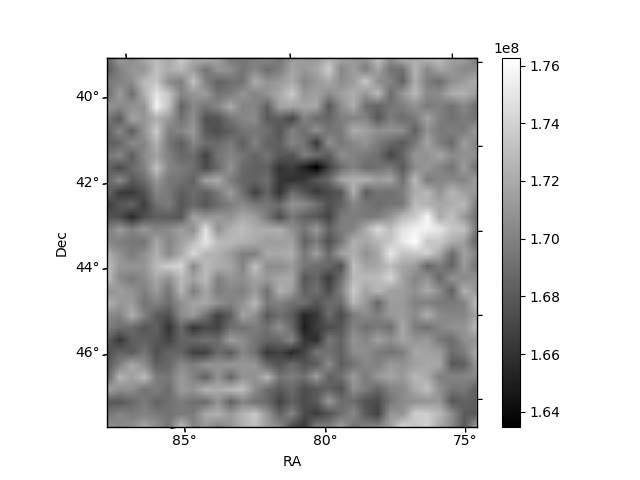
Quadrant B |
|---|---|---|---|
| Quadrant D | 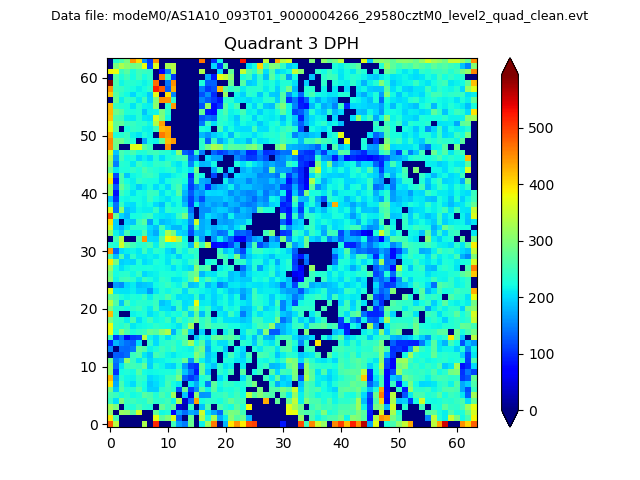 |
 |
Quadrant C |
| Plot type | Count rate plots | Images |
|---|---|---|
| Comparison with Poisson distribution Blue bars denote a histogram of data divided into 1 sec bins. Red curve is a Poisson curve with rate = median count rate of data. |
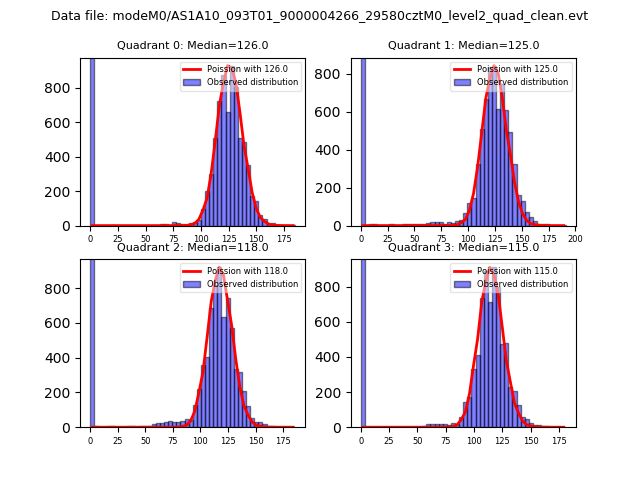 |
 |
| Quadrant-wise count rates Data is divided into 100 sec bins |
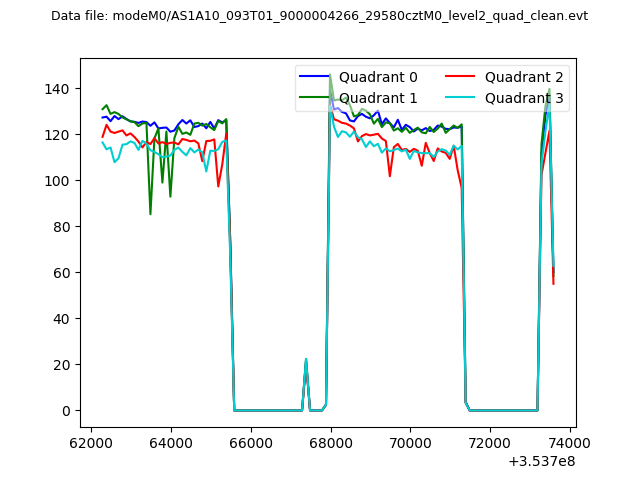 |
|
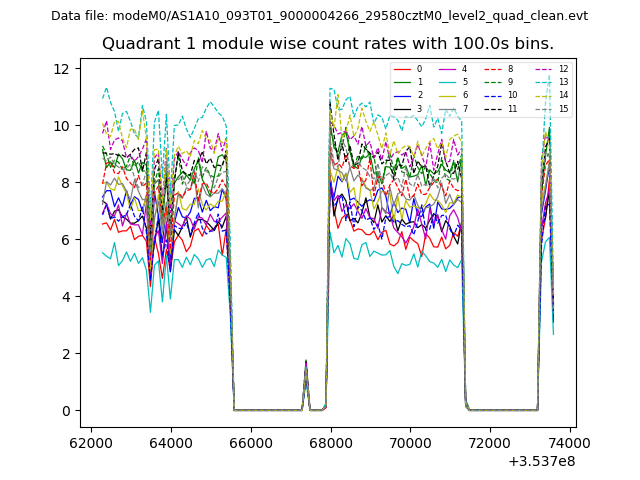
| Module-wise count rates for Quadrant A Data is divided into 100 sec bins |
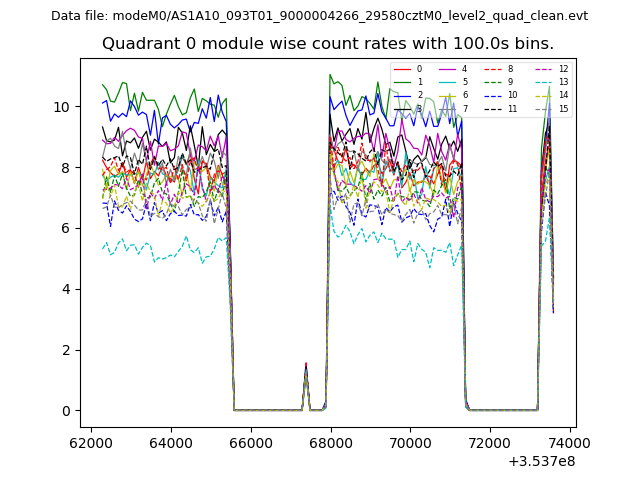 |
 |
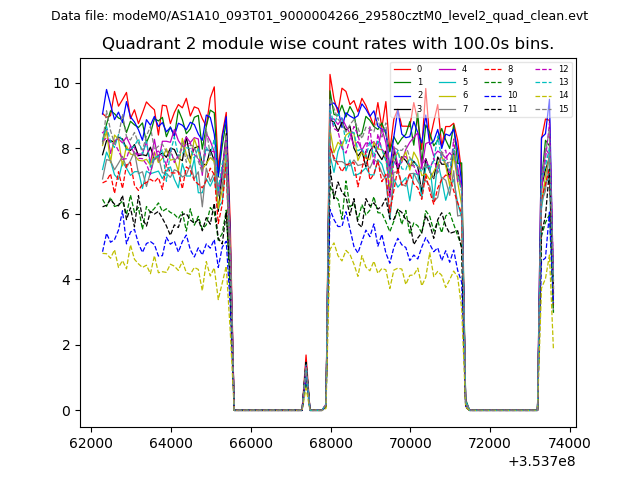
| Module-wise count rates for Quadrant B Data is divided into 100 sec bins |
 |
 |
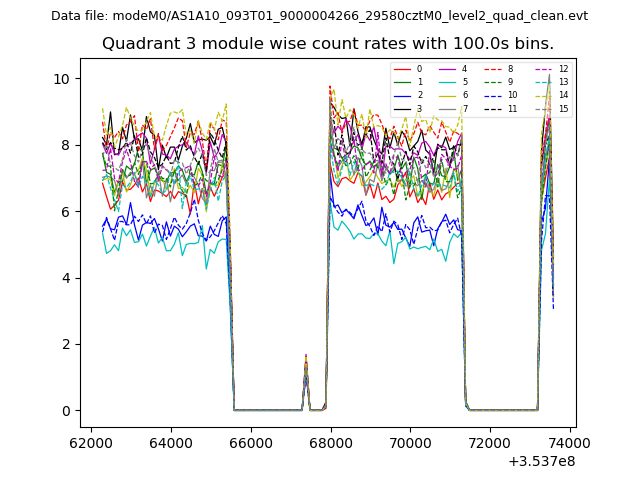
| Module-wise count rates for Quadrant C Data is divided into 100 sec bins |
 |
 |
| Module-wise count rates for Quadrant D Data is divided into 100 sec bins |
 |
 |
| Parameter | Plot |
|---|---|
| CZT HV Monitor | 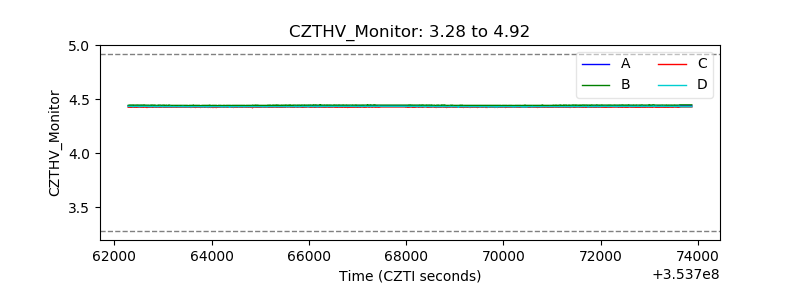 |
| D_VDD | 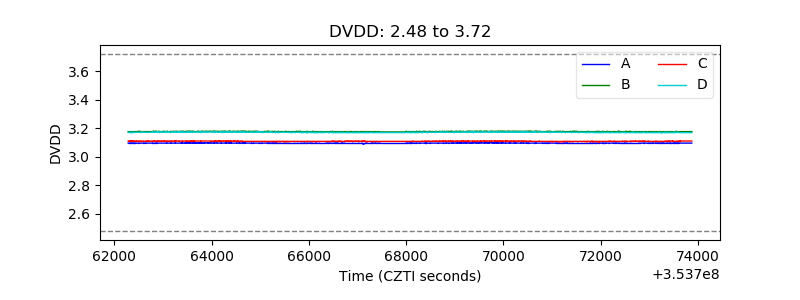 |
| Temperature 1 | 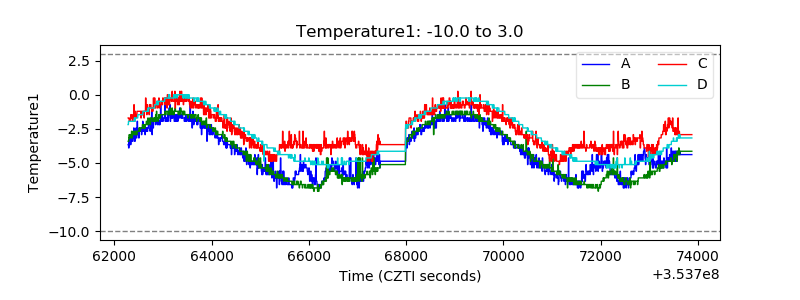 |
| Veto HV Monitor | 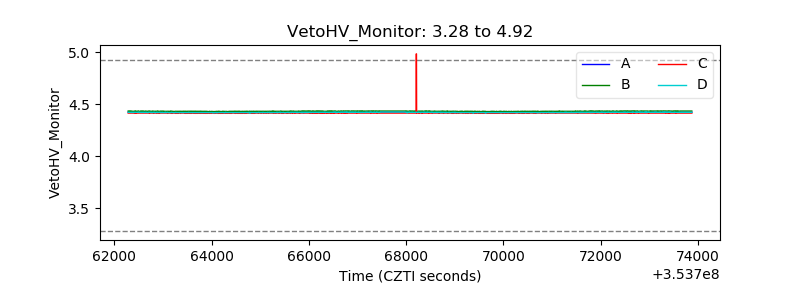 |
| Veto LLD | 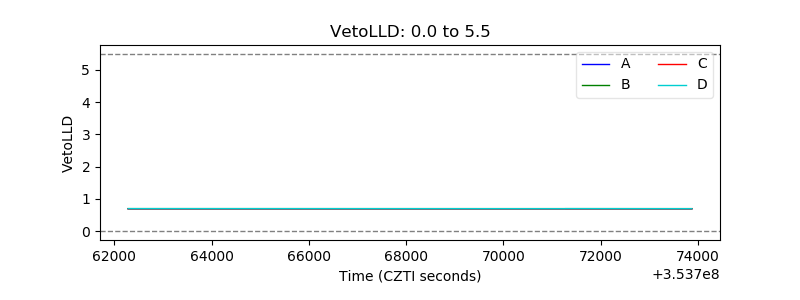 |
| Alpha Counter | 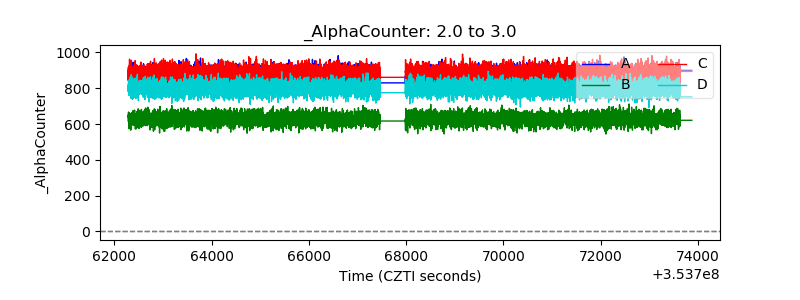 |
| _CPM_Rate | 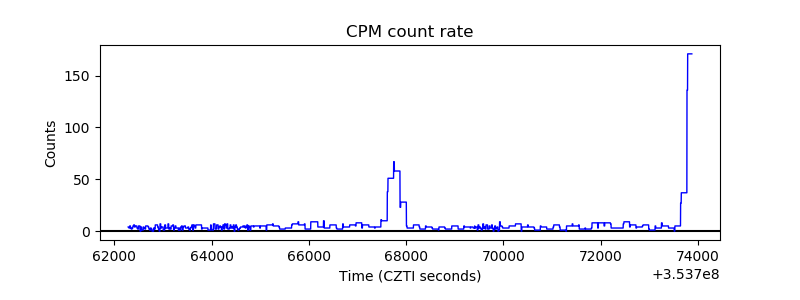 |
| CZT Counter | 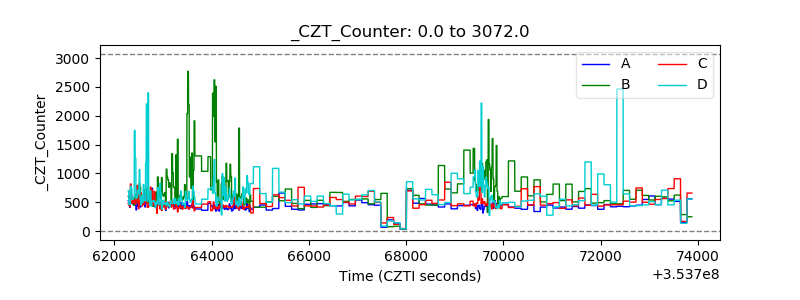 |
| +2.5 Volts monitor |  |
| +5 Volts monitor |  |
| _ROLL_ROT | 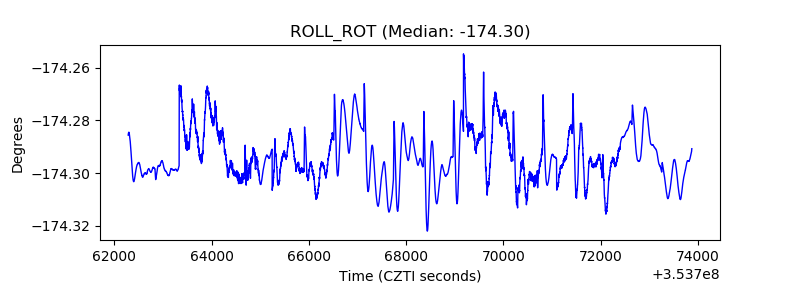 |
| _Roll_DEC |  |
| _Roll_RA | 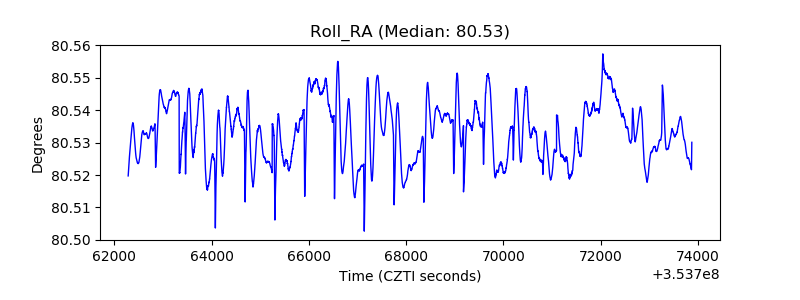 |
| Veto Counter | 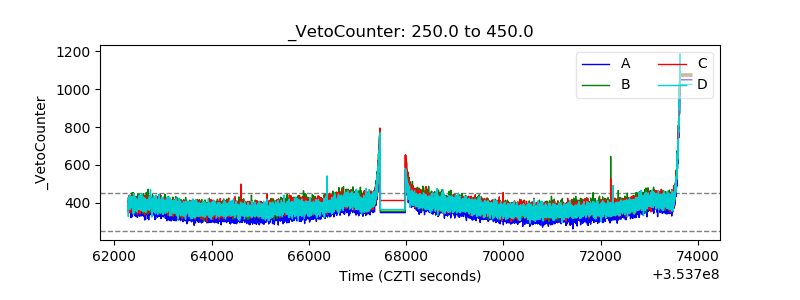 |