| Param | Original file | Final file |
|---|---|---|
| Filename | modeM0/AS1A10_093T01_9000004266_29581cztM0_level2.evt | modeM0/AS1A10_093T01_9000004266_29581cztM0_level2_quad_clean.evt |
| Size (bytes) | 633,199,680 | 98,020,800 |
| Size | 603.9 MB | 93.5 MB |
| Events in quadrant A | 3,232,427 | 653,523 |
| Events in quadrant B | 5,964,830 | 642,832 |
| Events in quadrant C | 3,536,648 | 610,912 |
| Events in quadrant D | 5,976,750 | 581,156 |
| Mode M9 | |||
|---|---|---|---|
| Quadrant | BADHDUFLAG | Total packets | Discarded packets |
| A | 0 | 15 | 0 |
| B | 0 | 15 | 0 |
| C | 0 | 15 | 0 |
| D | 0 | 15 | 0 |
| Mode M0 | |||
|---|---|---|---|
| Quadrant | BADHDUFLAG | Total packets | Discarded packets |
| A | 0 | 14162 | 1 |
| B | 0 | 22500 | 1 |
| C | 0 | 14788 | 1 |
| D | 0 | 22336 | 1 |
| Mode SS | |||
|---|---|---|---|
| Quadrant | BADHDUFLAG | Total packets | Discarded packets |
| A | 0 | 140 | 0 |
| B | 0 | 140 | 0 |
| C | 0 | 140 | 0 |
| D | 0 | 140 | 0 |
| Quadrant | Total seconds | Saturated seconds | Saturation percentage |
|---|---|---|---|
| A | 6889 | 46 | 0.667731% |
| B | 6889 | 352 | 5.109595% |
| C | 6889 | 421 | 6.111192% |
| D | 6888 | 506 | 7.346109% |
Noise dominated data is calculated using 1-second bins in cleaned event files. If a bin has >2000 counts, and if more than 50% of those come from <1% of pixels, then it is considered to be noise-dominated and hence unusable.
| Quadrant | # 1 sec bins | Bins with >0 counts | Bins with >2000 counts | High rate bins dominated by noise | Noise dominated (total time) | Noise dominated (detector-on time) | Marked lightcurve |
|---|---|---|---|---|---|---|---|
| A | 8334 | 6890 | 0 | 0 | 0.00% | 0.00% | 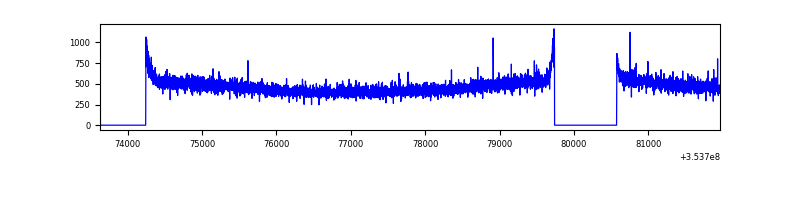 |
| B | 8334 | 6890 | 107 | 107 | 1.28% | 1.55% | 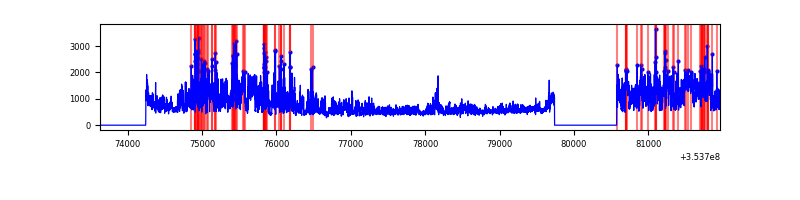 |
| C | 8334 | 6890 | 2 | 2 | 0.02% | 0.03% | 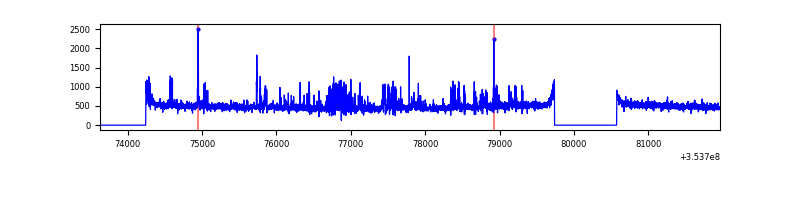 |
| D | 8333 | 6889 | 442 | 442 | 5.30% | 6.42% | 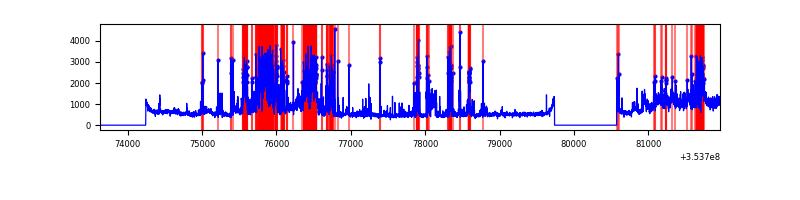 |
Top three noisy pixels from each quadrant. If the there are fewer than three noisy pixels in the level2.evt file, extra rows are filled as -1
| Pixel properties | Quadrant properties | ||||||
|---|---|---|---|---|---|---|---|
| Quadrant | DetID | PixID | Counts | Sigma | Mean | Median | Sigma |
| A | 13 | 254 | 11985 | 66.52 | 832 | 813 | 167.9 |
| A | 3 | 137 | 8086 | 43.31 | 832 | 813 | 167.9 |
| A | 12 | 189 | 8053 | 43.11 | 832 | 813 | 167.9 |
| B | 0 | 189 | 2565634 | 16401.75 | 819 | 796 | 156.4 |
| B | 4 | 171 | 112249 | 712.72 | 819 | 796 | 156.4 |
| B | 12 | 111 | 19085 | 116.96 | 819 | 796 | 156.4 |
| C | 14 | 238 | 232968 | 1265.5 | 782 | 788 | 183.5 |
| C | 14 | 254 | 154066 | 835.44 | 782 | 788 | 183.5 |
| C | 3 | 233 | 57046 | 306.63 | 782 | 788 | 183.5 |
| D | 13 | 153 | 1059199 | 5632.06 | 792 | 772 | 187.9 |
| D | 12 | 33 | 667058 | 3545.41 | 792 | 772 | 187.9 |
| D | 7 | 80 | 645645 | 3431.47 | 792 | 772 | 187.9 |
Histogram calculated using DETX and DETY for each event in the final _common_clean file
| Quadrant A |  |
 |
Quadrant B |
|---|---|---|---|
| Quadrant D | 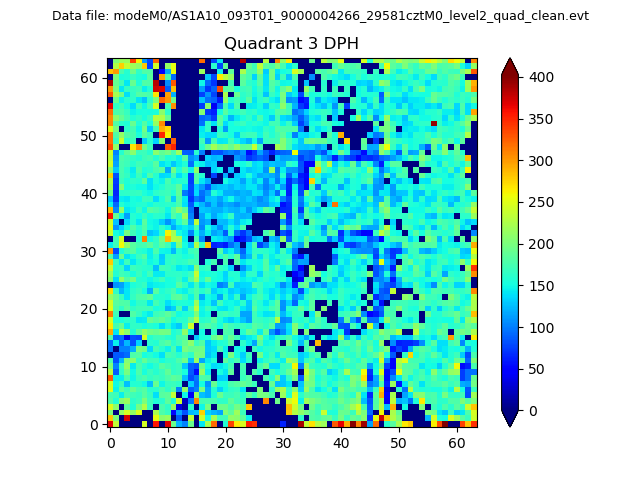 |
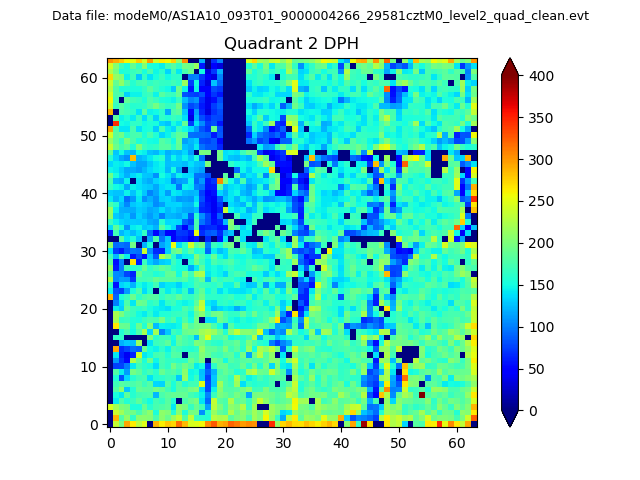 |
Quadrant C |
| Plot type | Count rate plots | Images |
|---|---|---|
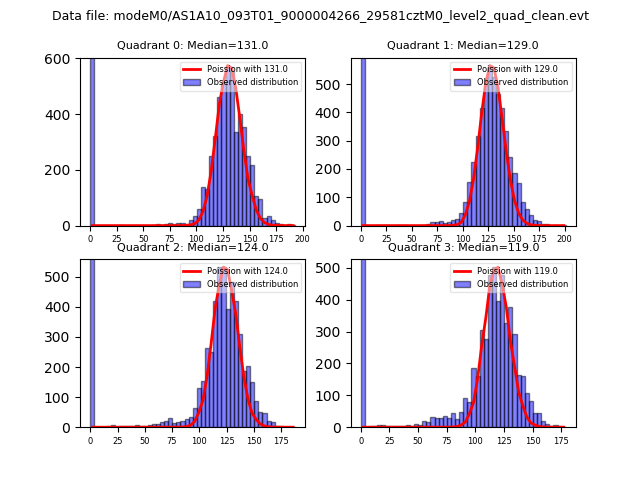
| Comparison with Poisson distribution Blue bars denote a histogram of data divided into 1 sec bins. Red curve is a Poisson curve with rate = median count rate of data. |
 |
 |
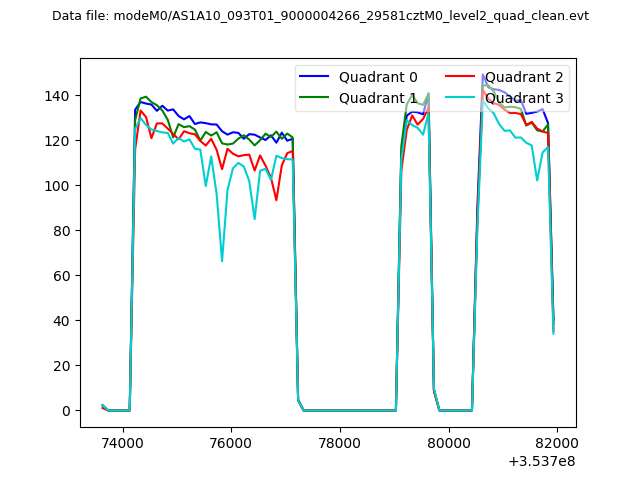
| Quadrant-wise count rates Data is divided into 100 sec bins |
 |
|
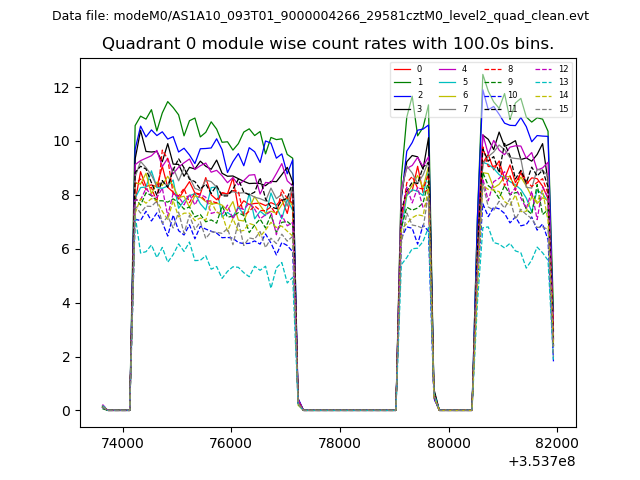
| Module-wise count rates for Quadrant A Data is divided into 100 sec bins |
 |
 |
| Module-wise count rates for Quadrant B Data is divided into 100 sec bins |
 |
 |
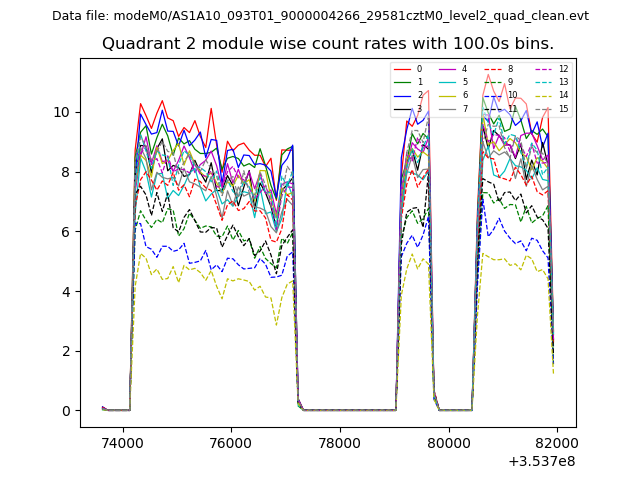
| Module-wise count rates for Quadrant C Data is divided into 100 sec bins |
 |
 |
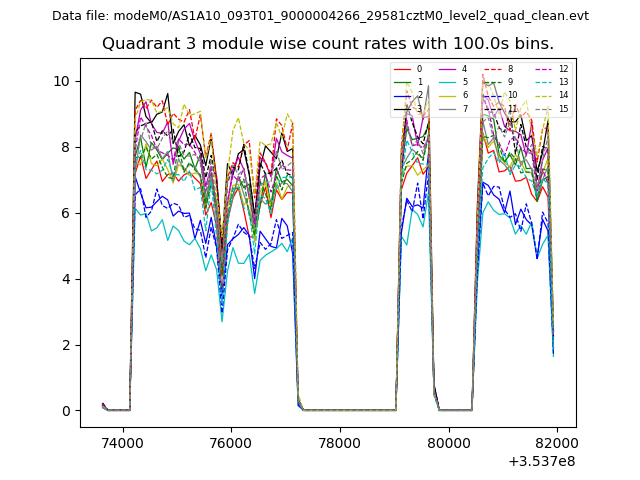
| Module-wise count rates for Quadrant D Data is divided into 100 sec bins |
 |
 |
| Parameter | Plot |
|---|---|
| CZT HV Monitor |  |
| D_VDD | 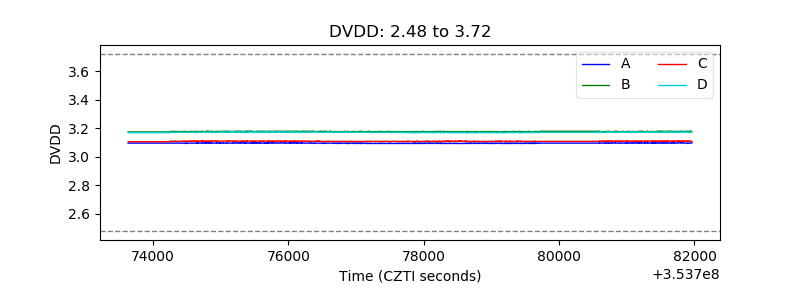 |
| Temperature 1 | 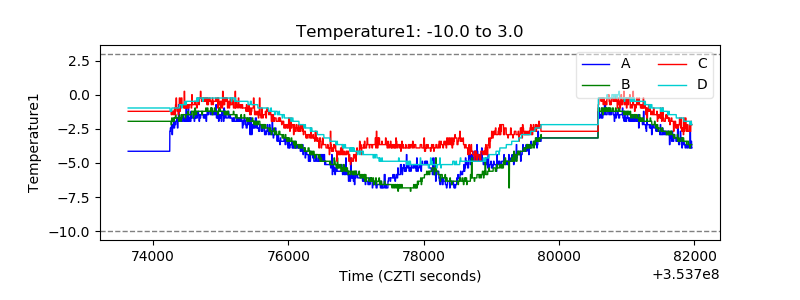 |
| Veto HV Monitor | 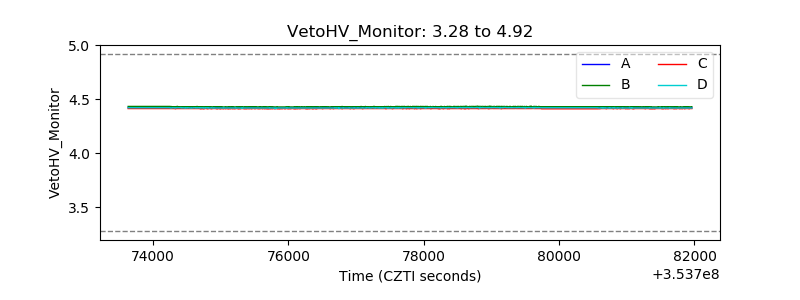 |
| Veto LLD | 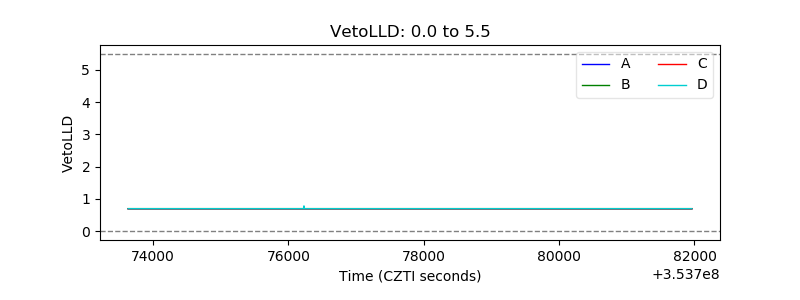 |
| Alpha Counter | 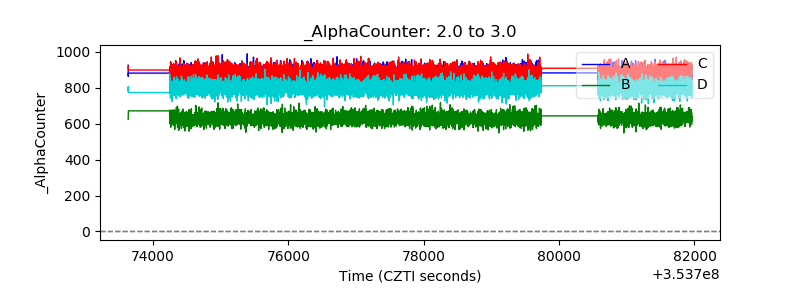 |
| _CPM_Rate |  |
| CZT Counter | 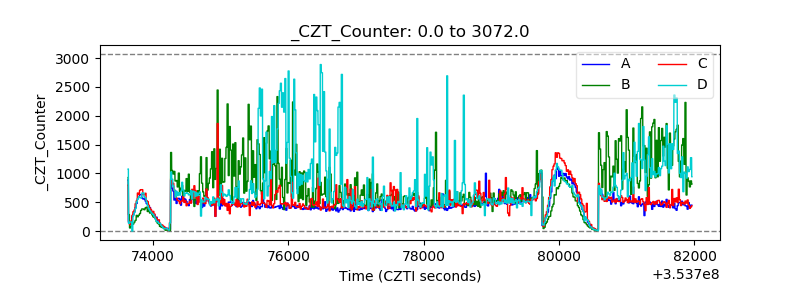 |
| +2.5 Volts monitor |  |
| +5 Volts monitor |  |
| _ROLL_ROT | 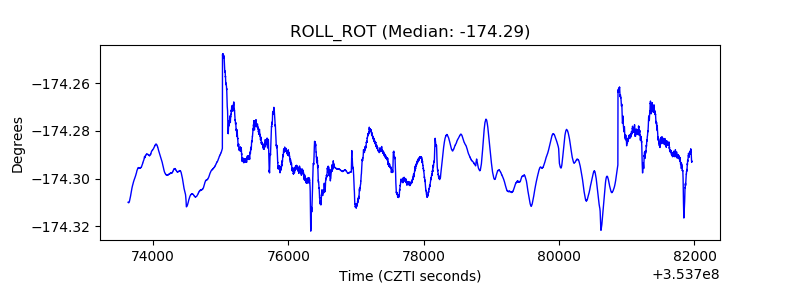 |
| _Roll_DEC | 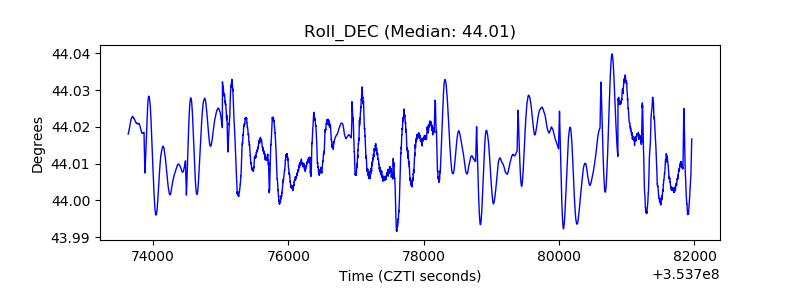 |
| _Roll_RA | 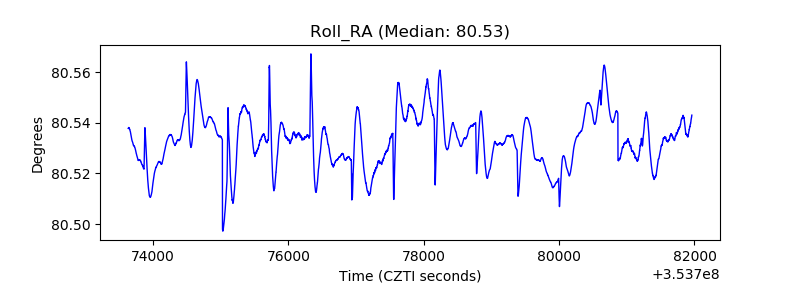 |
| Veto Counter | 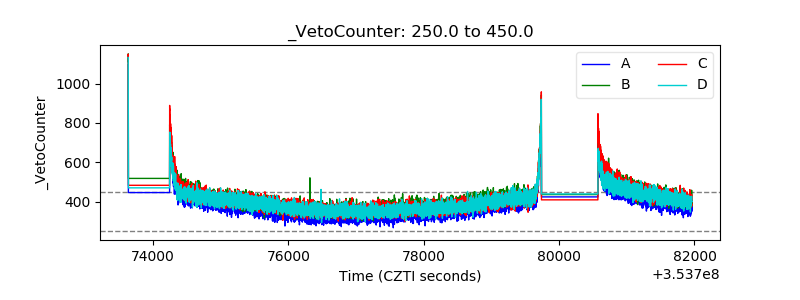 |