| Param | Original file | Final file |
|---|---|---|
| Filename | modeM0/AS1A10_093T01_9000004266_29584cztM0_level2.evt | modeM0/AS1A10_093T01_9000004266_29584cztM0_level2_quad_clean.evt |
| Size (bytes) | 690,825,600 | 94,628,160 |
| Size | 658.8 MB | 90.2 MB |
| Events in quadrant A | 3,126,685 | 650,728 |
| Events in quadrant B | 4,804,797 | 654,732 |
| Events in quadrant C | 3,456,517 | 607,368 |
| Events in quadrant D | 9,098,750 | 502,996 |
| Mode M9 | |||
|---|---|---|---|
| Quadrant | BADHDUFLAG | Total packets | Discarded packets |
| A | 0 | 11 | 0 |
| B | 0 | 11 | 0 |
| C | 0 | 11 | 0 |
| D | 0 | 11 | 0 |
| Mode M0 | |||
|---|---|---|---|
| Quadrant | BADHDUFLAG | Total packets | Discarded packets |
| A | 0 | 13462 | 1 |
| B | 0 | 18699 | 1 |
| C | 0 | 14434 | 1 |
| D | 0 | 31501 | 1 |
| Mode SS | |||
|---|---|---|---|
| Quadrant | BADHDUFLAG | Total packets | Discarded packets |
| A | 0 | 132 | 0 |
| B | 0 | 132 | 0 |
| C | 0 | 132 | 0 |
| D | 0 | 132 | 0 |
| Quadrant | Total seconds | Saturated seconds | Saturation percentage |
|---|---|---|---|
| A | 6433 | 33 | 0.512980% |
| B | 6432 | 287 | 4.462065% |
| C | 6432 | 398 | 6.187811% |
| D | 6432 | 1732 | 26.927861% |
Noise dominated data is calculated using 1-second bins in cleaned event files. If a bin has >2000 counts, and if more than 50% of those come from <1% of pixels, then it is considered to be noise-dominated and hence unusable.
| Quadrant | # 1 sec bins | Bins with >0 counts | Bins with >2000 counts | High rate bins dominated by noise | Noise dominated (total time) | Noise dominated (detector-on time) | Marked lightcurve |
|---|---|---|---|---|---|---|---|
| A | 7563 | 6434 | 2 | 2 | 0.03% | 0.03% | 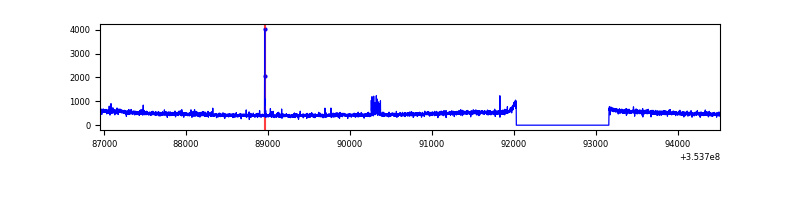 |
| B | 7562 | 6432 | 125 | 125 | 1.65% | 1.94% | 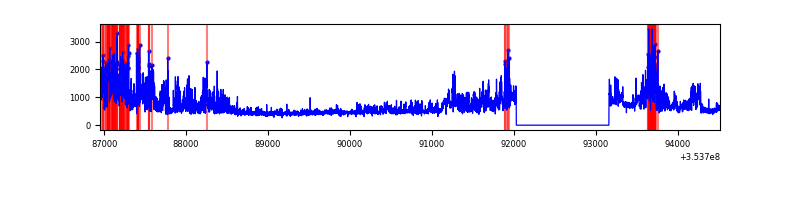 |
| C | 7561 | 6432 | 1 | 1 | 0.01% | 0.02% | 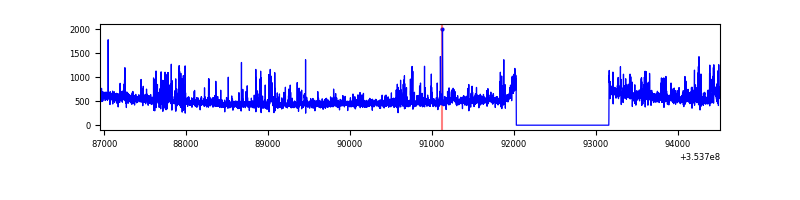 |
| D | 7562 | 6432 | 1659 | 1659 | 21.94% | 25.79% | 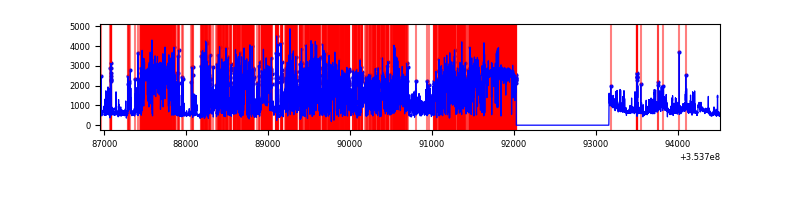 |
Top three noisy pixels from each quadrant. If the there are fewer than three noisy pixels in the level2.evt file, extra rows are filled as -1
| Pixel properties | Quadrant properties | ||||||
|---|---|---|---|---|---|---|---|
| Quadrant | DetID | PixID | Counts | Sigma | Mean | Median | Sigma |
| A | 9 | 143 | 32710 | 200.74 | 792 | 777 | 159.1 |
| A | 0 | 13 | 18764 | 113.07 | 792 | 777 | 159.1 |
| A | 1 | 113 | 12654 | 74.66 | 792 | 777 | 159.1 |
| B | 0 | 189 | 1589087 | 10712.8 | 787 | 767 | 148.3 |
| B | 5 | 172 | 56594 | 376.54 | 787 | 767 | 148.3 |
| B | 0 | 190 | 39793 | 263.22 | 787 | 767 | 148.3 |
| C | 14 | 238 | 237036 | 1354.91 | 752 | 760 | 174.4 |
| C | 14 | 254 | 163818 | 935.05 | 752 | 760 | 174.4 |
| C | 3 | 233 | 78145 | 443.76 | 752 | 760 | 174.4 |
| D | 7 | 80 | 5580002 | 34788.61 | 673 | 657 | 160.4 |
| D | 8 | 195 | 392520 | 2443.36 | 673 | 657 | 160.4 |
| D | 7 | 238 | 215024 | 1336.63 | 673 | 657 | 160.4 |
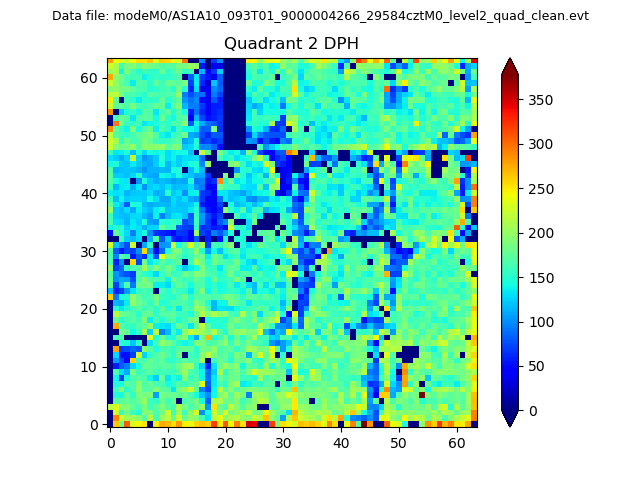
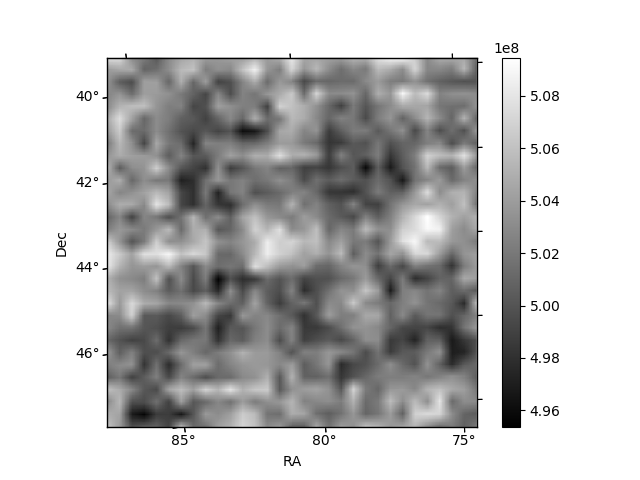
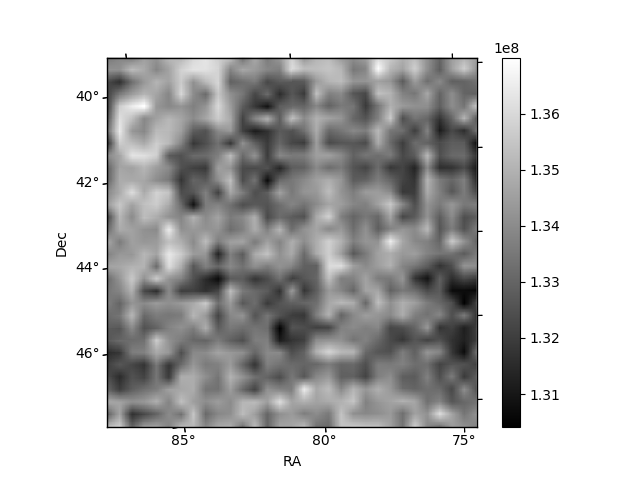
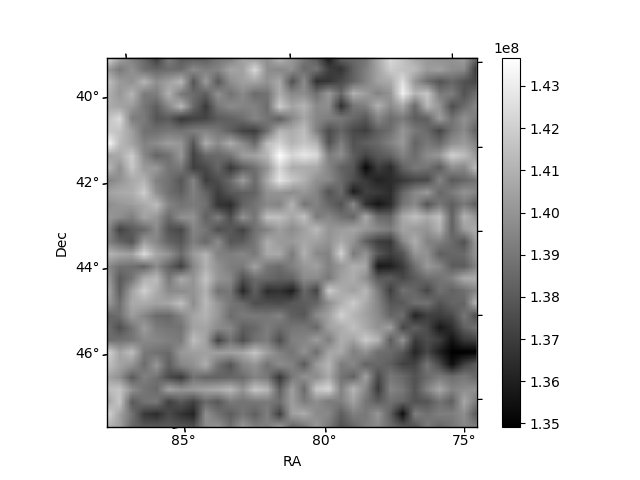
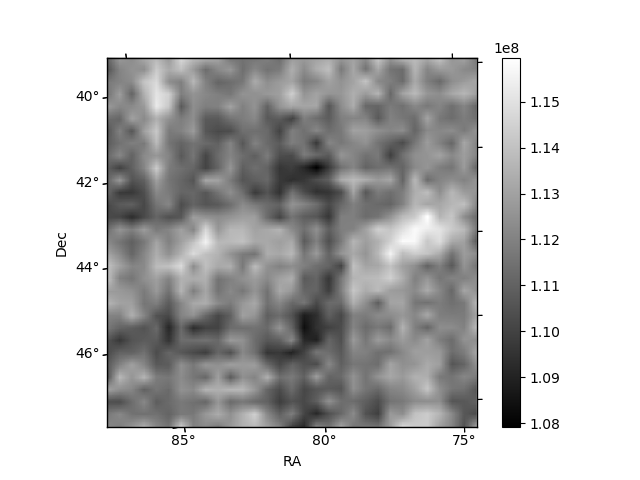
Histogram calculated using DETX and DETY for each event in the final _common_clean file
| Quadrant A | 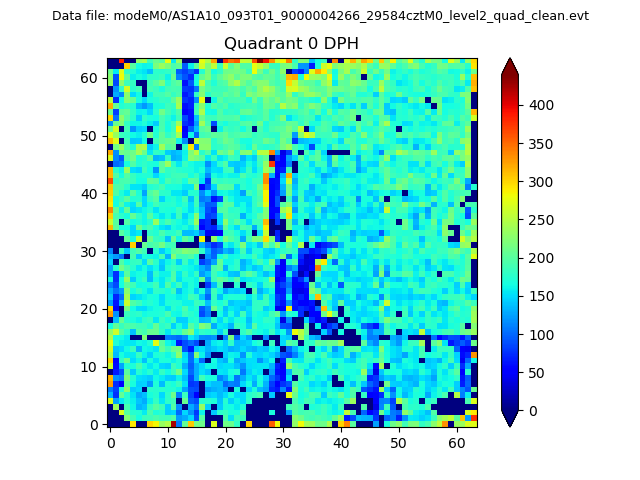 |
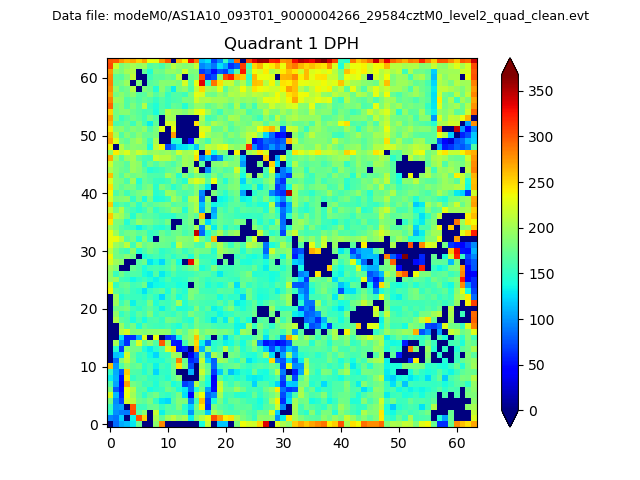 |
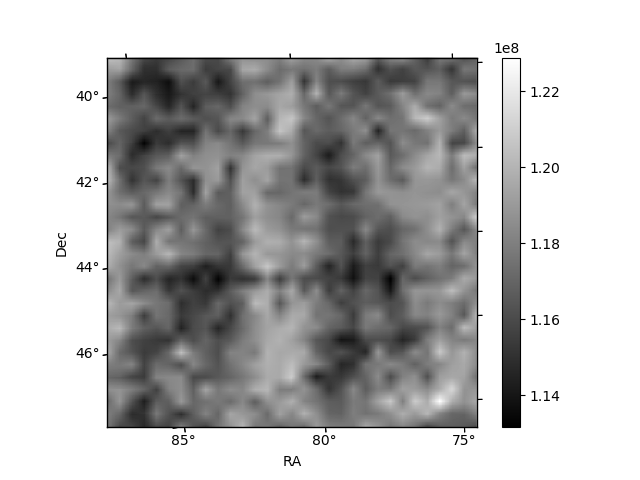
Quadrant B |
|---|---|---|---|
| Quadrant D | 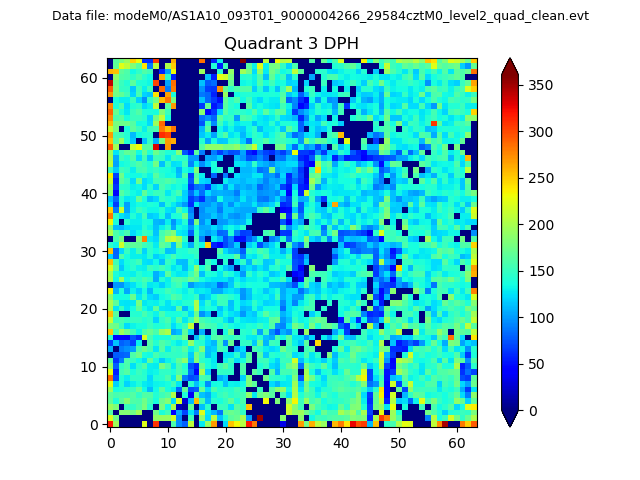 |
 |
Quadrant C |
| Plot type | Count rate plots | Images |
|---|---|---|
| Comparison with Poisson distribution Blue bars denote a histogram of data divided into 1 sec bins. Red curve is a Poisson curve with rate = median count rate of data. |
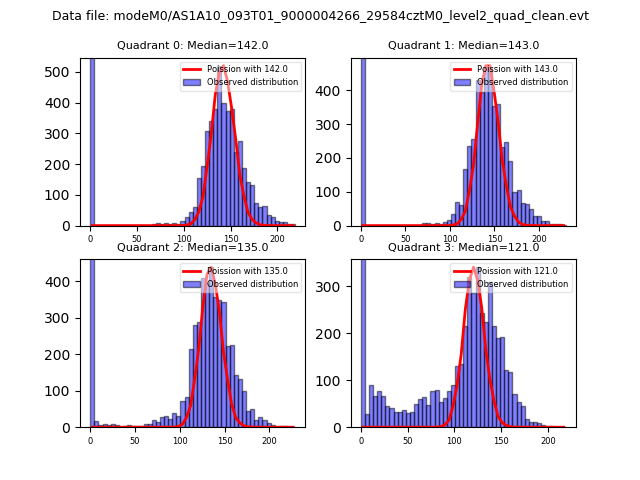 |
 |
| Quadrant-wise count rates Data is divided into 100 sec bins |
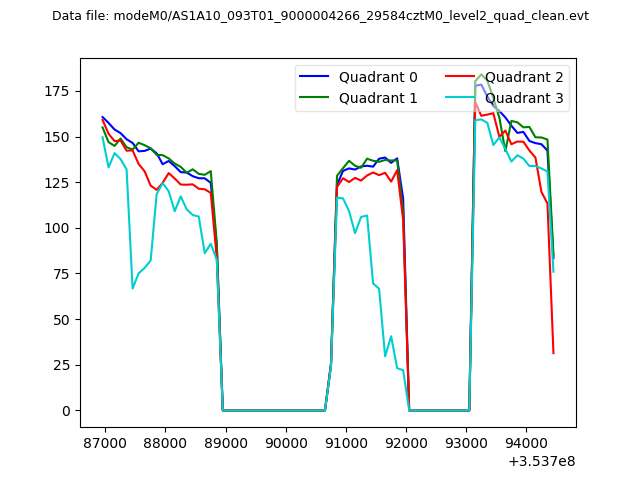 |
|
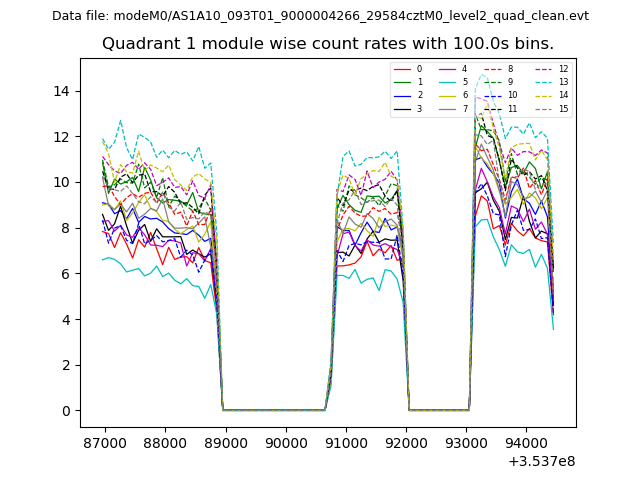
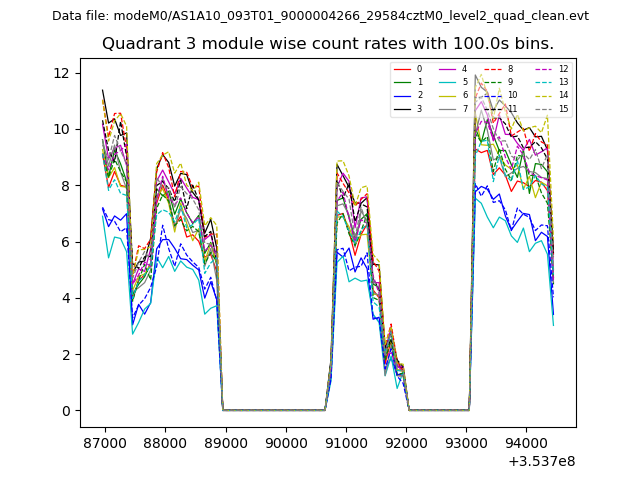
| Module-wise count rates for Quadrant A Data is divided into 100 sec bins |
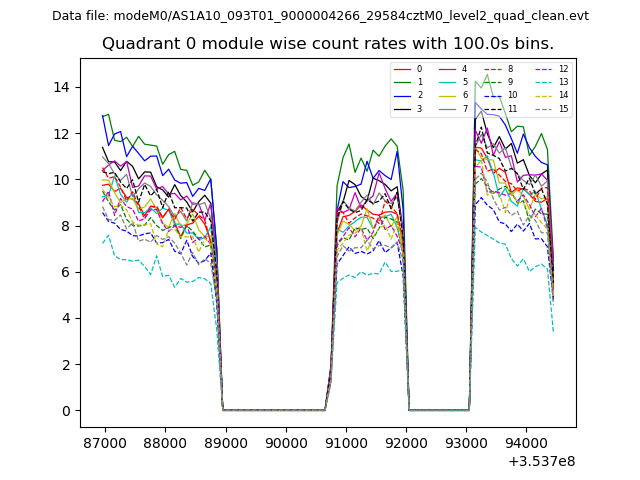 |
 |
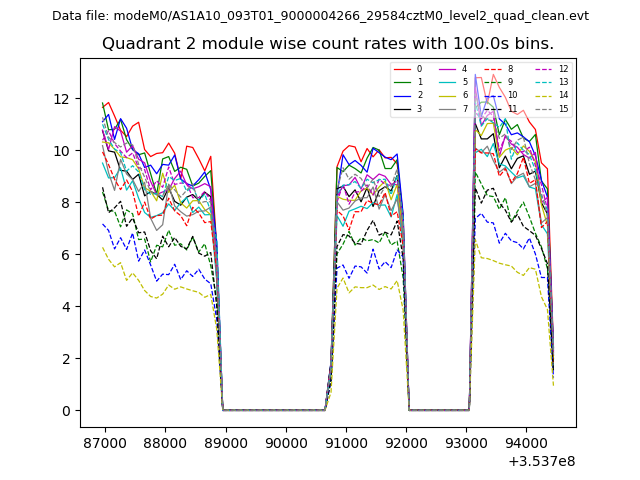
| Module-wise count rates for Quadrant B Data is divided into 100 sec bins |
 |
 |
| Module-wise count rates for Quadrant C Data is divided into 100 sec bins |
 |
 |
| Module-wise count rates for Quadrant D Data is divided into 100 sec bins |
 |
 |
| Parameter | Plot |
|---|---|
| CZT HV Monitor | 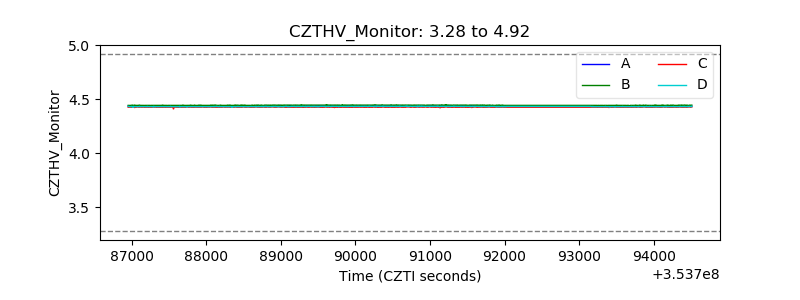 |
| D_VDD | 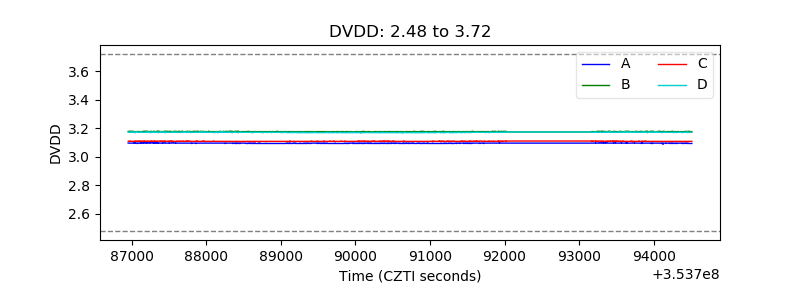 |
| Temperature 1 | 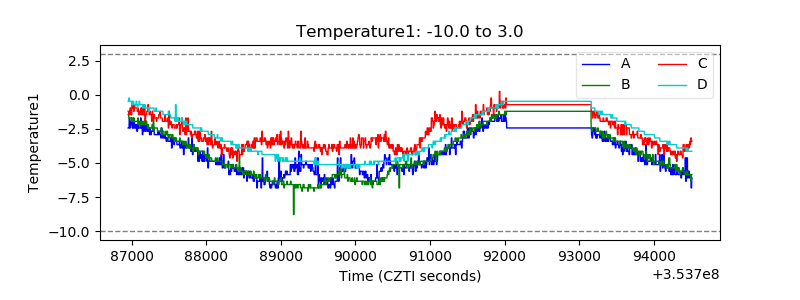 |
| Veto HV Monitor | 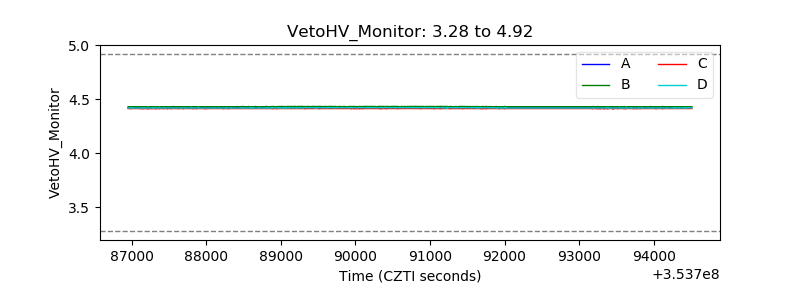 |
| Veto LLD | 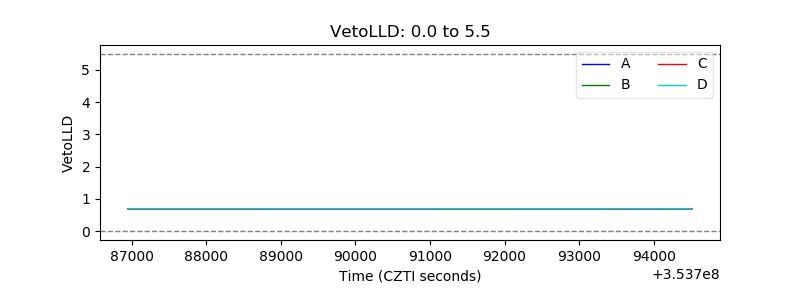 |
| Alpha Counter | 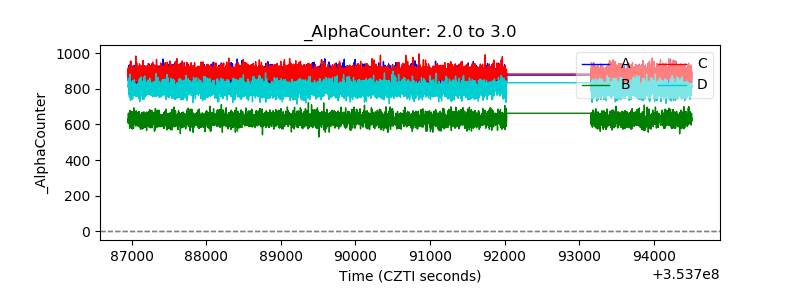 |
| _CPM_Rate | 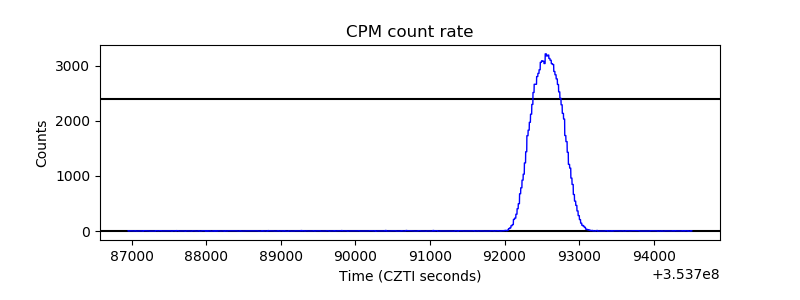 |
| CZT Counter | 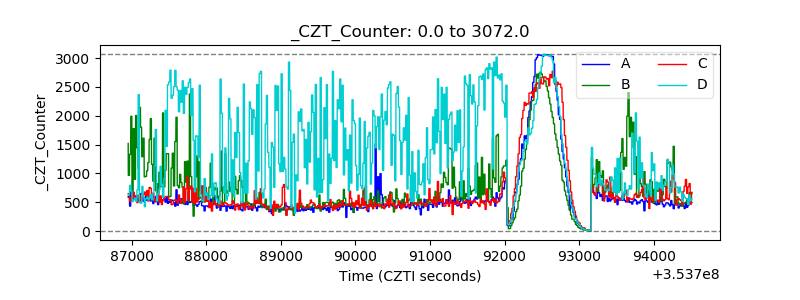 |
| +2.5 Volts monitor | 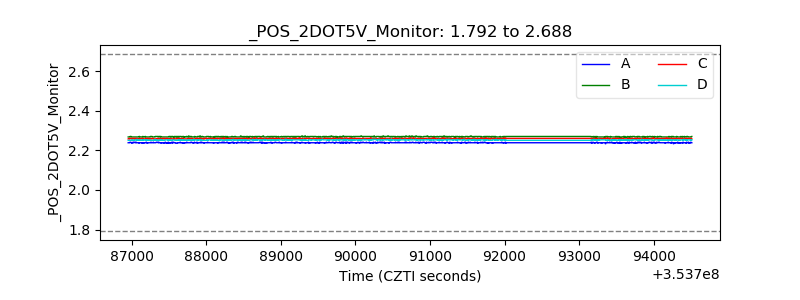 |
| +5 Volts monitor | 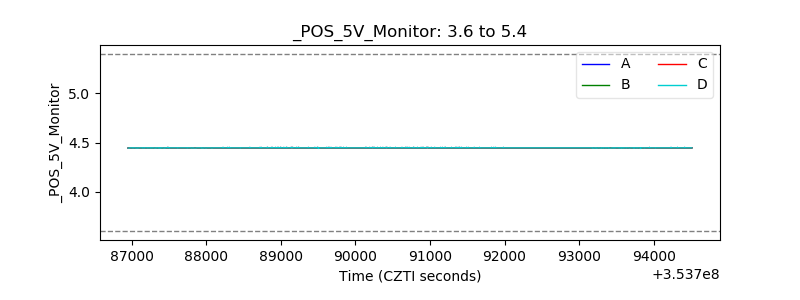 |
| _ROLL_ROT | 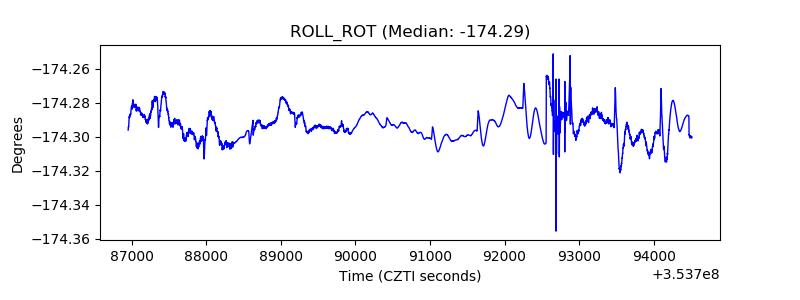 |
| _Roll_DEC | 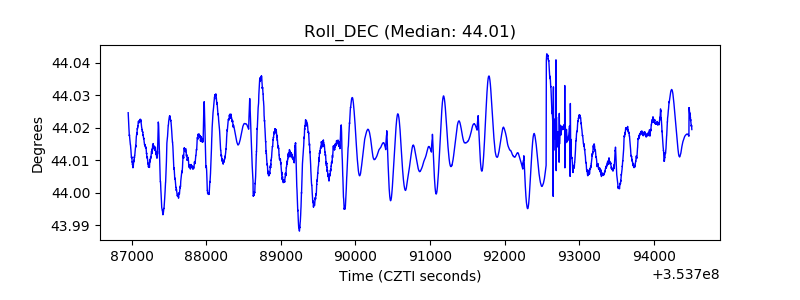 |
| _Roll_RA | 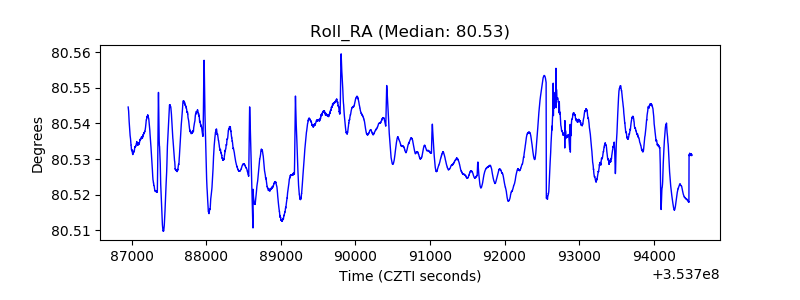 |
| Veto Counter | 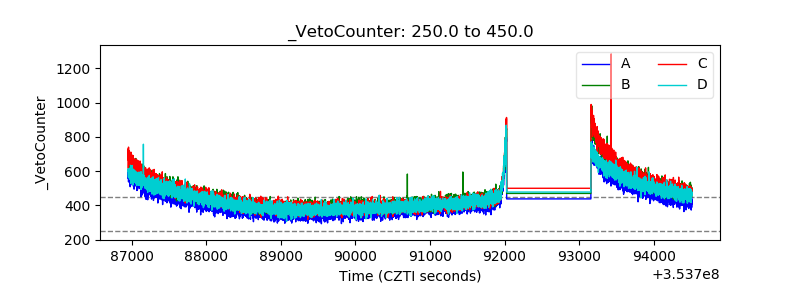 |