| Param | Original file | Final file |
|---|---|---|
| Filename | modeM0/AS1A10_093T01_9000004266_29585cztM0_level2.evt | modeM0/AS1A10_093T01_9000004266_29585cztM0_level2_quad_clean.evt |
| Size (bytes) | 541,033,920 | 97,680,960 |
| Size | 516.0 MB | 93.2 MB |
| Events in quadrant A | 3,109,780 | 652,491 |
| Events in quadrant B | 4,275,957 | 671,478 |
| Events in quadrant C | 3,459,604 | 611,639 |
| Events in quadrant D | 5,112,773 | 582,541 |
| Mode M9 | |||
|---|---|---|---|
| Quadrant | BADHDUFLAG | Total packets | Discarded packets |
| A | 0 | 15 | 0 |
| B | 0 | 16 | 0 |
| C | 0 | 16 | 0 |
| D | 0 | 16 | 0 |
| Mode M0 | |||
|---|---|---|---|
| Quadrant | BADHDUFLAG | Total packets | Discarded packets |
| A | 0 | 13235 | 2 |
| B | 0 | 16916 | 2 |
| C | 0 | 14363 | 2 |
| D | 0 | 19474 | 2 |
| Mode SS | |||
|---|---|---|---|
| Quadrant | BADHDUFLAG | Total packets | Discarded packets |
| A | 0 | 128 | 0 |
| B | 0 | 128 | 0 |
| C | 0 | 128 | 0 |
| D | 0 | 128 | 0 |
| Quadrant | Total seconds | Saturated seconds | Saturation percentage |
|---|---|---|---|
| A | 6304 | 15 | 0.237944% |
| B | 6304 | 116 | 1.840102% |
| C | 6304 | 408 | 6.472081% |
| D | 6304 | 271 | 4.298858% |
Noise dominated data is calculated using 1-second bins in cleaned event files. If a bin has >2000 counts, and if more than 50% of those come from <1% of pixels, then it is considered to be noise-dominated and hence unusable.
| Quadrant | # 1 sec bins | Bins with >0 counts | Bins with >2000 counts | High rate bins dominated by noise | Noise dominated (total time) | Noise dominated (detector-on time) | Marked lightcurve |
|---|---|---|---|---|---|---|---|
| A | 7584 | 6305 | 3 | 3 | 0.04% | 0.05% | 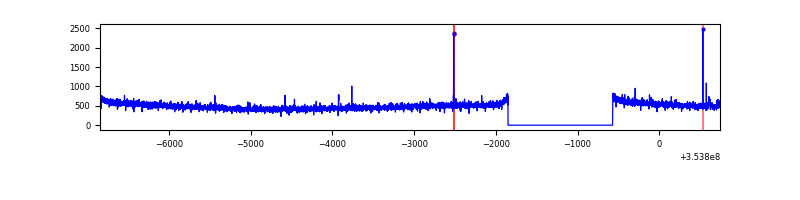 |
| B | 7584 | 6305 | 53 | 53 | 0.70% | 0.84% | 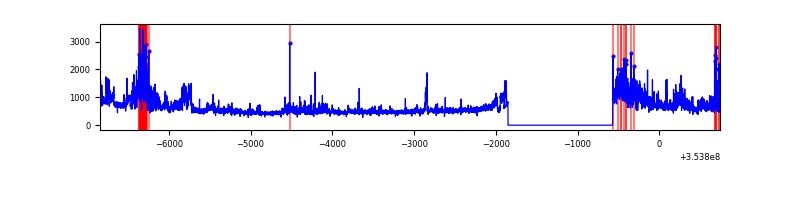 |
| C | 7584 | 6305 | 2 | 2 | 0.03% | 0.03% | 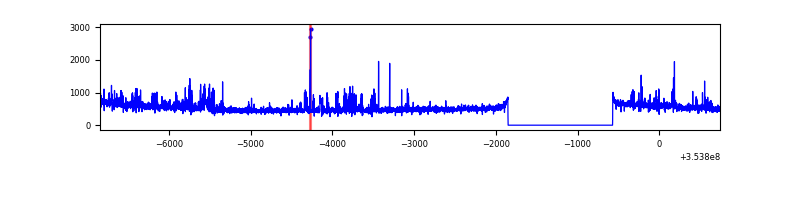 |
| D | 7584 | 6305 | 221 | 221 | 2.91% | 3.51% | 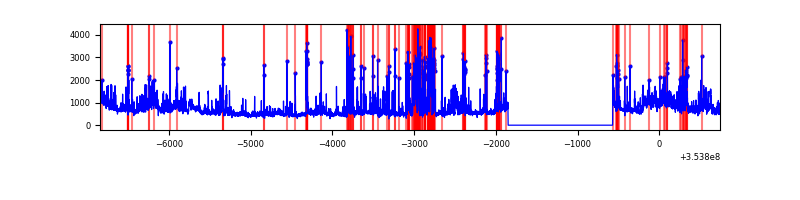 |
Top three noisy pixels from each quadrant. If the there are fewer than three noisy pixels in the level2.evt file, extra rows are filled as -1
| Pixel properties | Quadrant properties | ||||||
|---|---|---|---|---|---|---|---|
| Quadrant | DetID | PixID | Counts | Sigma | Mean | Median | Sigma |
| A | 0 | 13 | 19548 | 118.02 | 799 | 783 | 159.0 |
| A | 13 | 254 | 11349 | 66.45 | 799 | 783 | 159.0 |
| A | 3 | 137 | 7338 | 41.23 | 799 | 783 | 159.0 |
| B | 0 | 189 | 1055128 | 7039.33 | 804 | 784 | 149.8 |
| B | 0 | 190 | 24249 | 156.66 | 804 | 784 | 149.8 |
| B | 12 | 111 | 17304 | 110.3 | 804 | 784 | 149.8 |
| C | 14 | 238 | 239422 | 1359.56 | 756 | 764 | 175.5 |
| C | 14 | 254 | 166719 | 945.39 | 756 | 764 | 175.5 |
| C | 3 | 233 | 55753 | 313.25 | 756 | 764 | 175.5 |
| D | 7 | 80 | 949642 | 5270.45 | 761 | 741 | 180.0 |
| D | 8 | 195 | 382828 | 2122.21 | 761 | 741 | 180.0 |
| D | 12 | 33 | 250282 | 1386.02 | 761 | 741 | 180.0 |
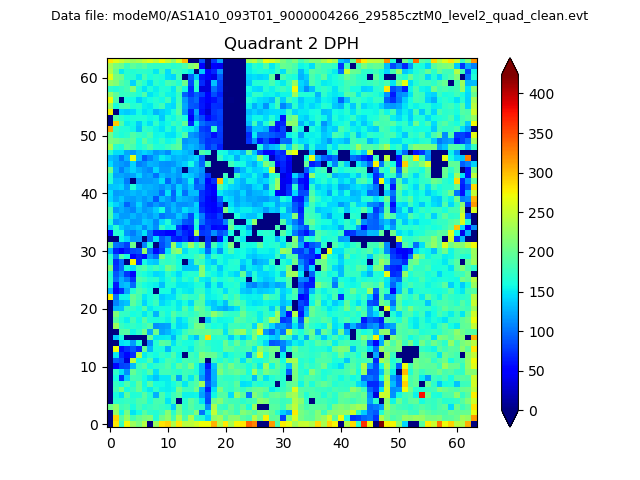
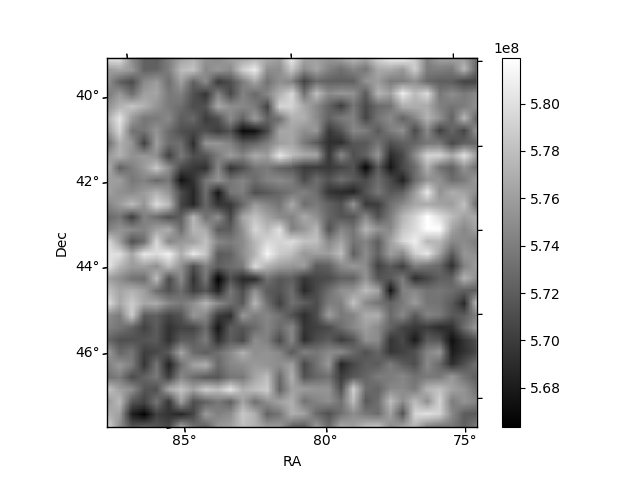
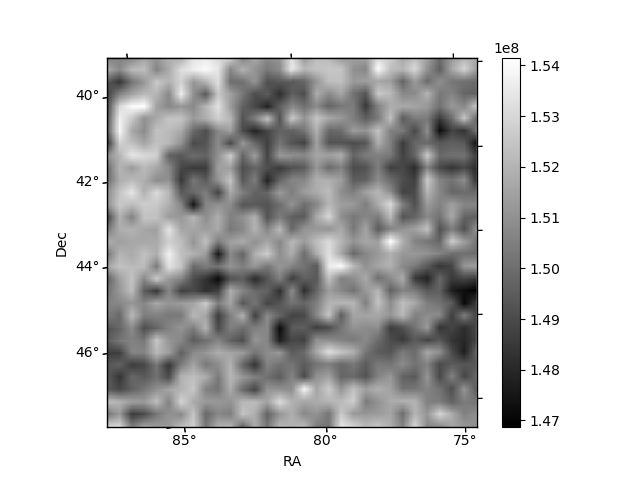
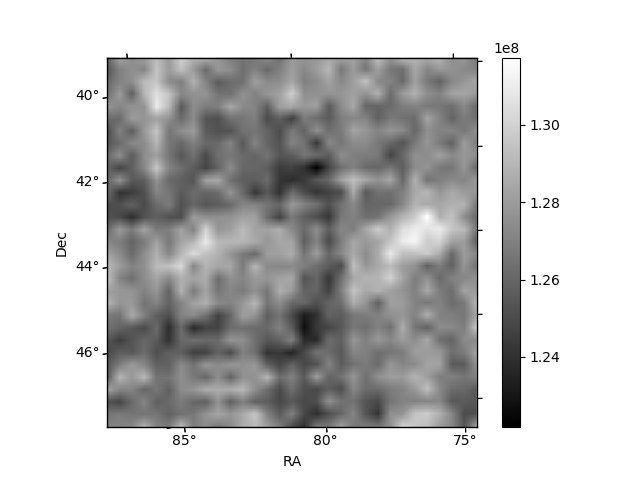
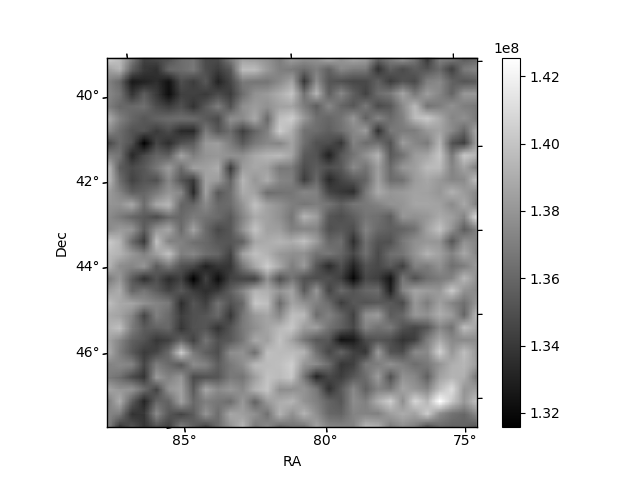
Histogram calculated using DETX and DETY for each event in the final _common_clean file
| Quadrant A | 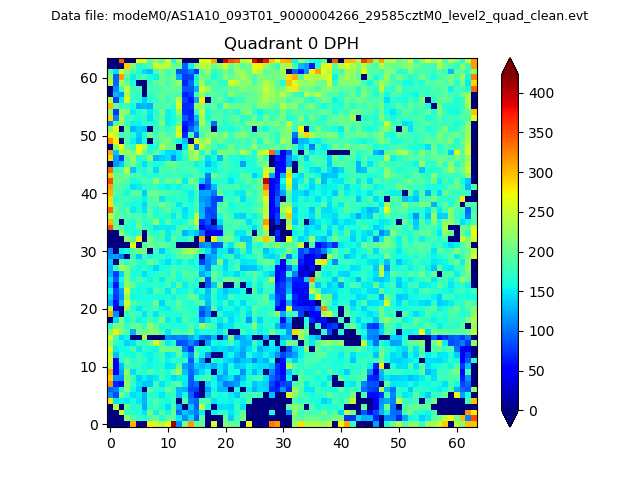 |
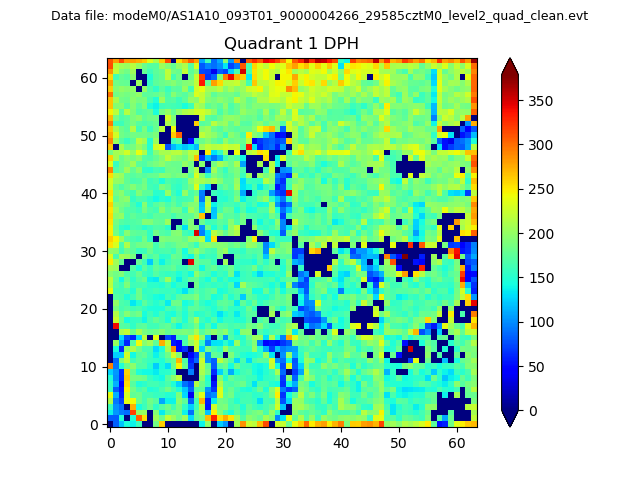 |
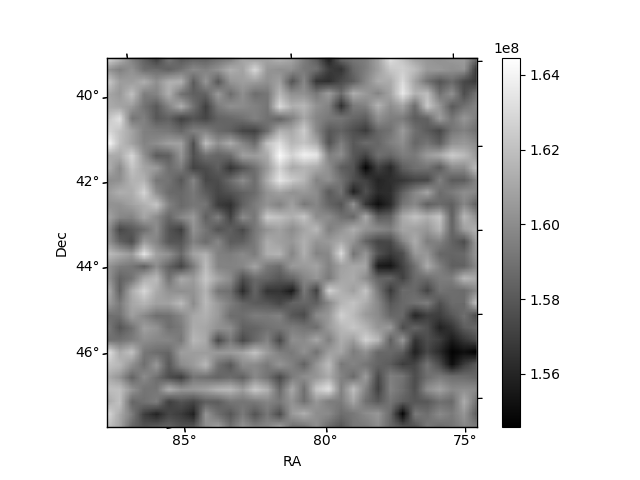
Quadrant B |
|---|---|---|---|
| Quadrant D | 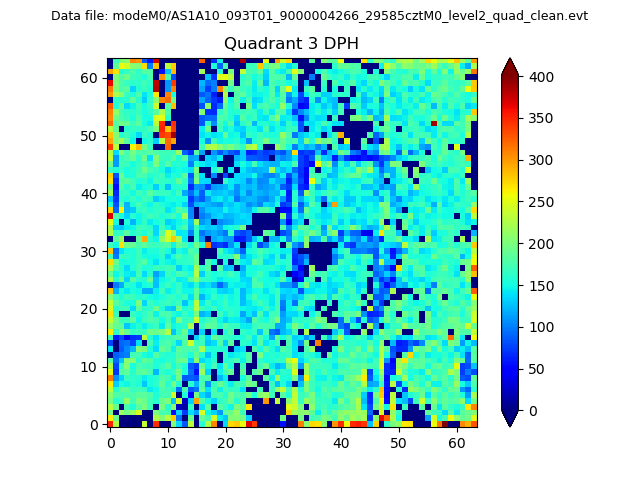 |
 |
Quadrant C |
| Plot type | Count rate plots | Images |
|---|---|---|
| Comparison with Poisson distribution Blue bars denote a histogram of data divided into 1 sec bins. Red curve is a Poisson curve with rate = median count rate of data. |
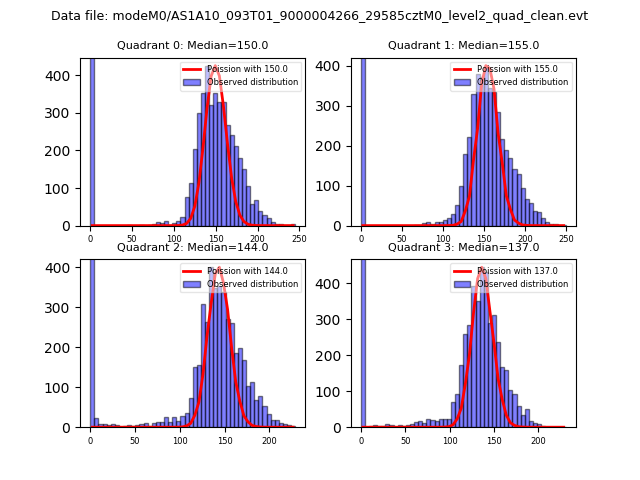 |
 |
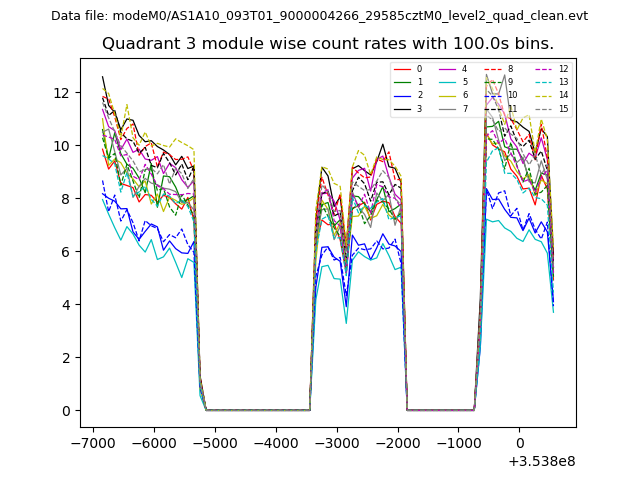
| Quadrant-wise count rates Data is divided into 100 sec bins |
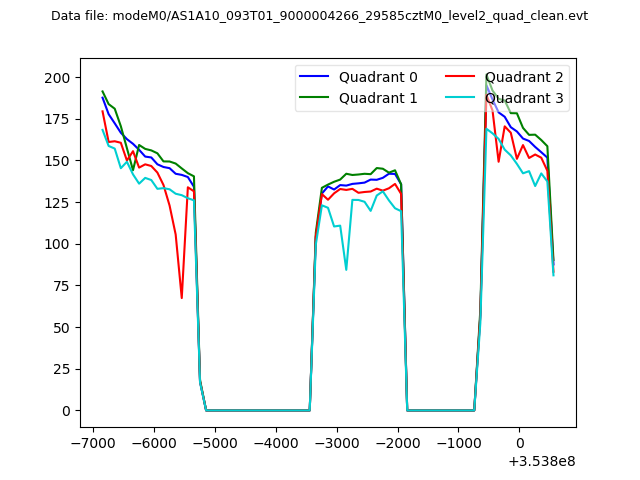 |
|
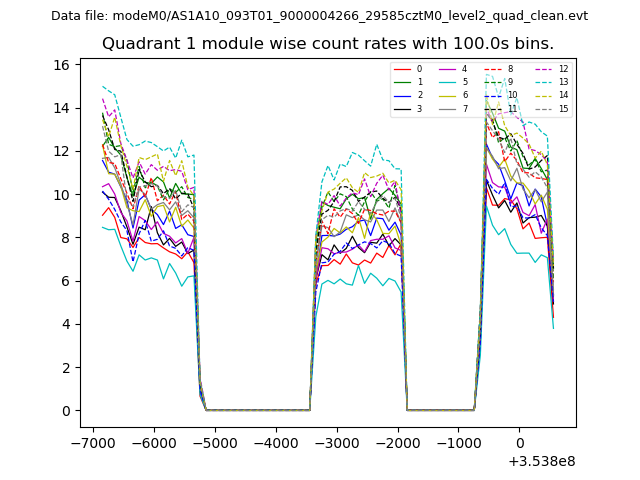
| Module-wise count rates for Quadrant A Data is divided into 100 sec bins |
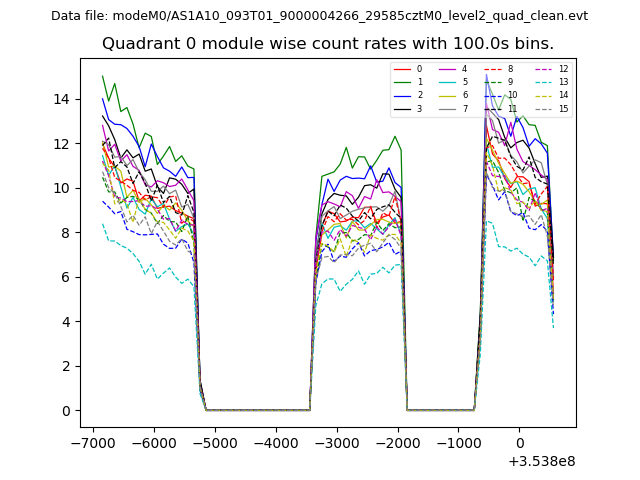 |
 |
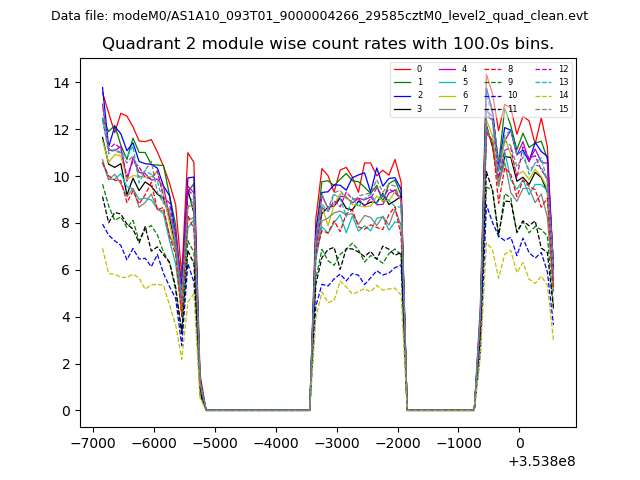
| Module-wise count rates for Quadrant B Data is divided into 100 sec bins |
 |
 |
| Module-wise count rates for Quadrant C Data is divided into 100 sec bins |
 |
 |
| Module-wise count rates for Quadrant D Data is divided into 100 sec bins |
 |
 |
| Parameter | Plot |
|---|---|
| CZT HV Monitor | 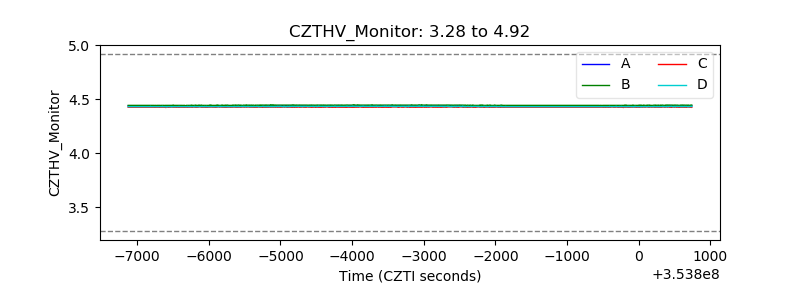 |
| D_VDD | 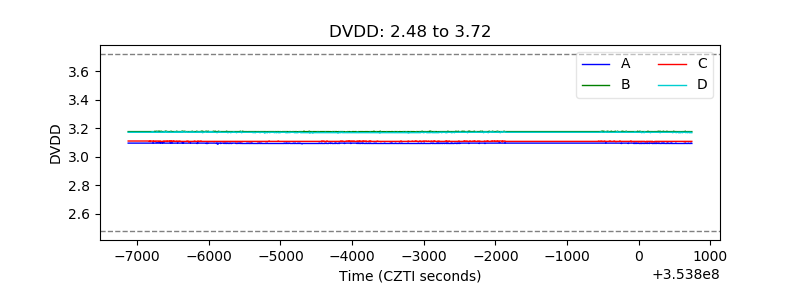 |
| Temperature 1 | 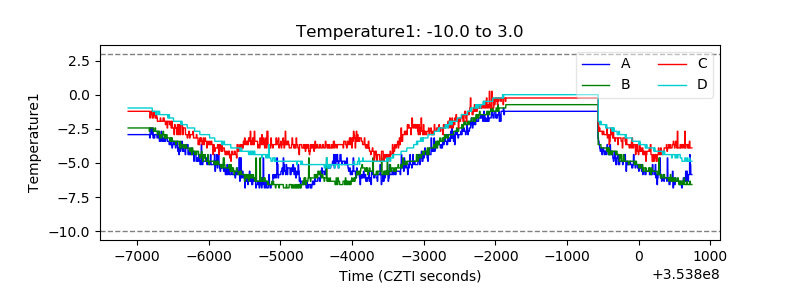 |
| Veto HV Monitor | 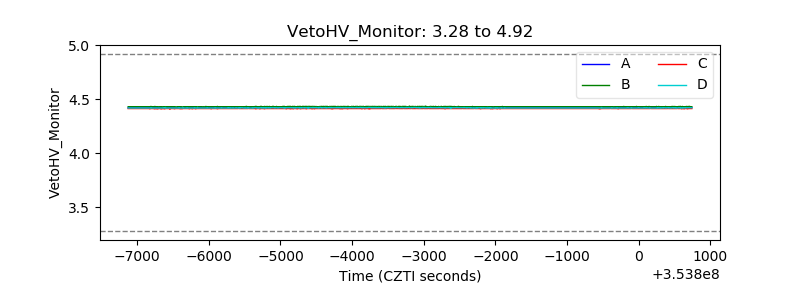 |
| Veto LLD | 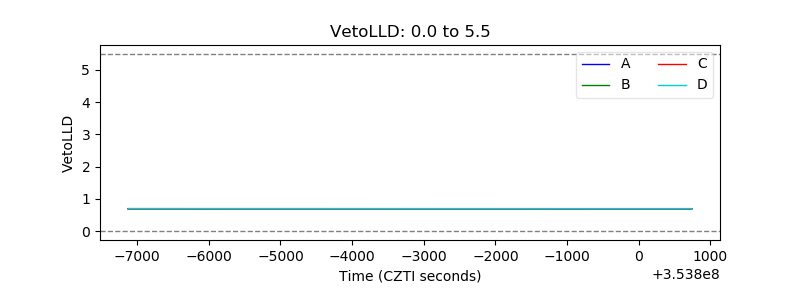 |
| Alpha Counter | 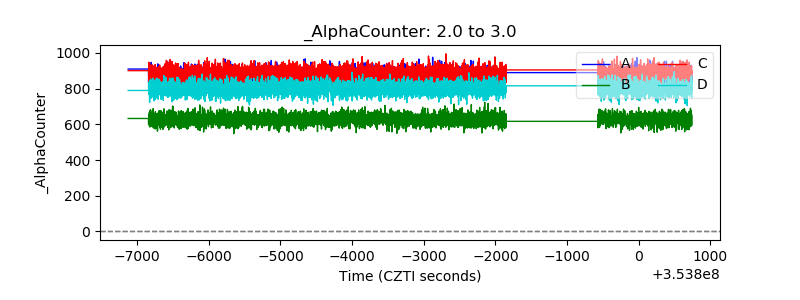 |
| _CPM_Rate | 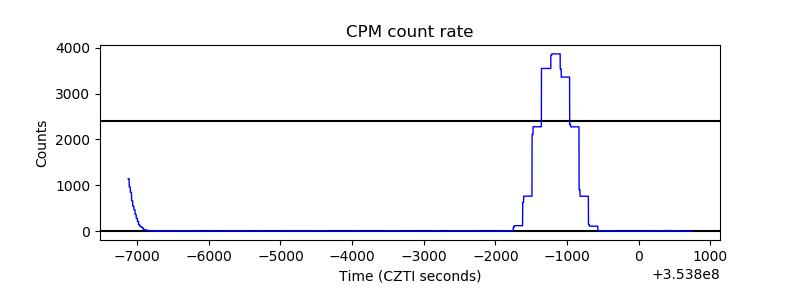 |
| CZT Counter | 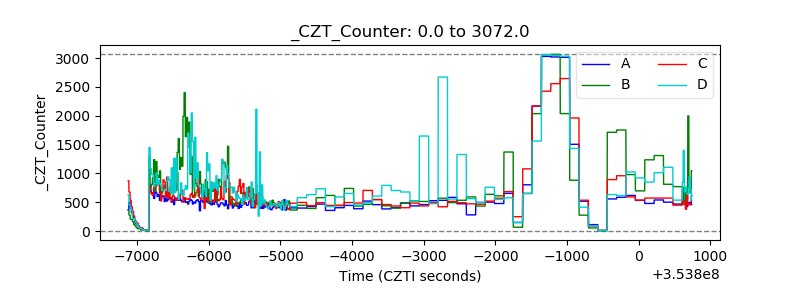 |
| +2.5 Volts monitor | 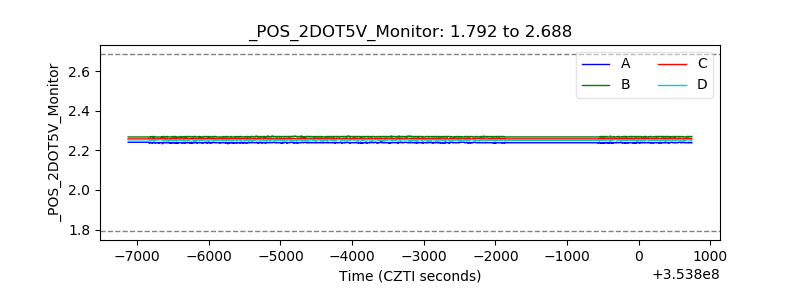 |
| +5 Volts monitor | 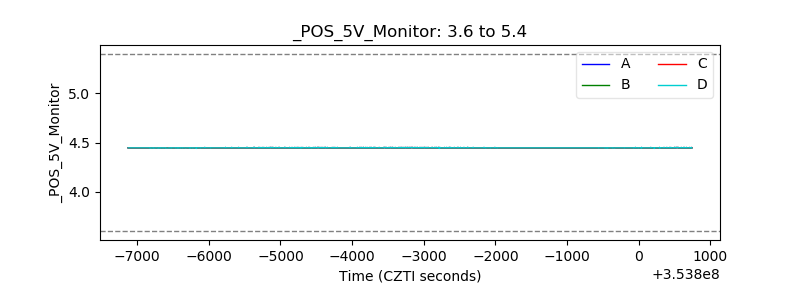 |
| _ROLL_ROT | 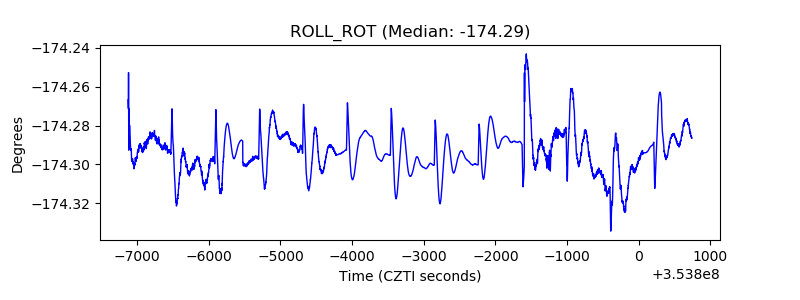 |
| _Roll_DEC | 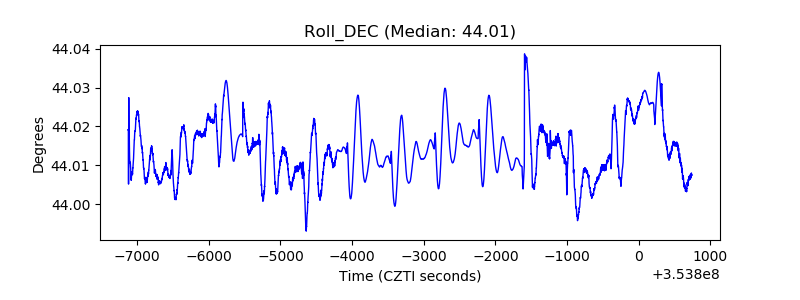 |
| _Roll_RA | 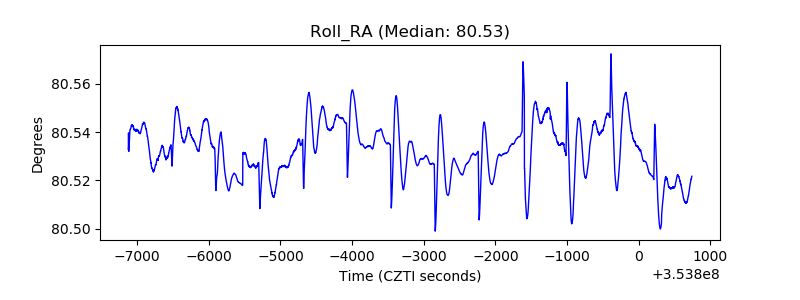 |
| Veto Counter | 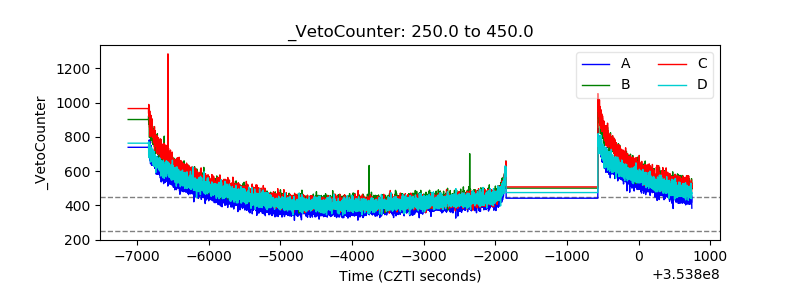 |