| Param | Original file | Final file |
|---|---|---|
| Filename | modeM0/AS1A10_093T01_9000004266_29586cztM0_level2.evt | modeM0/AS1A10_093T01_9000004266_29586cztM0_level2_quad_clean.evt |
| Size (bytes) | 524,802,240 | 90,884,160 |
| Size | 500.5 MB | 86.7 MB |
| Events in quadrant A | 3,150,890 | 599,878 |
| Events in quadrant B | 4,484,916 | 616,175 |
| Events in quadrant C | 3,299,357 | 571,684 |
| Events in quadrant D | 4,546,715 | 540,115 |
| Mode M9 | |||
|---|---|---|---|
| Quadrant | BADHDUFLAG | Total packets | Discarded packets |
| A | 0 | 16 | 0 |
| B | 0 | 17 | 0 |
| C | 0 | 17 | 0 |
| D | 0 | 17 | 0 |
| Mode M0 | |||
|---|---|---|---|
| Quadrant | BADHDUFLAG | Total packets | Discarded packets |
| A | 0 | 13077 | 2 |
| B | 0 | 17473 | 2 |
| C | 0 | 13619 | 2 |
| D | 0 | 17791 | 2 |
| Mode SS | |||
|---|---|---|---|
| Quadrant | BADHDUFLAG | Total packets | Discarded packets |
| A | 0 | 122 | 0 |
| B | 0 | 122 | 0 |
| C | 0 | 122 | 0 |
| D | 0 | 122 | 0 |
| Quadrant | Total seconds | Saturated seconds | Saturation percentage |
|---|---|---|---|
| A | 6085 | 14 | 0.230074% |
| B | 6085 | 165 | 2.711586% |
| C | 6084 | 186 | 3.057199% |
| D | 6084 | 152 | 2.498356% |
Noise dominated data is calculated using 1-second bins in cleaned event files. If a bin has >2000 counts, and if more than 50% of those come from <1% of pixels, then it is considered to be noise-dominated and hence unusable.
| Quadrant | # 1 sec bins | Bins with >0 counts | Bins with >2000 counts | High rate bins dominated by noise | Noise dominated (total time) | Noise dominated (detector-on time) | Marked lightcurve |
|---|---|---|---|---|---|---|---|
| A | 7440 | 6086 | 1 | 1 | 0.01% | 0.02% | 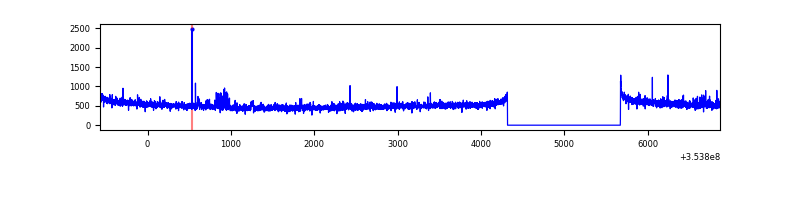 |
| B | 7440 | 6086 | 62 | 62 | 0.83% | 1.02% | 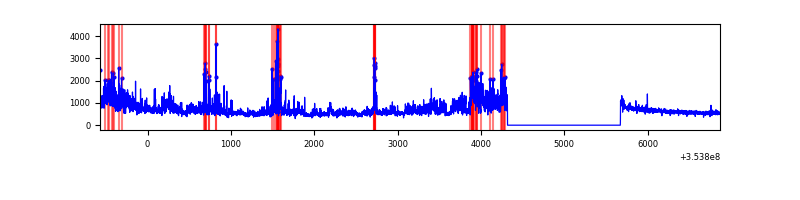 |
| C | 7439 | 6085 | 0 | 0 | 0.00% | 0.00% | 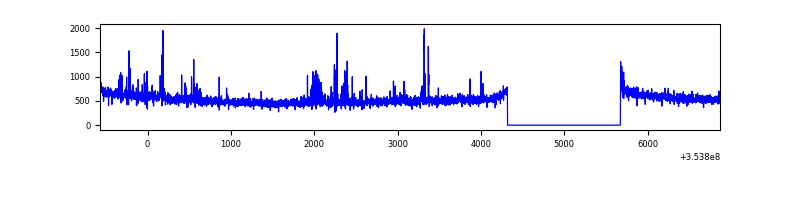 |
| D | 7439 | 6084 | 122 | 122 | 1.64% | 2.01% | 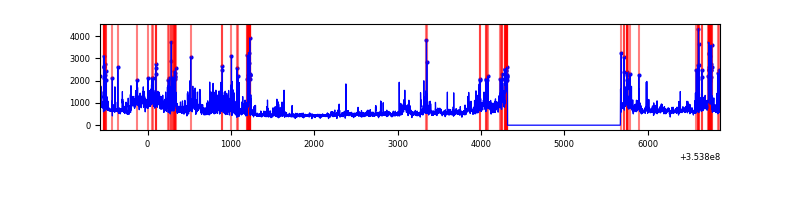 |
Top three noisy pixels from each quadrant. If the there are fewer than three noisy pixels in the level2.evt file, extra rows are filled as -1
| Pixel properties | Quadrant properties | ||||||
|---|---|---|---|---|---|---|---|
| Quadrant | DetID | PixID | Counts | Sigma | Mean | Median | Sigma |
| A | 0 | 13 | 71276 | 441.79 | 795 | 781 | 159.6 |
| A | 13 | 254 | 12634 | 74.28 | 795 | 781 | 159.6 |
| A | 1 | 113 | 7424 | 41.63 | 795 | 781 | 159.6 |
| B | 0 | 189 | 1177489 | 7991.02 | 799 | 782 | 147.3 |
| B | 15 | 33 | 86911 | 584.9 | 799 | 782 | 147.3 |
| B | 0 | 230 | 41596 | 277.17 | 799 | 782 | 147.3 |
| C | 14 | 238 | 171992 | 973.22 | 763 | 770 | 175.9 |
| C | 14 | 254 | 62722 | 352.13 | 763 | 770 | 175.9 |
| C | 3 | 233 | 40433 | 225.44 | 763 | 770 | 175.9 |
| D | 7 | 80 | 777998 | 4332.31 | 757 | 739 | 179.4 |
| D | 8 | 195 | 322226 | 1791.91 | 757 | 739 | 179.4 |
| D | 12 | 33 | 261408 | 1452.92 | 757 | 739 | 179.4 |
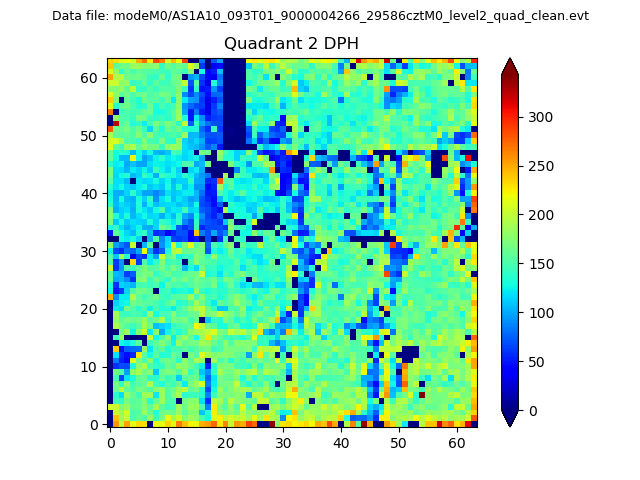
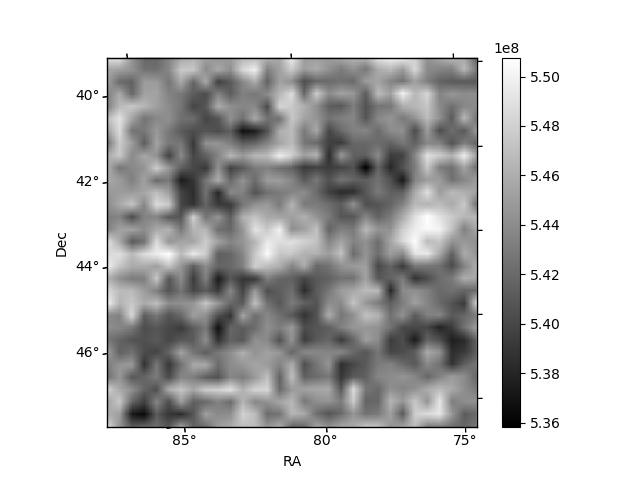
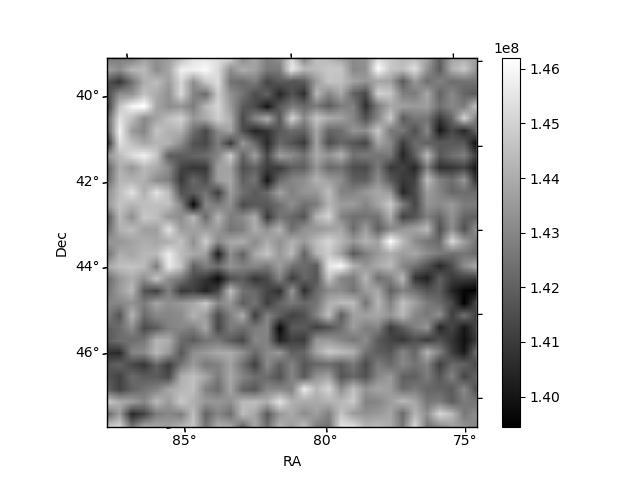
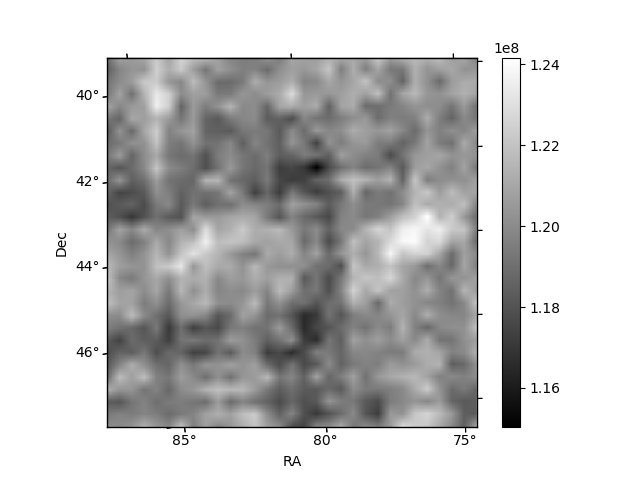
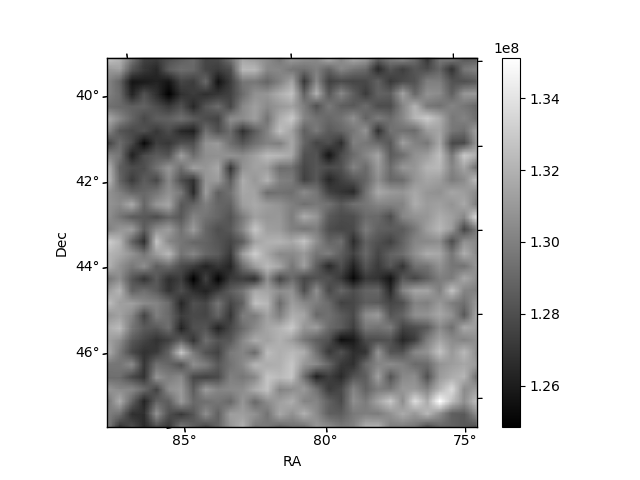
Histogram calculated using DETX and DETY for each event in the final _common_clean file
| Quadrant A | 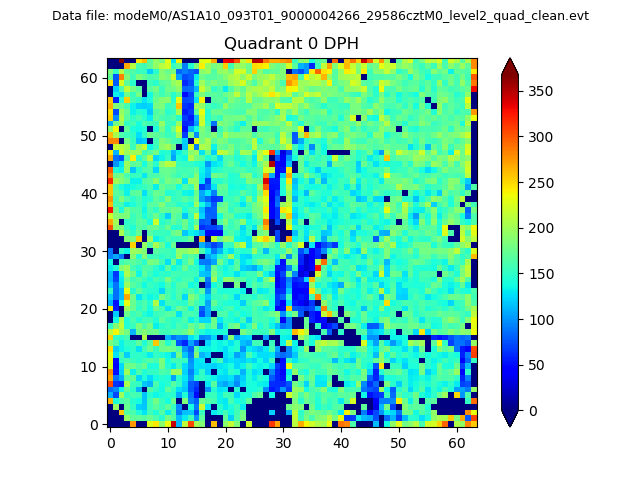 |
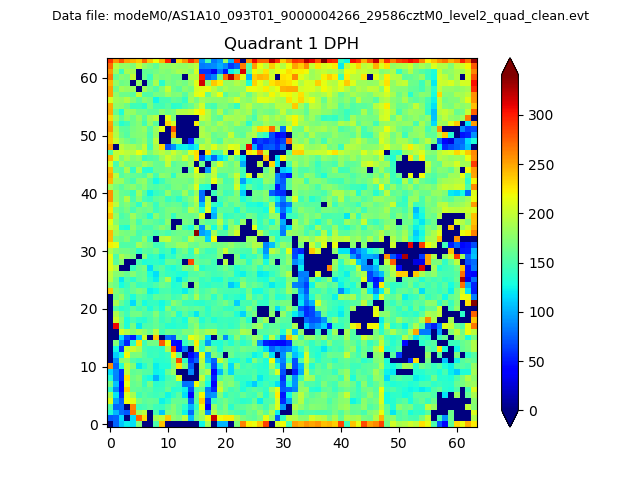 |
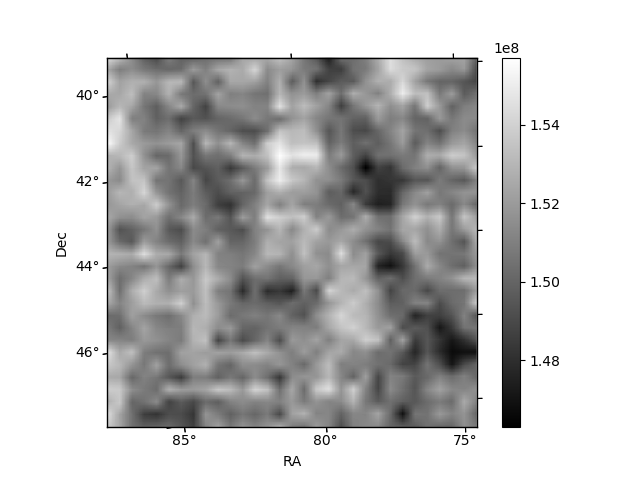
Quadrant B |
|---|---|---|---|
| Quadrant D | 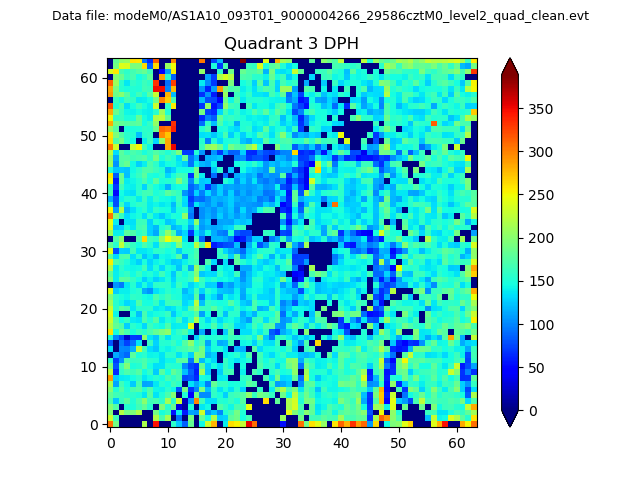 |
 |
Quadrant C |
| Plot type | Count rate plots | Images |
|---|---|---|
| Comparison with Poisson distribution Blue bars denote a histogram of data divided into 1 sec bins. Red curve is a Poisson curve with rate = median count rate of data. |
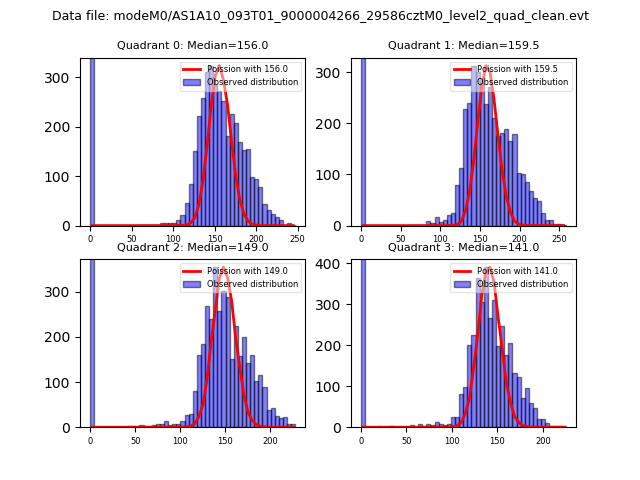 |
 |
| Quadrant-wise count rates Data is divided into 100 sec bins |
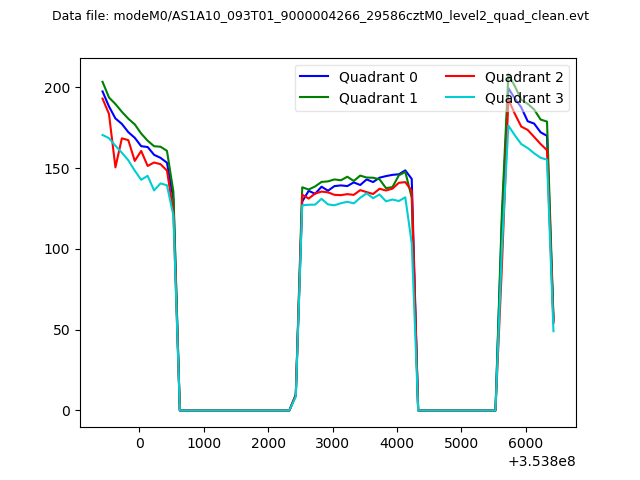 |
|
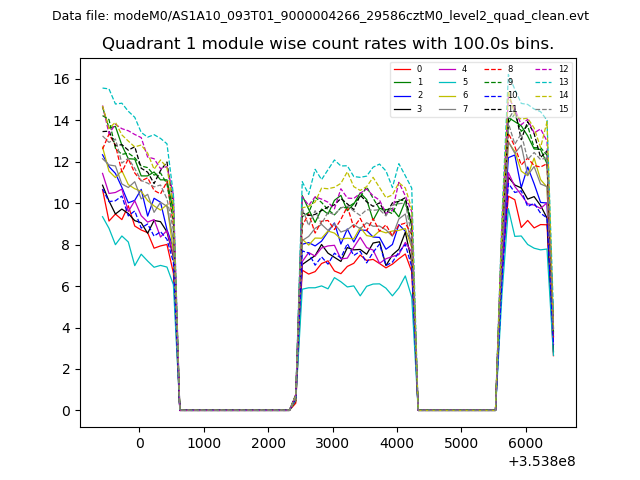
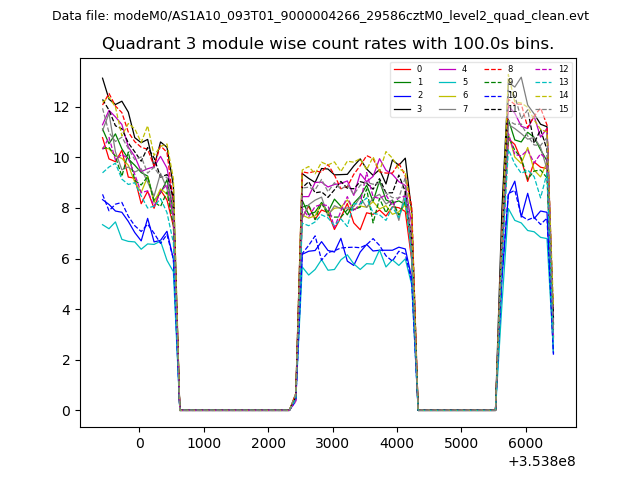
| Module-wise count rates for Quadrant A Data is divided into 100 sec bins |
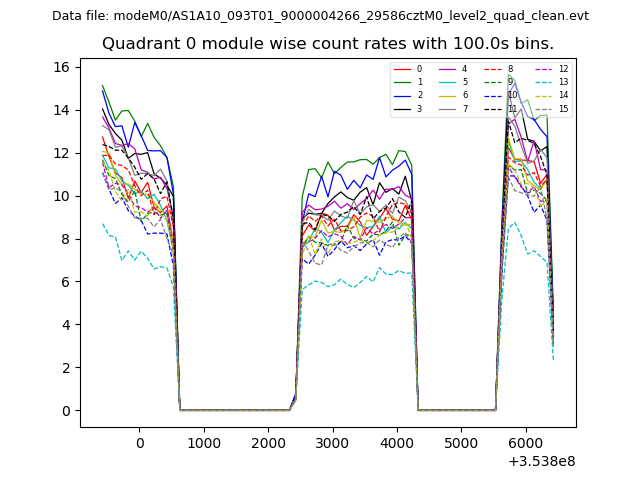 |
 |
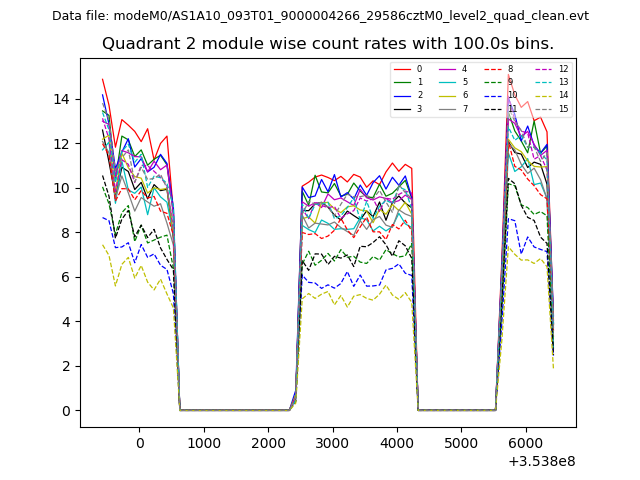
| Module-wise count rates for Quadrant B Data is divided into 100 sec bins |
 |
 |
| Module-wise count rates for Quadrant C Data is divided into 100 sec bins |
 |
 |
| Module-wise count rates for Quadrant D Data is divided into 100 sec bins |
 |
 |
| Parameter | Plot |
|---|---|
| CZT HV Monitor | 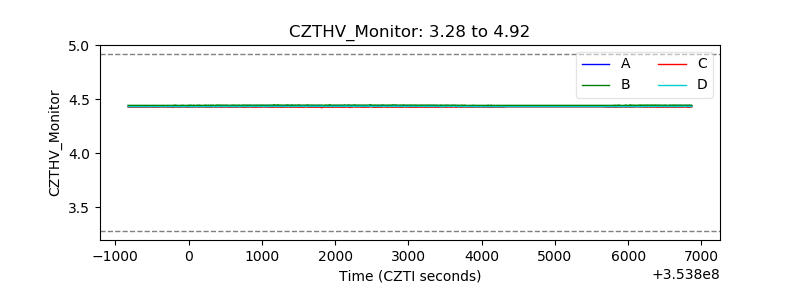 |
| D_VDD | 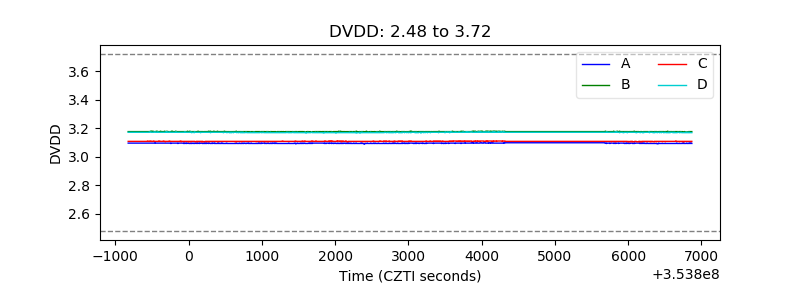 |
| Temperature 1 | 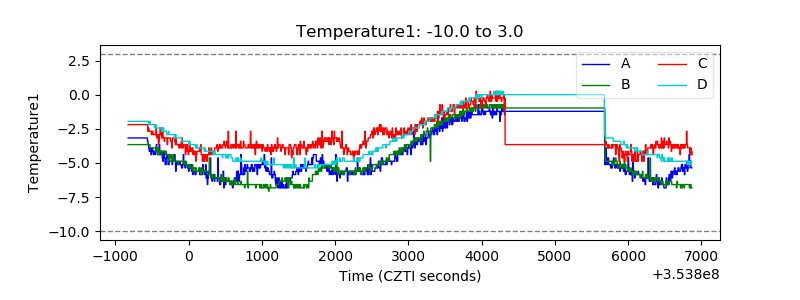 |
| Veto HV Monitor | 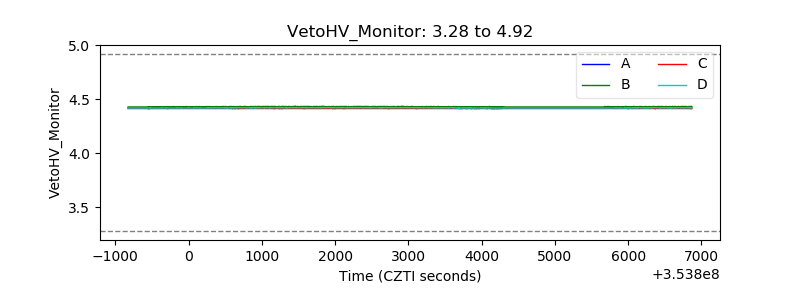 |
| Veto LLD | 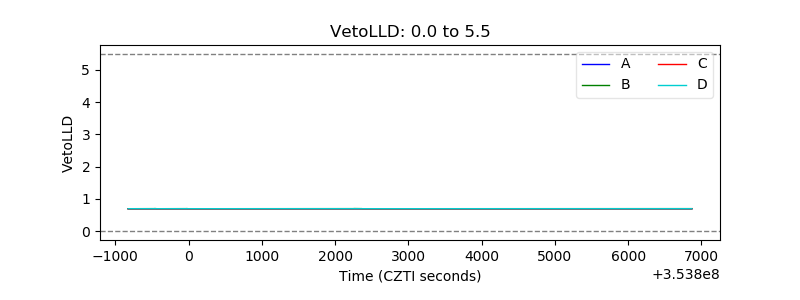 |
| Alpha Counter | 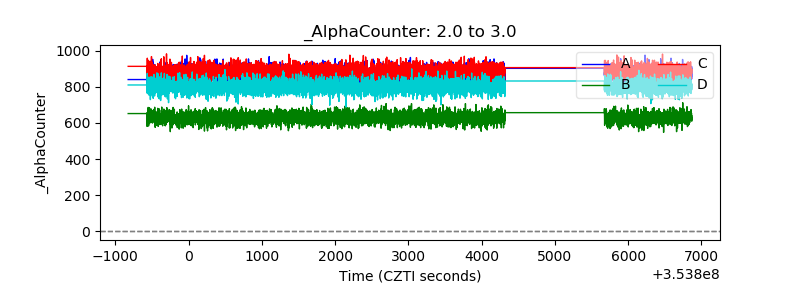 |
| _CPM_Rate | 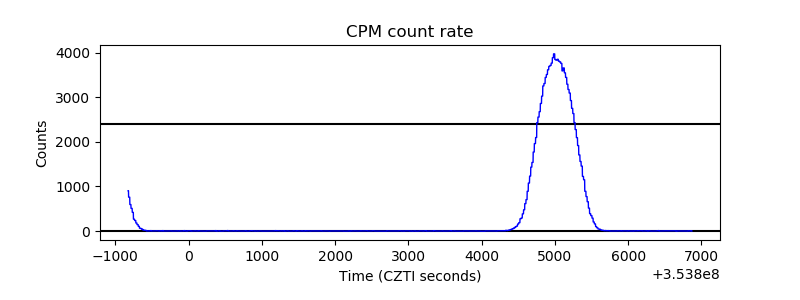 |
| CZT Counter | 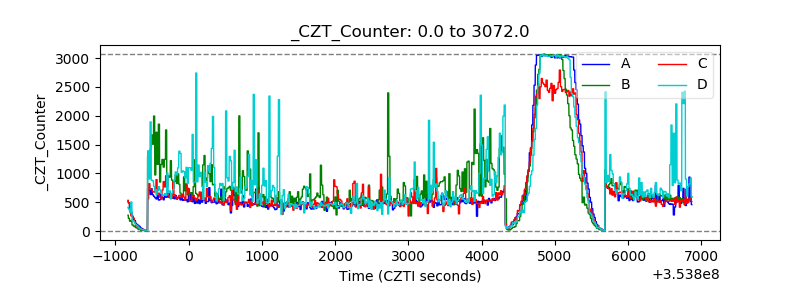 |
| +2.5 Volts monitor |  |
| +5 Volts monitor | 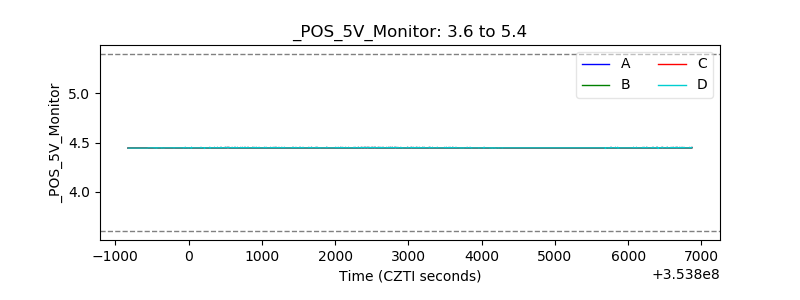 |
| _ROLL_ROT | 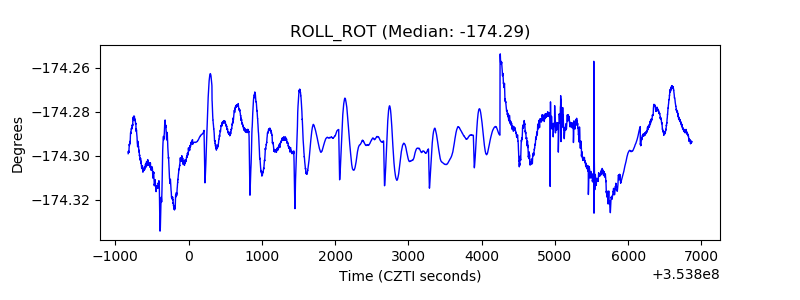 |
| _Roll_DEC | 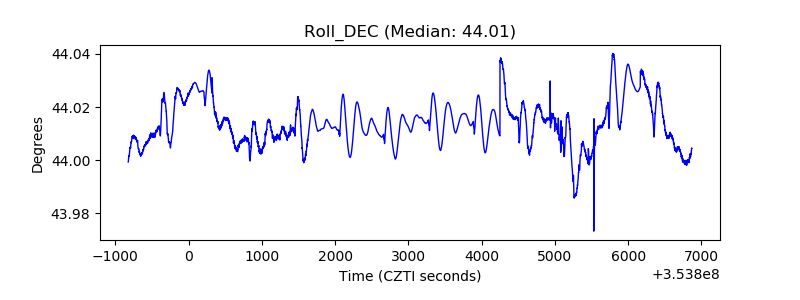 |
| _Roll_RA | 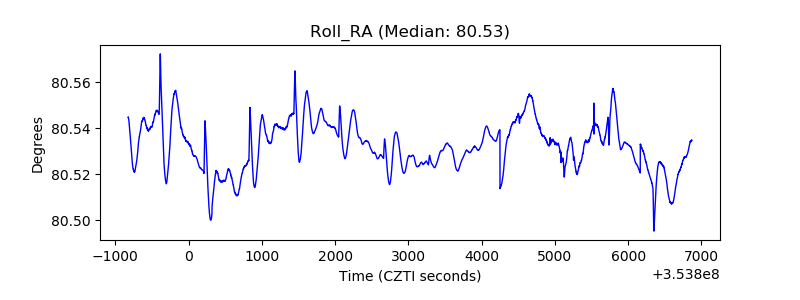 |
| Veto Counter | 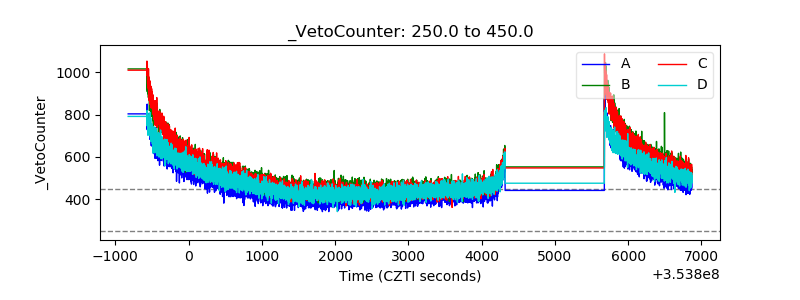 |