| Param | Original file | Final file |
|---|---|---|
| Filename | modeM0/AS1A10_093T01_9000004266_29587cztM0_level2.evt | modeM0/AS1A10_093T01_9000004266_29587cztM0_level2_quad_clean.evt |
| Size (bytes) | 560,171,520 | 82,180,800 |
| Size | 534.2 MB | 78.4 MB |
| Events in quadrant A | 3,305,334 | 532,688 |
| Events in quadrant B | 4,282,018 | 544,693 |
| Events in quadrant C | 3,361,478 | 503,663 |
| Events in quadrant D | 5,585,424 | 463,708 |
| Mode M9 | |||
|---|---|---|---|
| Quadrant | BADHDUFLAG | Total packets | Discarded packets |
| A | 0 | 17 | 0 |
| B | 0 | 18 | 0 |
| C | 0 | 18 | 0 |
| D | 0 | 18 | 0 |
| Mode M0 | |||
|---|---|---|---|
| Quadrant | BADHDUFLAG | Total packets | Discarded packets |
| A | 0 | 13638 | 2 |
| B | 0 | 16804 | 3 |
| C | 0 | 13800 | 2 |
| D | 0 | 21021 | 2 |
| Mode SS | |||
|---|---|---|---|
| Quadrant | BADHDUFLAG | Total packets | Discarded packets |
| A | 0 | 128 | 0 |
| B | 0 | 128 | 0 |
| C | 0 | 128 | 0 |
| D | 0 | 128 | 0 |
| Quadrant | Total seconds | Saturated seconds | Saturation percentage |
|---|---|---|---|
| A | 6361 | 40 | 0.628832% |
| B | 6360 | 187 | 2.940252% |
| C | 6360 | 143 | 2.248428% |
| D | 6360 | 509 | 8.003145% |
Noise dominated data is calculated using 1-second bins in cleaned event files. If a bin has >2000 counts, and if more than 50% of those come from <1% of pixels, then it is considered to be noise-dominated and hence unusable.
| Quadrant | # 1 sec bins | Bins with >0 counts | Bins with >2000 counts | High rate bins dominated by noise | Noise dominated (total time) | Noise dominated (detector-on time) | Marked lightcurve |
|---|---|---|---|---|---|---|---|
| A | 7731 | 6362 | 0 | 0 | 0.00% | 0.00% | 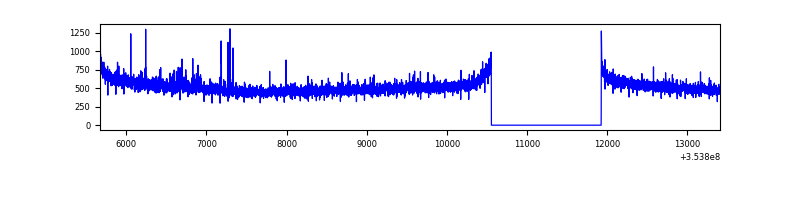 |
| B | 7730 | 6361 | 66 | 66 | 0.85% | 1.04% | 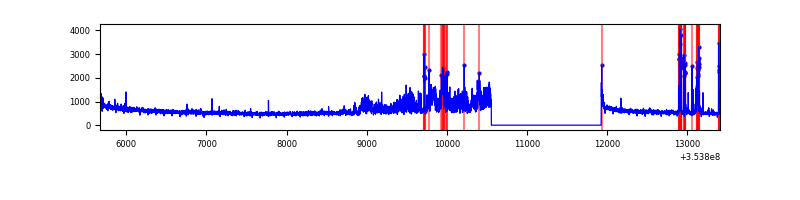 |
| C | 7730 | 6361 | 1 | 1 | 0.01% | 0.02% | 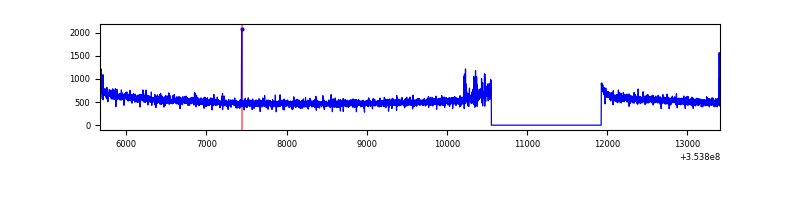 |
| D | 7730 | 6361 | 395 | 395 | 5.11% | 6.21% | 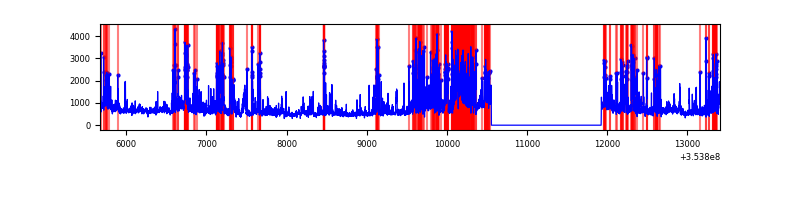 |
Top three noisy pixels from each quadrant. If the there are fewer than three noisy pixels in the level2.evt file, extra rows are filled as -1
| Pixel properties | Quadrant properties | ||||||
|---|---|---|---|---|---|---|---|
| Quadrant | DetID | PixID | Counts | Sigma | Mean | Median | Sigma |
| A | 0 | 13 | 38707 | 223.85 | 845 | 830 | 169.2 |
| A | 13 | 254 | 12343 | 68.04 | 845 | 830 | 169.2 |
| A | 3 | 137 | 7677 | 40.46 | 845 | 830 | 169.2 |
| B | 0 | 189 | 673024 | 4300.11 | 846 | 828 | 156.3 |
| B | 15 | 33 | 229881 | 1465.27 | 846 | 828 | 156.3 |
| B | 0 | 190 | 26416 | 163.69 | 846 | 828 | 156.3 |
| C | 14 | 238 | 151376 | 807.56 | 807 | 813 | 186.4 |
| C | 14 | 254 | 25258 | 131.11 | 807 | 813 | 186.4 |
| C | 15 | 208 | 15217 | 77.26 | 807 | 813 | 186.4 |
| D | 7 | 80 | 1747303 | 9390.61 | 786 | 764 | 186.0 |
| D | 8 | 195 | 320680 | 1720.09 | 786 | 764 | 186.0 |
| D | 13 | 153 | 153732 | 822.46 | 786 | 764 | 186.0 |
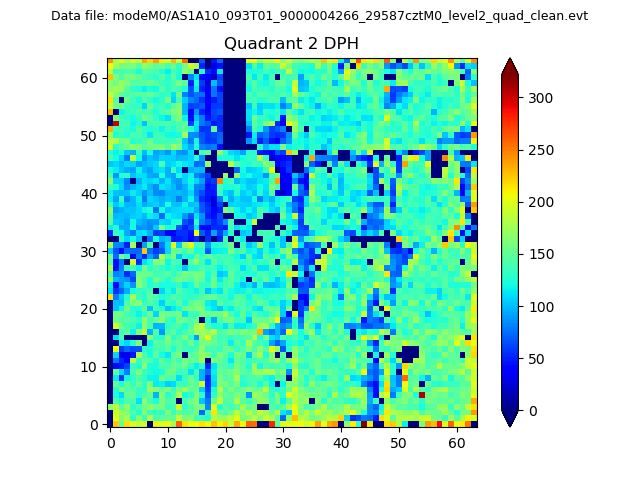
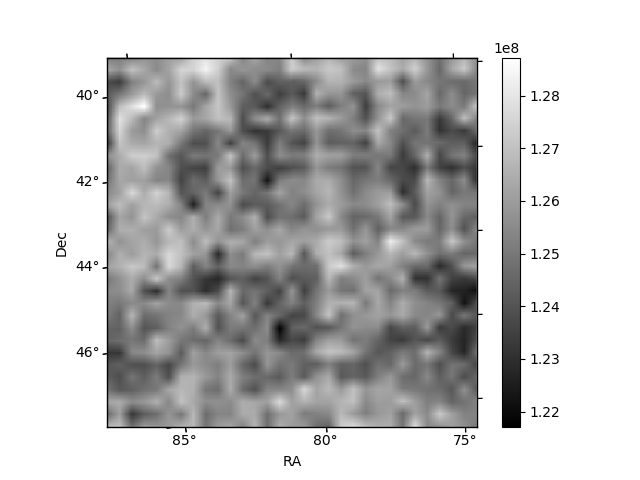
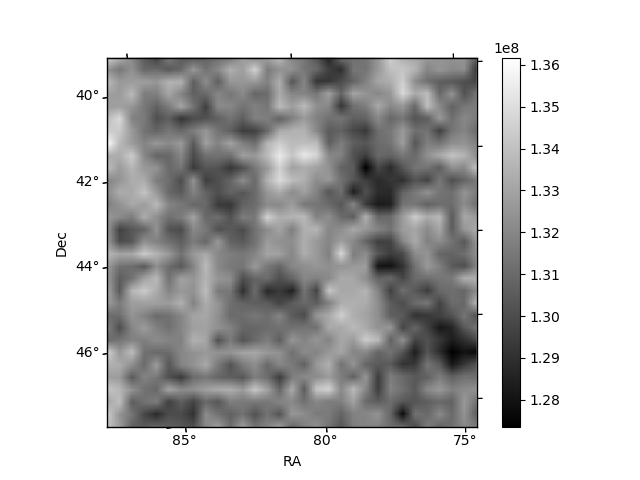
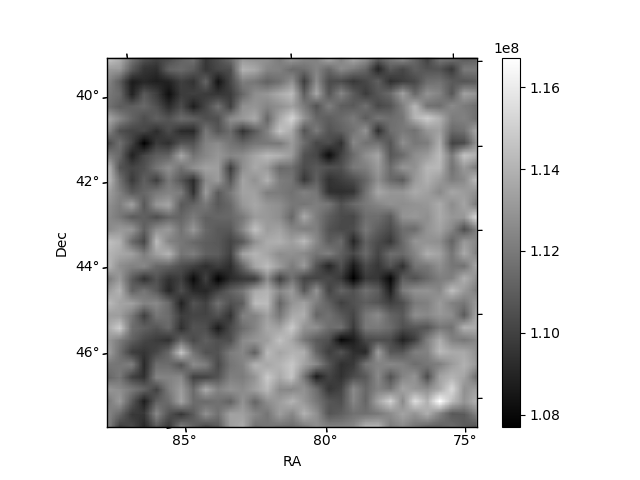
Histogram calculated using DETX and DETY for each event in the final _common_clean file
| Quadrant A | 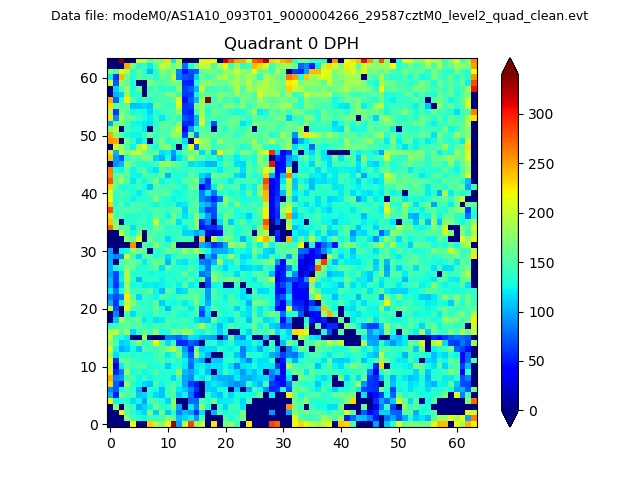 |
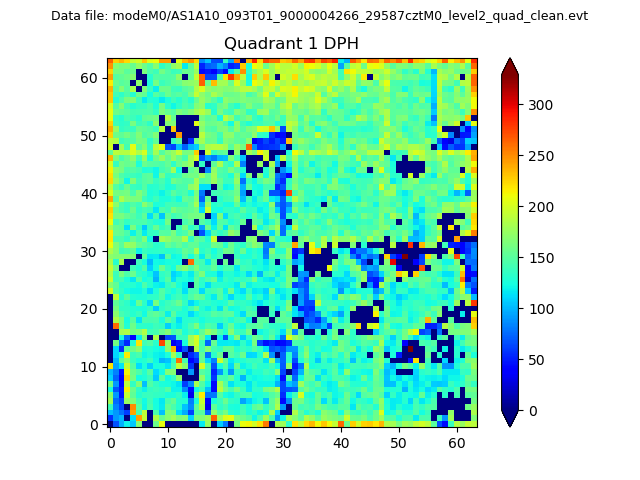 |
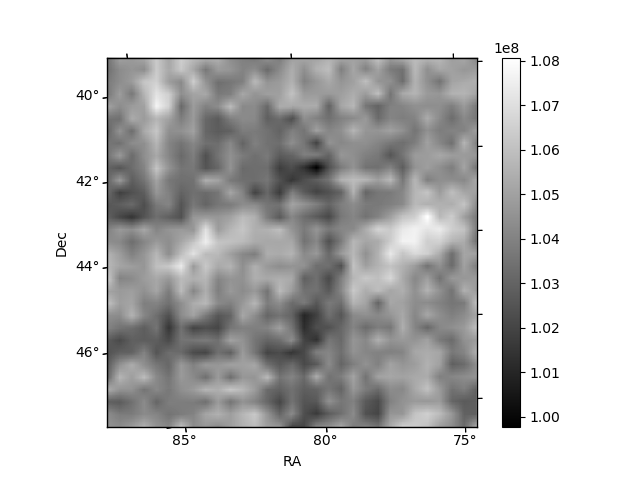
Quadrant B |
|---|---|---|---|
| Quadrant D | 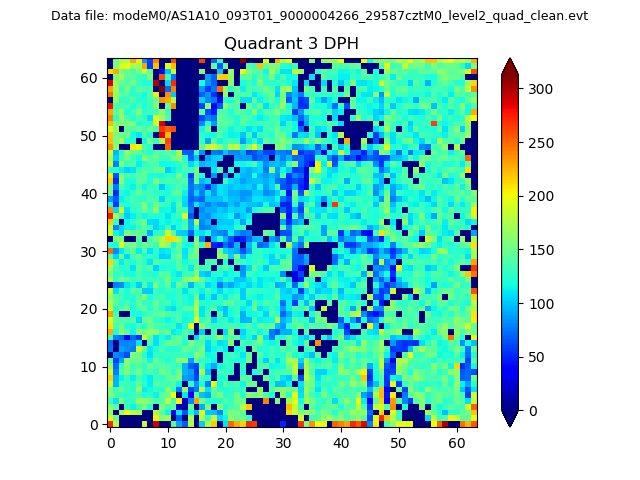 |
 |
Quadrant C |
| Plot type | Count rate plots | Images |
|---|---|---|
| Comparison with Poisson distribution Blue bars denote a histogram of data divided into 1 sec bins. Red curve is a Poisson curve with rate = median count rate of data. |
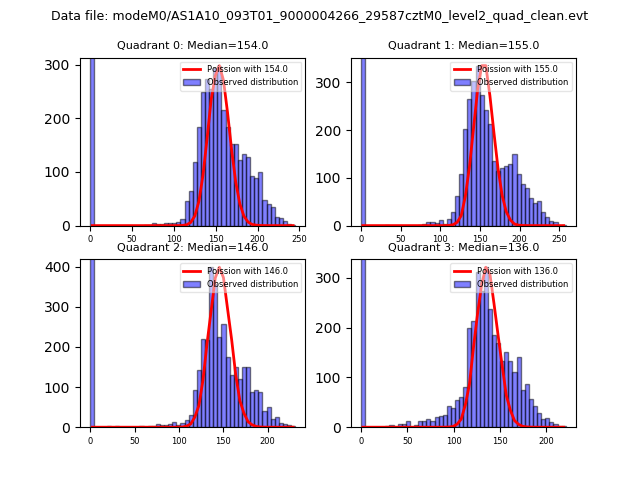 |
 |
| Quadrant-wise count rates Data is divided into 100 sec bins |
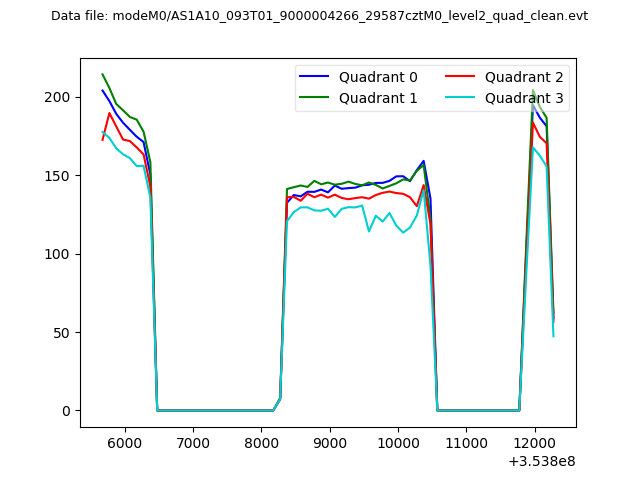 |
|
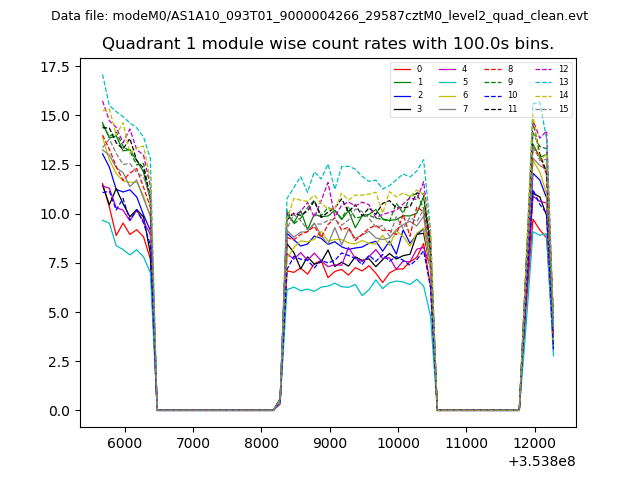
| Module-wise count rates for Quadrant A Data is divided into 100 sec bins |
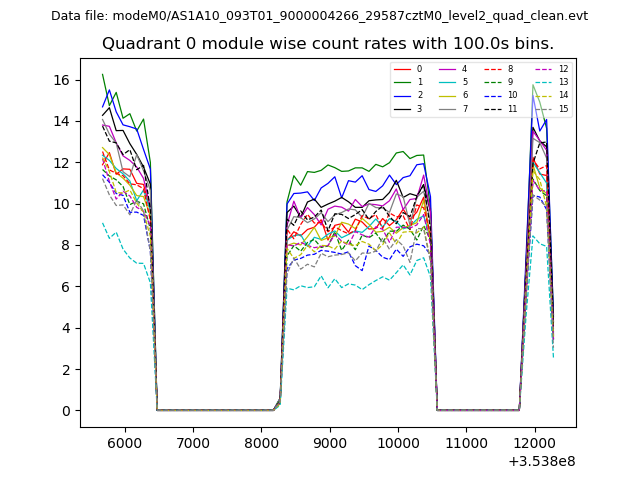 |
 |
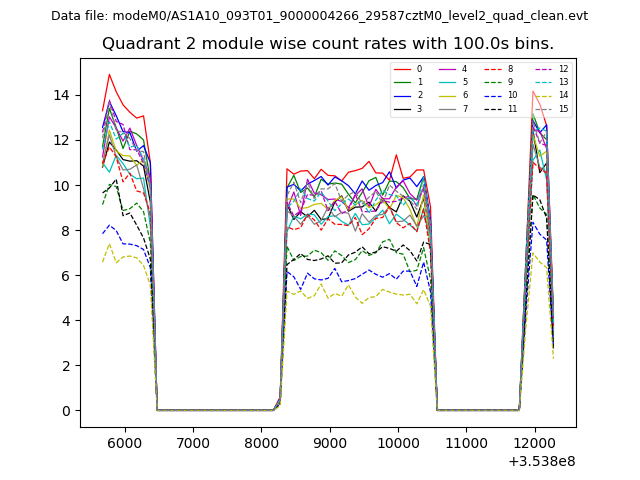
| Module-wise count rates for Quadrant B Data is divided into 100 sec bins |
 |
 |
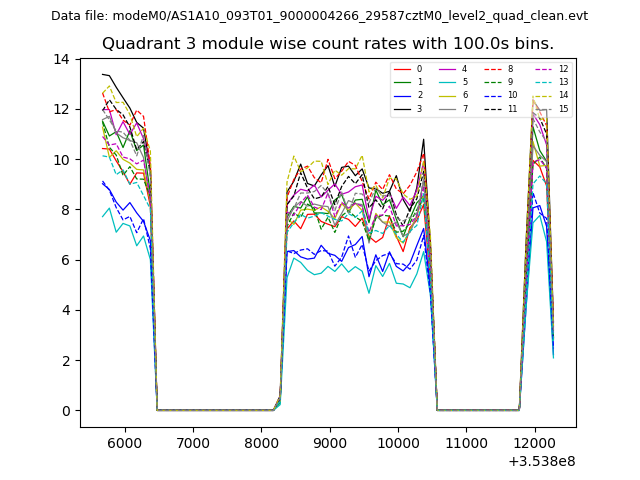
| Module-wise count rates for Quadrant C Data is divided into 100 sec bins |
 |
 |
| Module-wise count rates for Quadrant D Data is divided into 100 sec bins |
 |
 |
| Parameter | Plot |
|---|---|
| CZT HV Monitor | 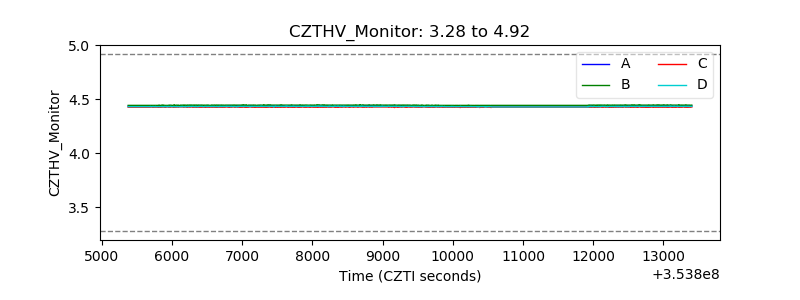 |
| D_VDD | 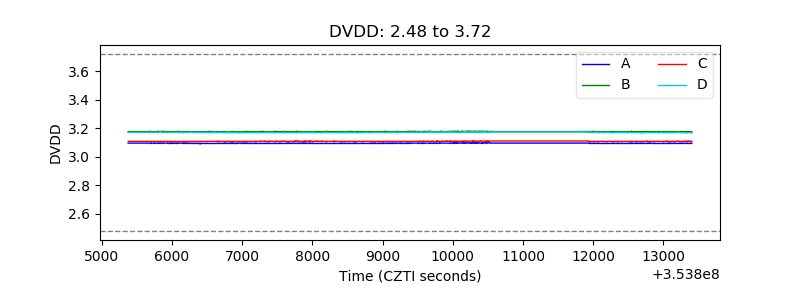 |
| Temperature 1 | 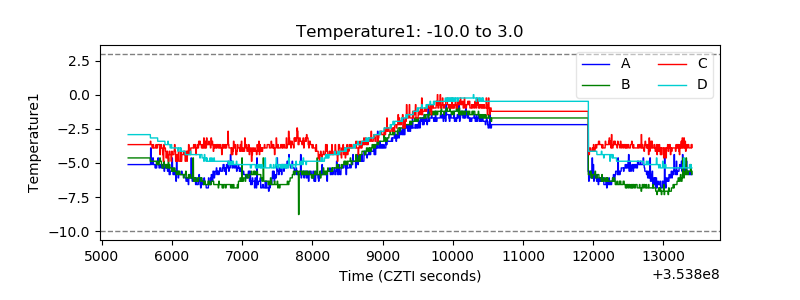 |
| Veto HV Monitor | 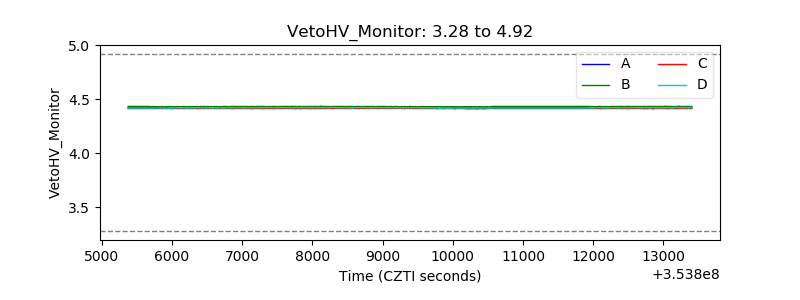 |
| Veto LLD |  |
| Alpha Counter | 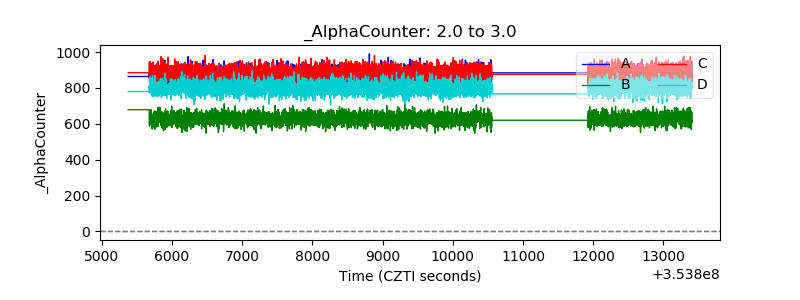 |
| _CPM_Rate | 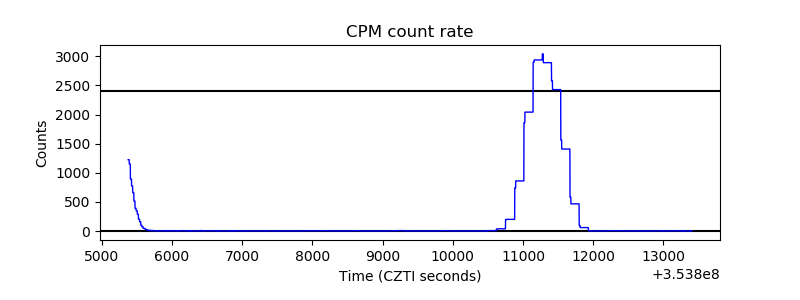 |
| CZT Counter |  |
| +2.5 Volts monitor |  |
| +5 Volts monitor |  |
| _ROLL_ROT | 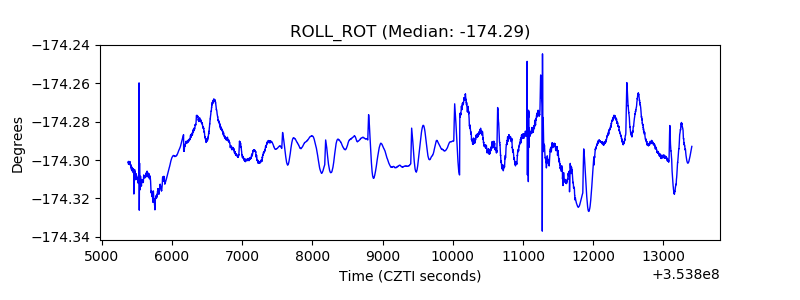 |
| _Roll_DEC | 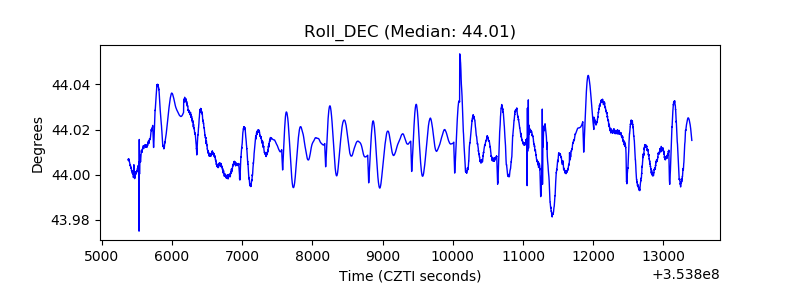 |
| _Roll_RA |  |
| Veto Counter | 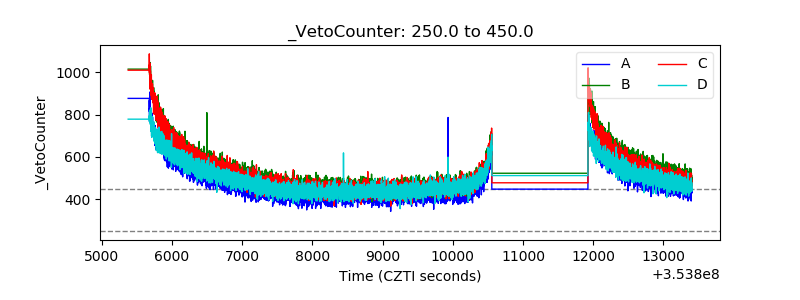 |