| Param | Original file | Final file |
|---|---|---|
| Filename | modeM0/AS1A10_093T01_9000004266_29589cztM0_level2.evt | modeM0/AS1A10_093T01_9000004266_29589cztM0_level2_quad_clean.evt |
| Size (bytes) | 610,813,440 | 70,608,960 |
| Size | 582.5 MB | 67.3 MB |
| Events in quadrant A | 3,971,249 | 431,785 |
| Events in quadrant B | 5,468,164 | 451,738 |
| Events in quadrant C | 3,180,208 | 422,640 |
| Events in quadrant D | 5,457,536 | 396,529 |
| Mode M9 | |||
|---|---|---|---|
| Quadrant | BADHDUFLAG | Total packets | Discarded packets |
| A | 0 | 10 | 0 |
| B | 0 | 10 | 0 |
| C | 0 | 10 | 0 |
| D | 0 | 10 | 0 |
| Mode M0 | |||
|---|---|---|---|
| Quadrant | BADHDUFLAG | Total packets | Discarded packets |
| A | 0 | 15659 | 1 |
| B | 0 | 20545 | 1 |
| C | 0 | 13234 | 1 |
| D | 0 | 20418 | 1 |
| Mode SS | |||
|---|---|---|---|
| Quadrant | BADHDUFLAG | Total packets | Discarded packets |
| A | 0 | 128 | 0 |
| B | 0 | 128 | 0 |
| C | 0 | 128 | 0 |
| D | 0 | 128 | 0 |
| Quadrant | Total seconds | Saturated seconds | Saturation percentage |
|---|---|---|---|
| A | 6224 | 341 | 5.478792% |
| B | 6225 | 363 | 5.831325% |
| C | 6225 | 253 | 4.064257% |
| D | 6225 | 449 | 7.212851% |
Noise dominated data is calculated using 1-second bins in cleaned event files. If a bin has >2000 counts, and if more than 50% of those come from <1% of pixels, then it is considered to be noise-dominated and hence unusable.
| Quadrant | # 1 sec bins | Bins with >0 counts | Bins with >2000 counts | High rate bins dominated by noise | Noise dominated (total time) | Noise dominated (detector-on time) | Marked lightcurve |
|---|---|---|---|---|---|---|---|
| A | 7279 | 6224 | 234 | 234 | 3.21% | 3.76% | 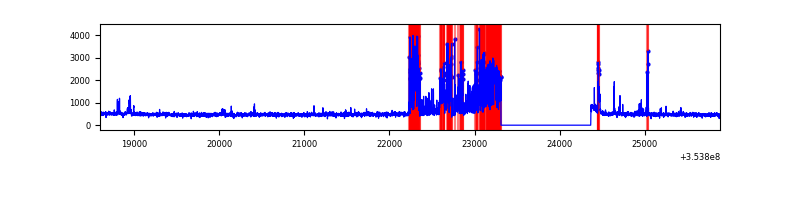 |
| B | 7280 | 6225 | 137 | 137 | 1.88% | 2.20% | 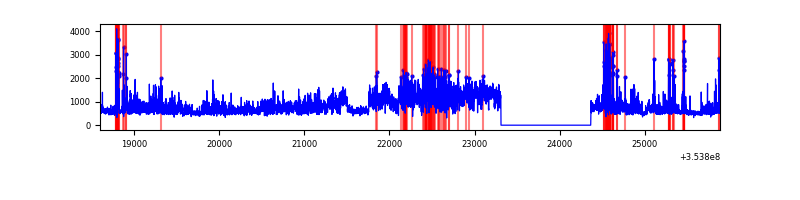 |
| C | 7280 | 6226 | 0 | 0 | 0.00% | 0.00% | 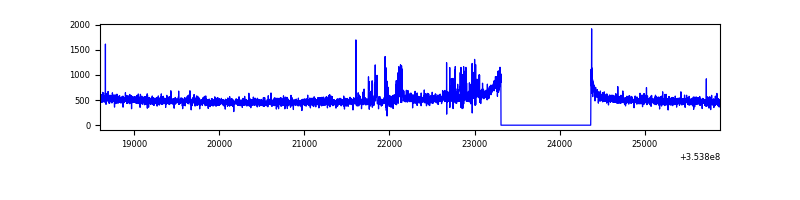 |
| D | 7280 | 6226 | 361 | 361 | 4.96% | 5.80% | 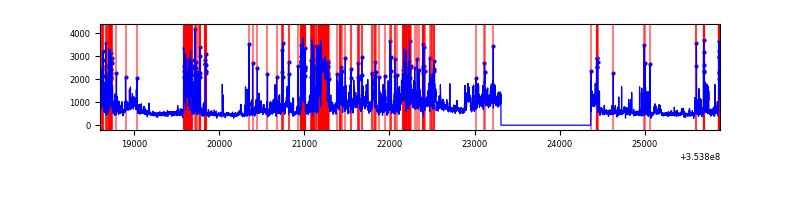 |
Top three noisy pixels from each quadrant. If the there are fewer than three noisy pixels in the level2.evt file, extra rows are filled as -1
| Pixel properties | Quadrant properties | ||||||
|---|---|---|---|---|---|---|---|
| Quadrant | DetID | PixID | Counts | Sigma | Mean | Median | Sigma |
| A | 0 | 13 | 1005339 | 6569.82 | 764 | 749 | 152.9 |
| A | 13 | 254 | 12021 | 73.72 | 764 | 749 | 152.9 |
| A | 12 | 96 | 10138 | 61.4 | 764 | 749 | 152.9 |
| B | 0 | 189 | 2090431 | 14173.42 | 772 | 751 | 147.4 |
| B | 15 | 33 | 325300 | 2201.28 | 772 | 751 | 147.4 |
| B | 12 | 111 | 17311 | 112.32 | 772 | 751 | 147.4 |
| C | 14 | 238 | 164051 | 952.96 | 741 | 745 | 171.4 |
| C | 14 | 254 | 63632 | 366.97 | 741 | 745 | 171.4 |
| C | 3 | 233 | 41905 | 240.19 | 741 | 745 | 171.4 |
| D | 7 | 80 | 685649 | 3938.98 | 731 | 714 | 173.9 |
| D | 13 | 153 | 555205 | 3188.81 | 731 | 714 | 173.9 |
| D | 12 | 227 | 490461 | 2816.48 | 731 | 714 | 173.9 |
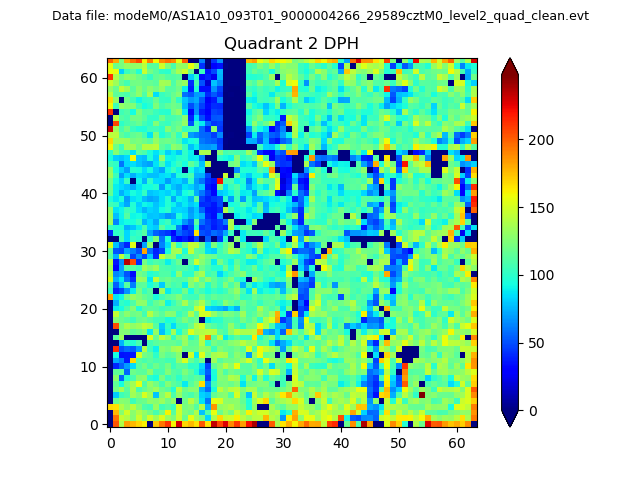
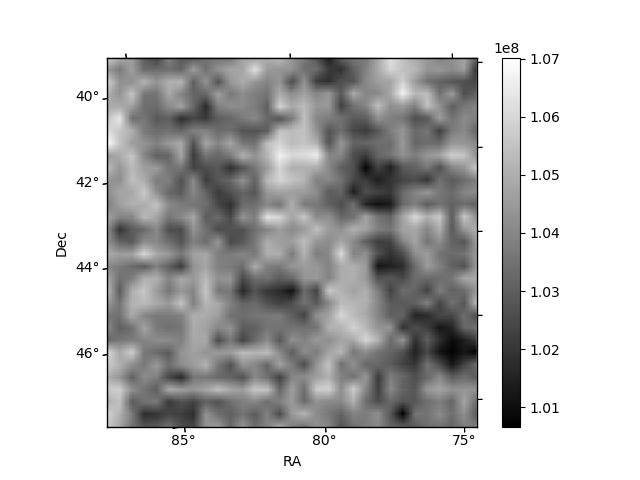
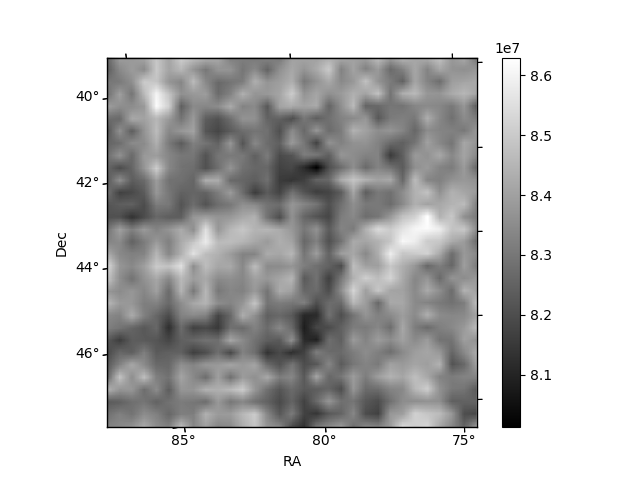
Histogram calculated using DETX and DETY for each event in the final _common_clean file
| Quadrant A | 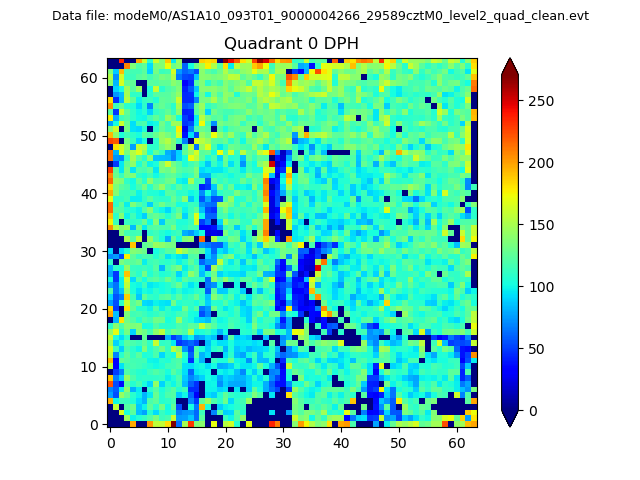 |
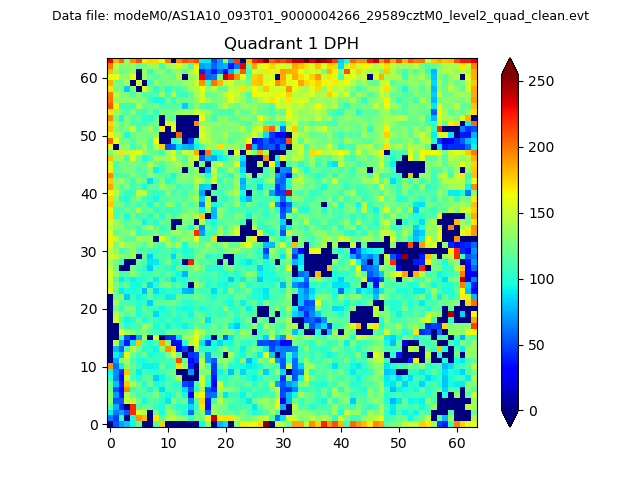 |
Quadrant B |
|---|---|---|---|
| Quadrant D | 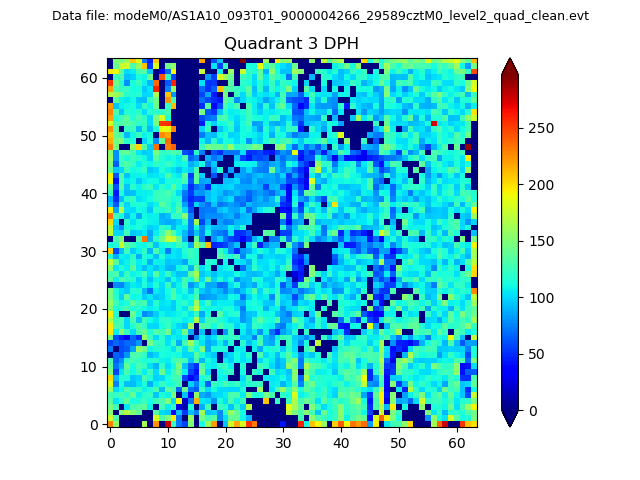 |
 |
Quadrant C |
| Plot type | Count rate plots | Images |
|---|---|---|
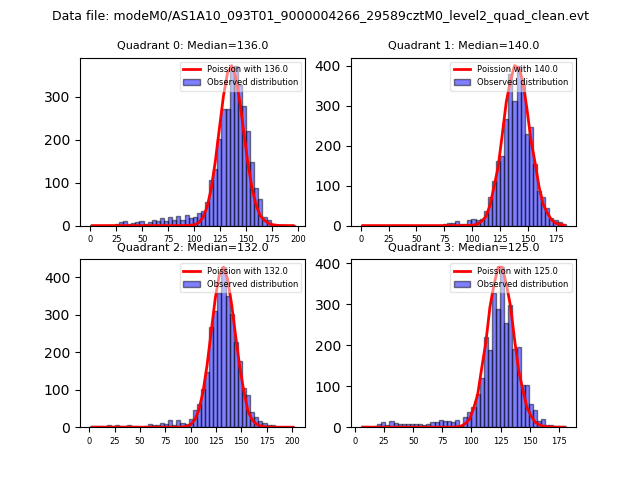
| Comparison with Poisson distribution Blue bars denote a histogram of data divided into 1 sec bins. Red curve is a Poisson curve with rate = median count rate of data. |
 |
 |
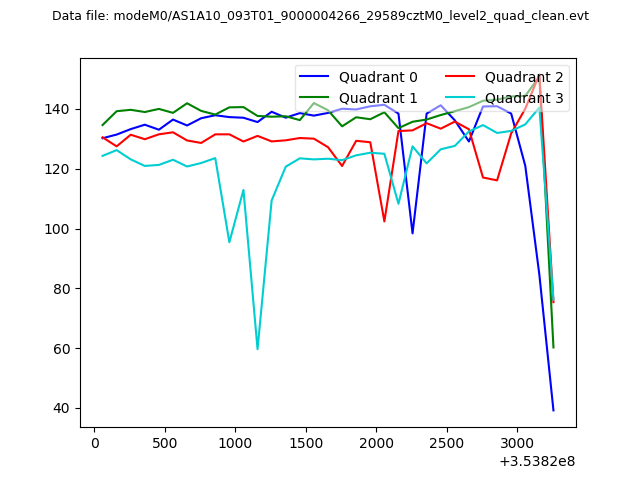
| Quadrant-wise count rates Data is divided into 100 sec bins |
 |
|
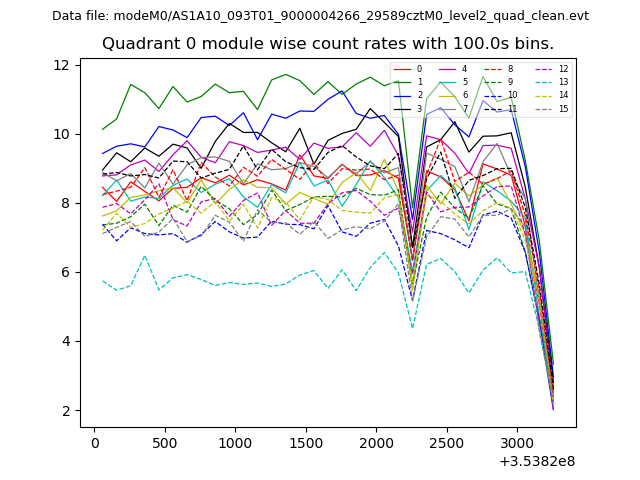
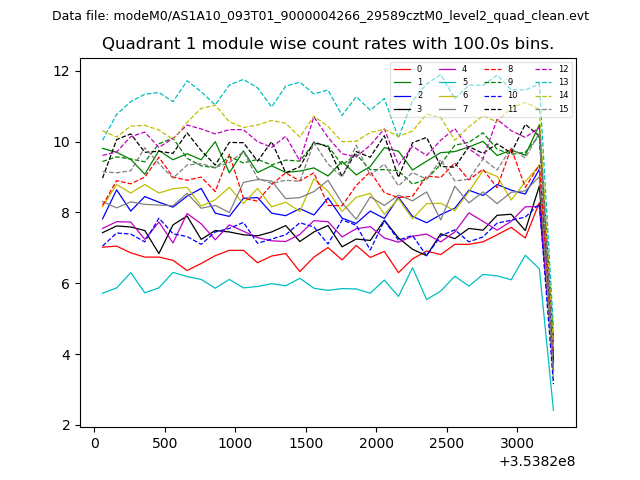
| Module-wise count rates for Quadrant A Data is divided into 100 sec bins |
 |
 |
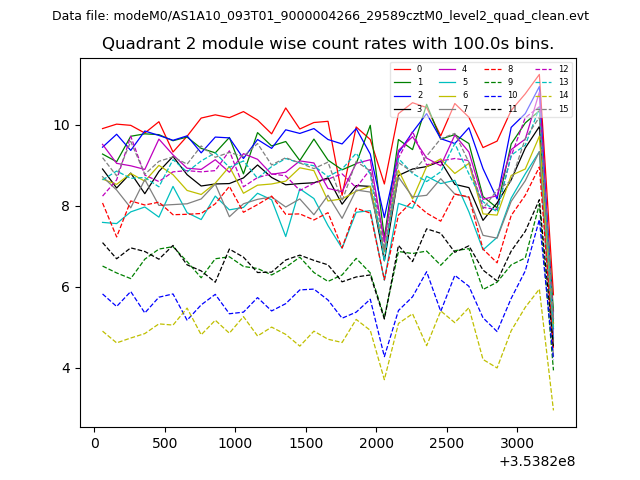
| Module-wise count rates for Quadrant B Data is divided into 100 sec bins |
 |
 |
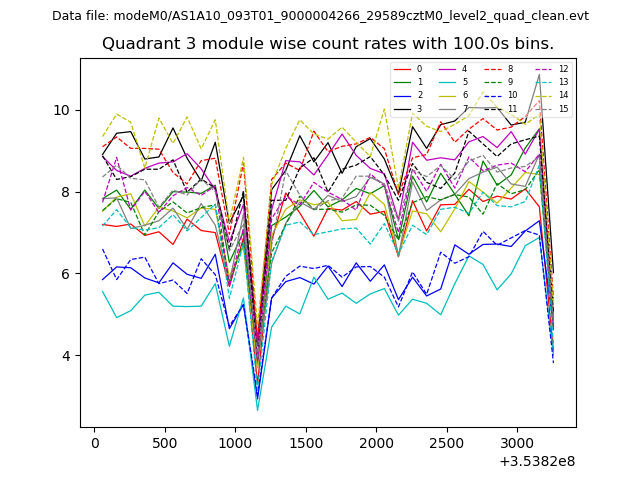
| Module-wise count rates for Quadrant C Data is divided into 100 sec bins |
 |
 |
| Module-wise count rates for Quadrant D Data is divided into 100 sec bins |
 |
 |
| Parameter | Plot |
|---|---|
| CZT HV Monitor | 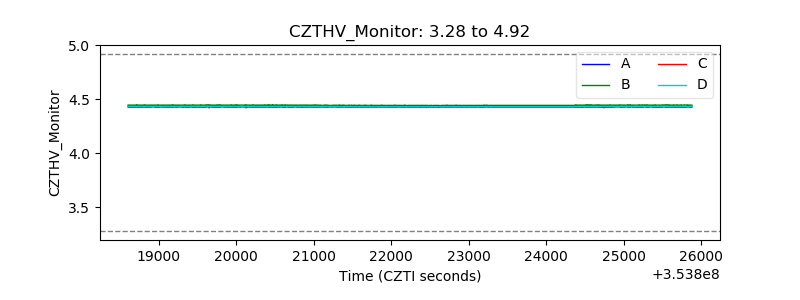 |
| D_VDD | 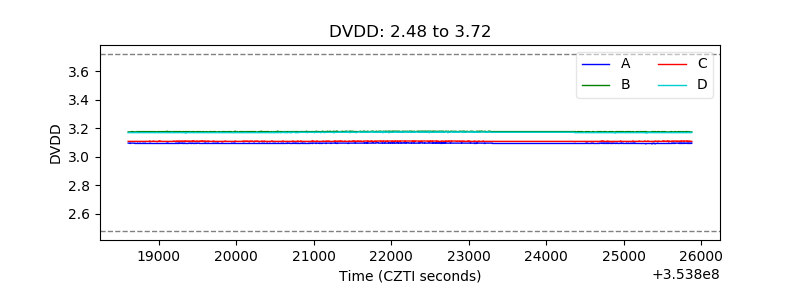 |
| Temperature 1 | 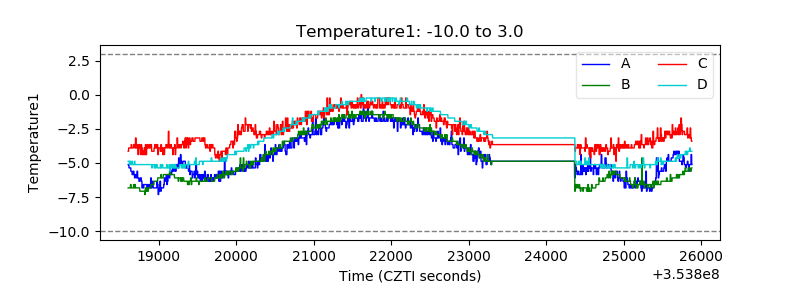 |
| Veto HV Monitor | 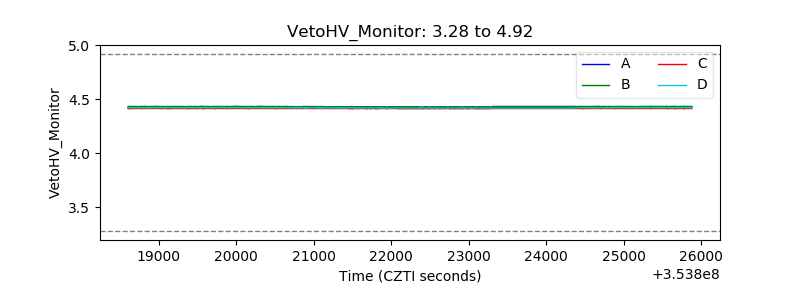 |
| Veto LLD |  |
| Alpha Counter |  |
| _CPM_Rate |  |
| CZT Counter |  |
| +2.5 Volts monitor |  |
| +5 Volts monitor |  |
| _ROLL_ROT | 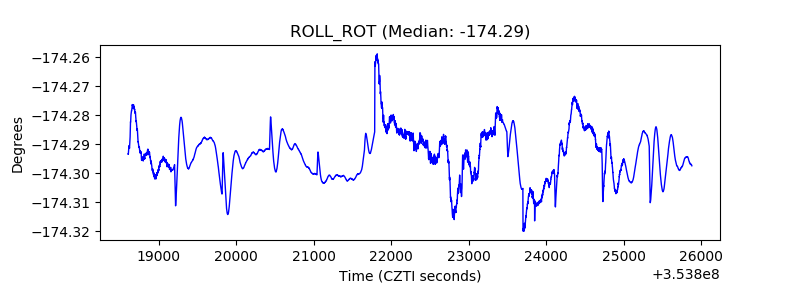 |
| _Roll_DEC | 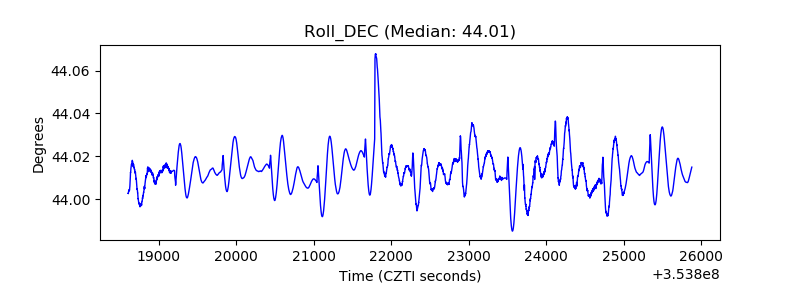 |
| _Roll_RA | 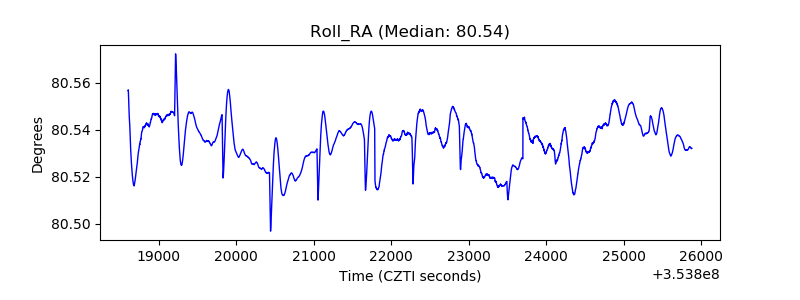 |
| Veto Counter | 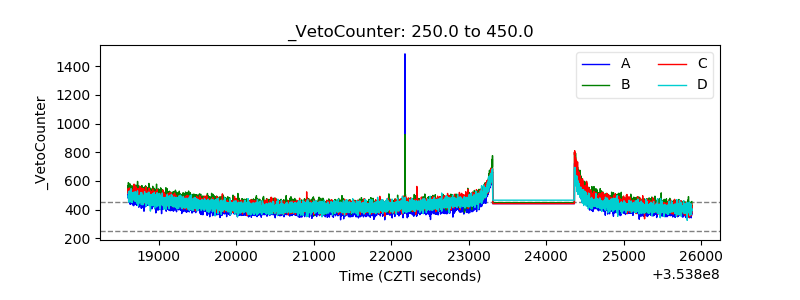 |