| Param | Original file | Final file |
|---|---|---|
| Filename | modeM0/AS1A10_093T01_9000004266_29590cztM0_level2.evt | modeM0/AS1A10_093T01_9000004266_29590cztM0_level2_quad_clean.evt |
| Size (bytes) | 639,524,160 | 86,604,480 |
| Size | 609.9 MB | 82.6 MB |
| Events in quadrant A | 3,562,861 | 566,892 |
| Events in quadrant B | 4,656,821 | 576,982 |
| Events in quadrant C | 3,748,690 | 531,313 |
| Events in quadrant D | 6,927,762 | 461,316 |
| Mode M9 | |||
|---|---|---|---|
| Quadrant | BADHDUFLAG | Total packets | Discarded packets |
| A | 0 | 7 | 0 |
| B | 0 | 7 | 0 |
| C | 0 | 7 | 0 |
| D | 0 | 7 | 0 |
| Mode M0 | |||
|---|---|---|---|
| Quadrant | BADHDUFLAG | Total packets | Discarded packets |
| A | 0 | 14910 | 1 |
| B | 0 | 18451 | 1 |
| C | 0 | 15427 | 1 |
| D | 0 | 25193 | 1 |
| Mode SS | |||
|---|---|---|---|
| Quadrant | BADHDUFLAG | Total packets | Discarded packets |
| A | 0 | 140 | 0 |
| B | 0 | 140 | 0 |
| C | 0 | 140 | 0 |
| D | 0 | 140 | 0 |
| Quadrant | Total seconds | Saturated seconds | Saturation percentage |
|---|---|---|---|
| A | 6976 | 114 | 1.634174% |
| B | 6977 | 224 | 3.210549% |
| C | 6977 | 276 | 3.955855% |
| D | 6977 | 1084 | 15.536764% |
Noise dominated data is calculated using 1-second bins in cleaned event files. If a bin has >2000 counts, and if more than 50% of those come from <1% of pixels, then it is considered to be noise-dominated and hence unusable.
| Quadrant | # 1 sec bins | Bins with >0 counts | Bins with >2000 counts | High rate bins dominated by noise | Noise dominated (total time) | Noise dominated (detector-on time) | Marked lightcurve |
|---|---|---|---|---|---|---|---|
| A | 7611 | 6976 | 9 | 9 | 0.12% | 0.13% | 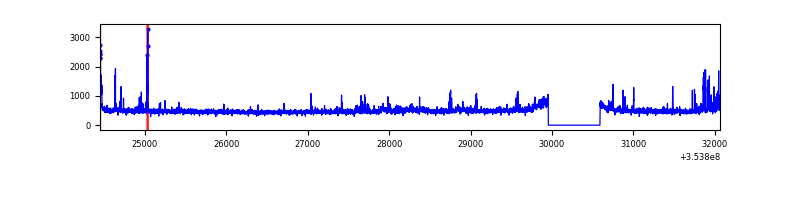 |
| B | 7612 | 6977 | 77 | 77 | 1.01% | 1.10% | 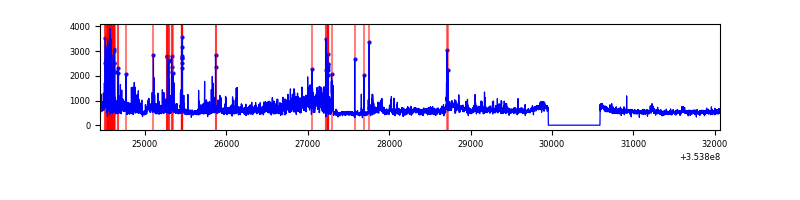 |
| C | 7612 | 6978 | 0 | 0 | 0.00% | 0.00% | 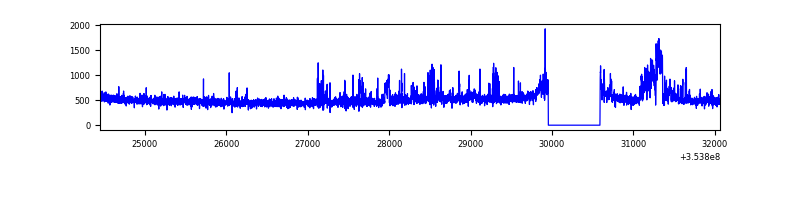 |
| D | 7612 | 6978 | 917 | 917 | 12.05% | 13.14% | 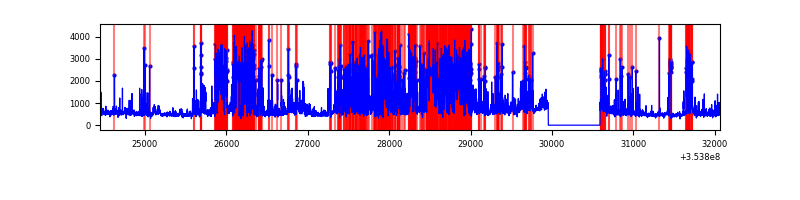 |
Top three noisy pixels from each quadrant. If the there are fewer than three noisy pixels in the level2.evt file, extra rows are filled as -1
| Pixel properties | Quadrant properties | ||||||
|---|---|---|---|---|---|---|---|
| Quadrant | DetID | PixID | Counts | Sigma | Mean | Median | Sigma |
| A | 0 | 13 | 246849 | 1419.91 | 858 | 837 | 173.3 |
| A | 13 | 254 | 14548 | 79.14 | 858 | 837 | 173.3 |
| A | 3 | 137 | 8393 | 43.61 | 858 | 837 | 173.3 |
| B | 0 | 189 | 1007725 | 6221.33 | 849 | 825 | 161.8 |
| B | 15 | 33 | 252949 | 1557.8 | 849 | 825 | 161.8 |
| B | 5 | 172 | 33577 | 202.36 | 849 | 825 | 161.8 |
| C | 3 | 233 | 315920 | 1669.58 | 814 | 821 | 188.7 |
| C | 14 | 238 | 173536 | 915.15 | 814 | 821 | 188.7 |
| C | 14 | 254 | 61811 | 323.16 | 814 | 821 | 188.7 |
| D | 7 | 80 | 2743554 | 15029.77 | 770 | 748 | 182.5 |
| D | 13 | 153 | 365093 | 1996.5 | 770 | 748 | 182.5 |
| D | 8 | 195 | 305328 | 1669.01 | 770 | 748 | 182.5 |
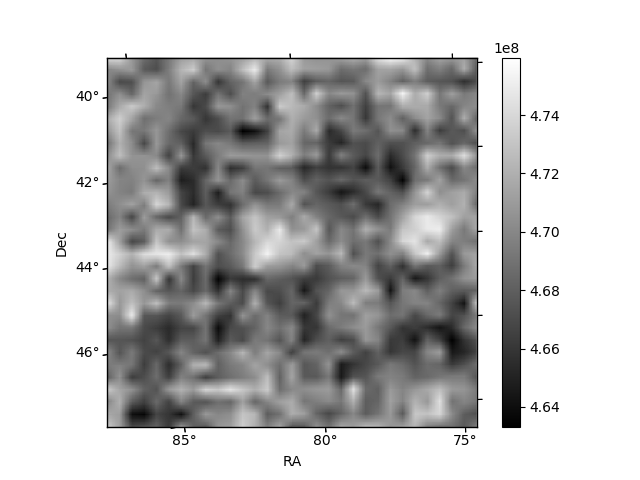
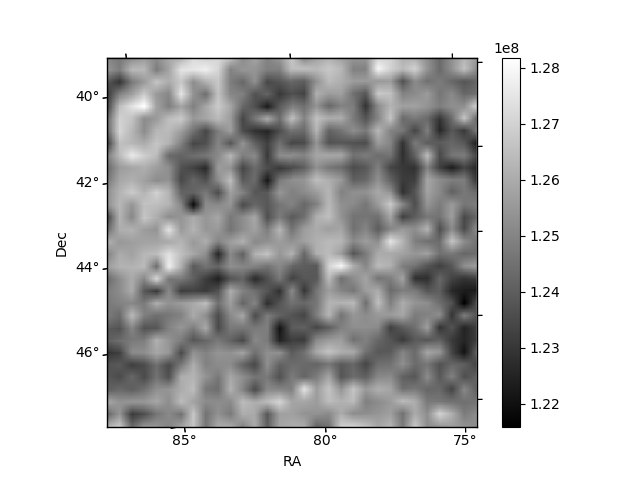
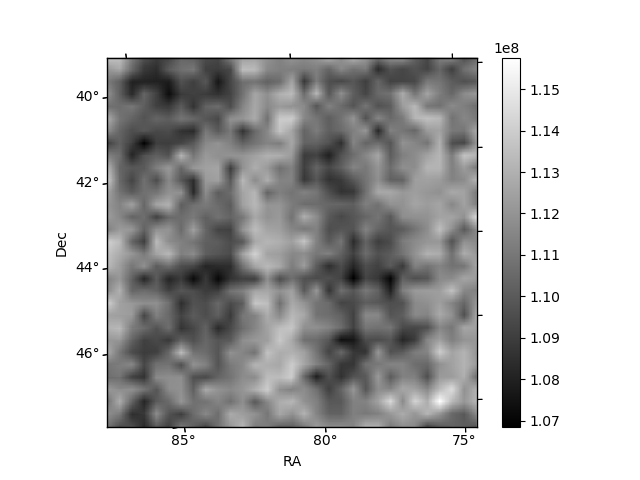
Histogram calculated using DETX and DETY for each event in the final _common_clean file
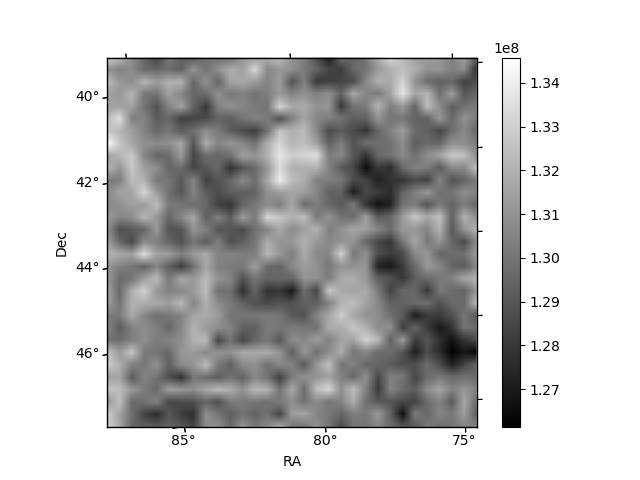
| Quadrant A | 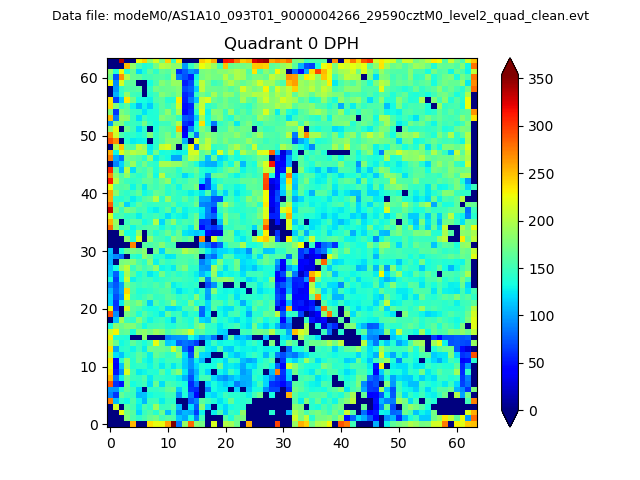 |
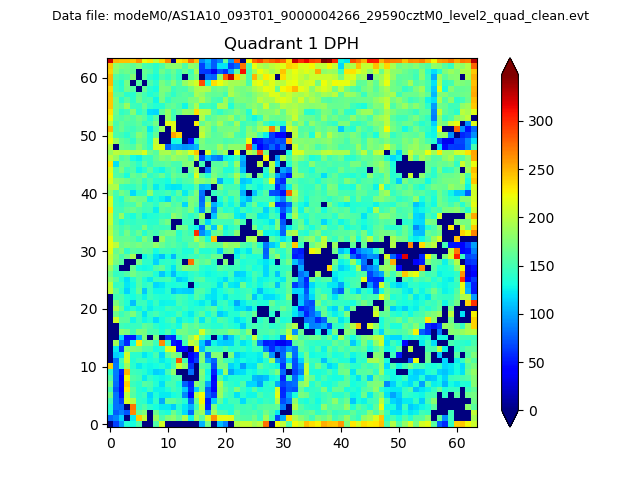 |
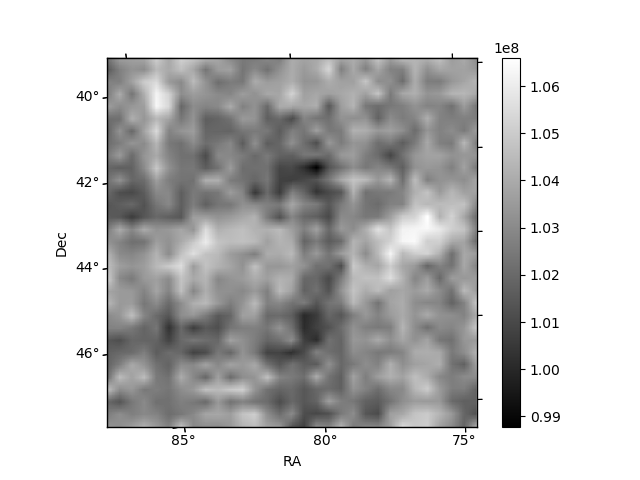
Quadrant B |
|---|---|---|---|
| Quadrant D | 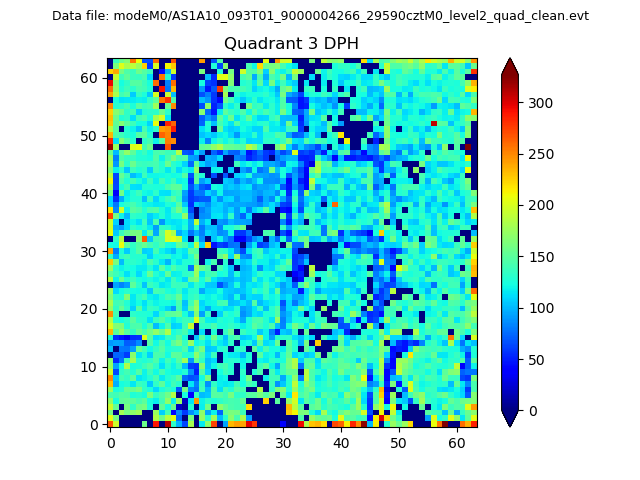 |
 |
Quadrant C |
| Plot type | Count rate plots | Images |
|---|---|---|
| Comparison with Poisson distribution Blue bars denote a histogram of data divided into 1 sec bins. Red curve is a Poisson curve with rate = median count rate of data. |
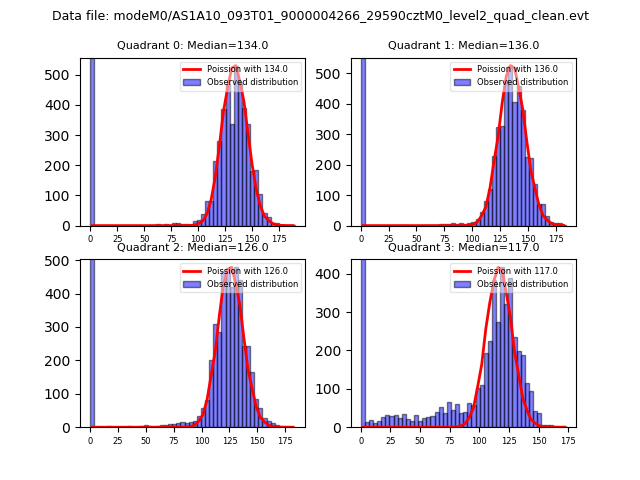 |
 |
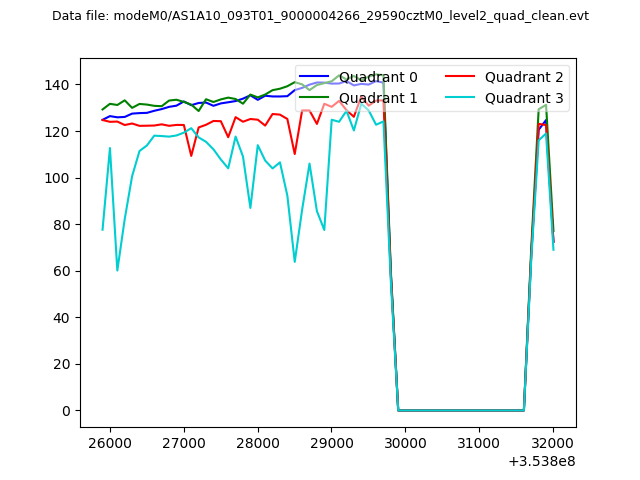
| Quadrant-wise count rates Data is divided into 100 sec bins |
 |
|
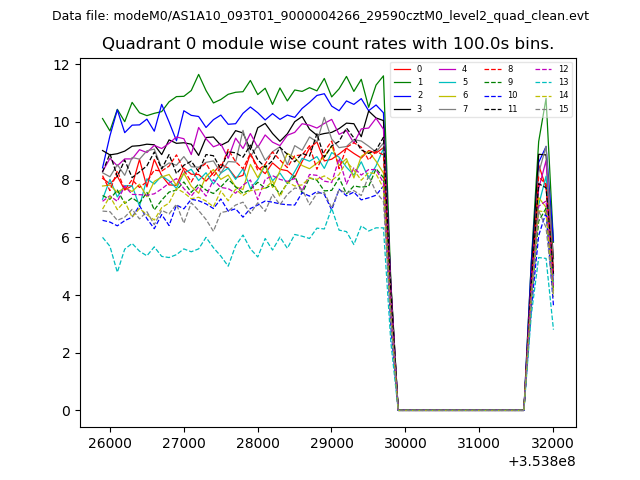
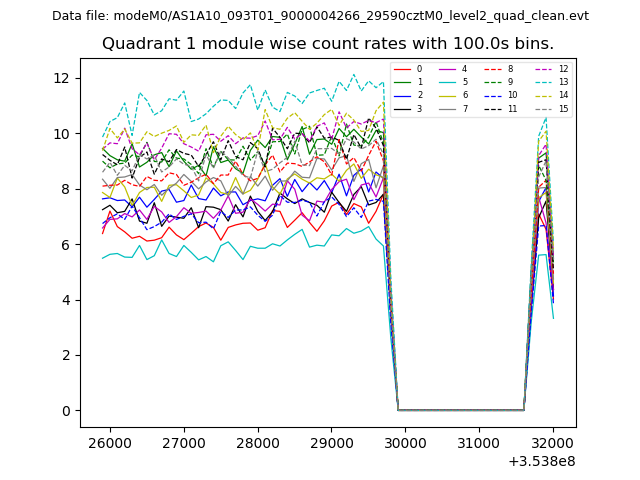
| Module-wise count rates for Quadrant A Data is divided into 100 sec bins |
 |
 |
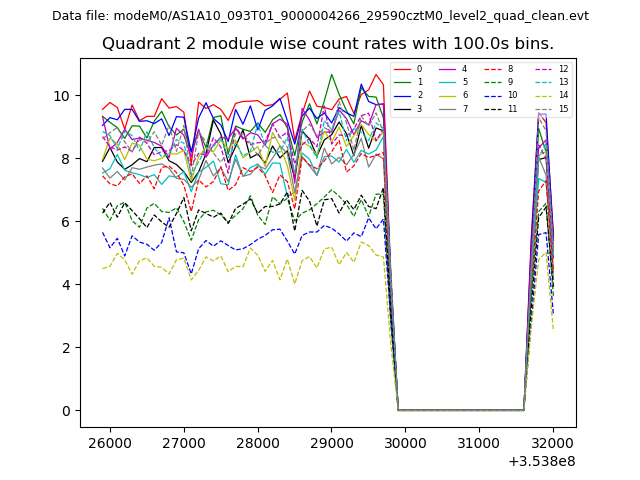
| Module-wise count rates for Quadrant B Data is divided into 100 sec bins |
 |
 |
| Module-wise count rates for Quadrant C Data is divided into 100 sec bins |
 |
 |
| Module-wise count rates for Quadrant D Data is divided into 100 sec bins |
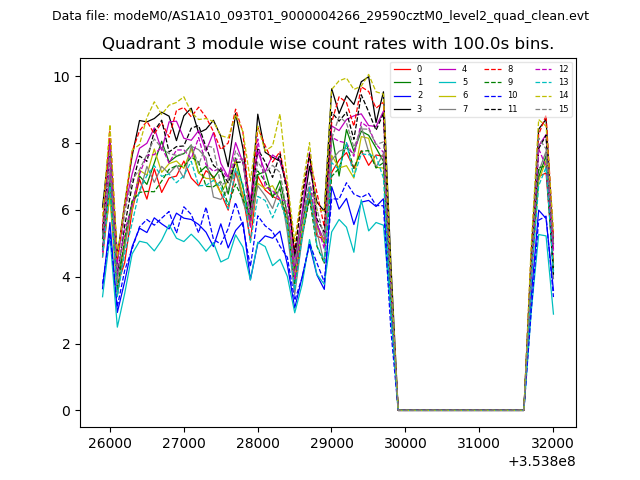 |
 |
| Parameter | Plot |
|---|---|
| CZT HV Monitor | 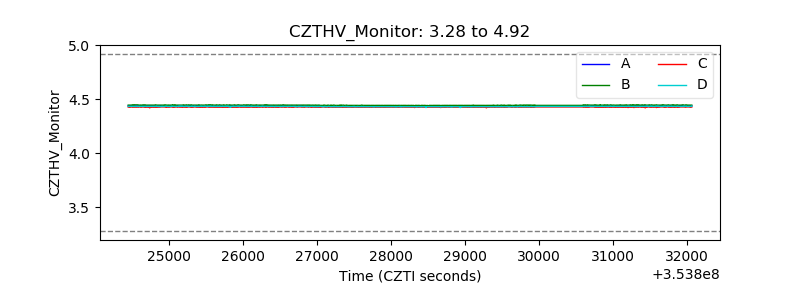 |
| D_VDD | 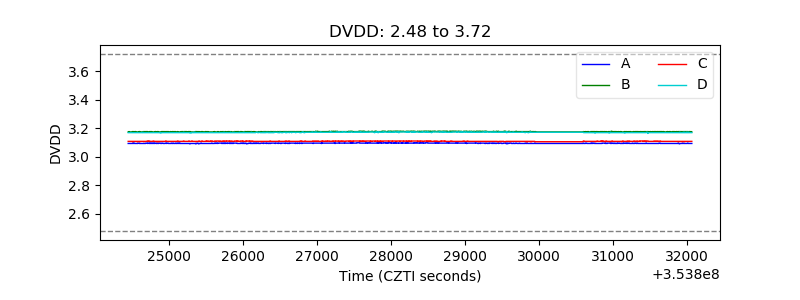 |
| Temperature 1 |  |
| Veto HV Monitor |  |
| Veto LLD |  |
| Alpha Counter | 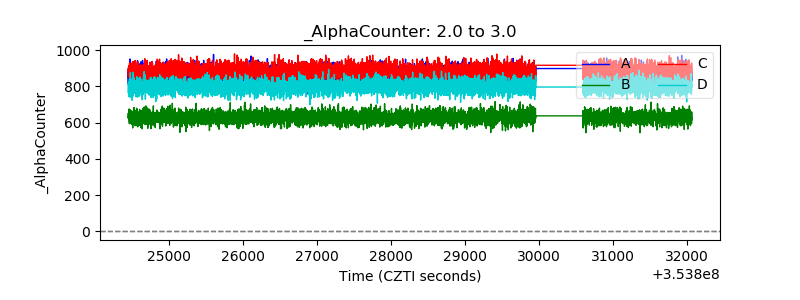 |
| _CPM_Rate | 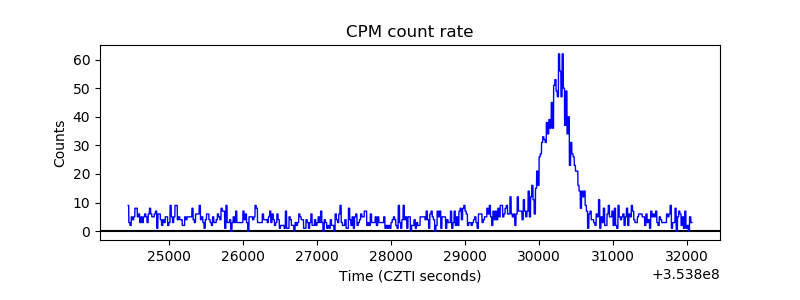 |
| CZT Counter |  |
| +2.5 Volts monitor |  |
| +5 Volts monitor | 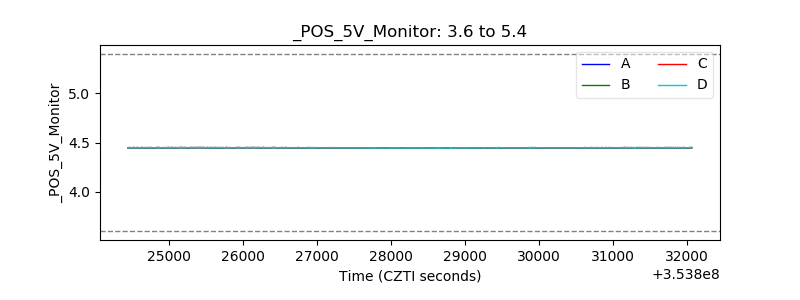 |
| _ROLL_ROT | 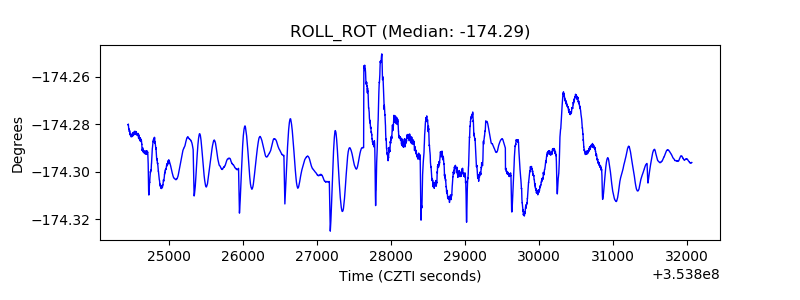 |
| _Roll_DEC | 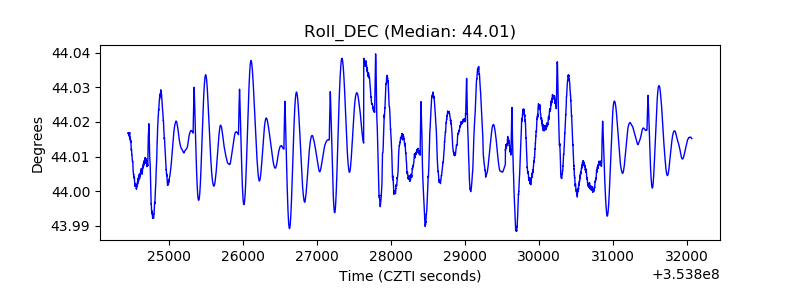 |
| _Roll_RA | 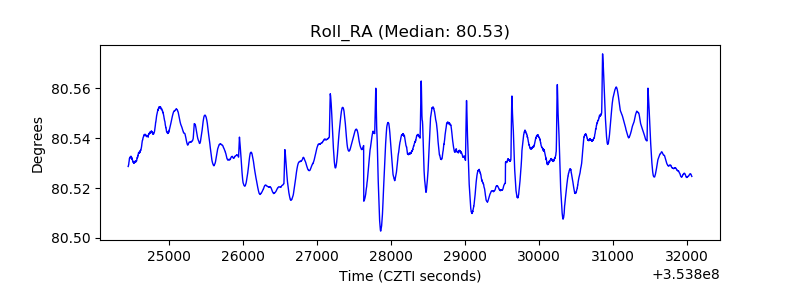 |
| Veto Counter | 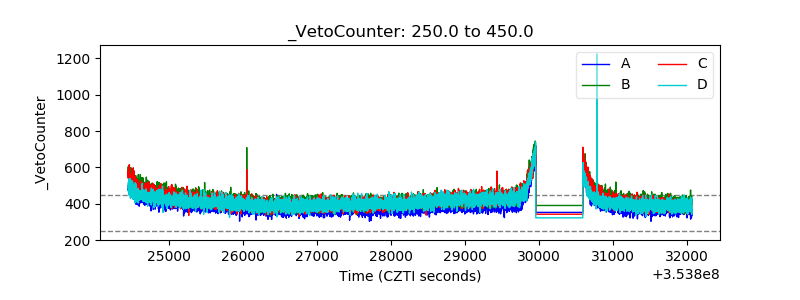 |