| Param | Original file | Final file |
|---|---|---|
| Filename | modeM0/AS1A10_093T01_9000004266_29592cztM0_level2.evt | modeM0/AS1A10_093T01_9000004266_29592cztM0_level2_quad_clean.evt |
| Size (bytes) | 567,636,480 | 101,479,680 |
| Size | 541.3 MB | 96.8 MB |
| Events in quadrant A | 3,508,954 | 663,418 |
| Events in quadrant B | 4,011,817 | 676,503 |
| Events in quadrant C | 3,723,770 | 628,611 |
| Events in quadrant D | 5,460,988 | 606,687 |
| Mode M0 | |||
|---|---|---|---|
| Quadrant | BADHDUFLAG | Total packets | Discarded packets |
| A | 0 | 15020 | 2 |
| B | 0 | 16481 | 2 |
| C | 0 | 15562 | 2 |
| D | 0 | 20831 | 2 |
| Mode SS | |||
|---|---|---|---|
| Quadrant | BADHDUFLAG | Total packets | Discarded packets |
| A | 0 | 144 | 0 |
| B | 0 | 144 | 0 |
| C | 0 | 144 | 0 |
| D | 0 | 144 | 0 |
| Quadrant | Total seconds | Saturated seconds | Saturation percentage |
|---|---|---|---|
| A | 7150 | 221 | 3.090909% |
| B | 7150 | 275 | 3.846154% |
| C | 7151 | 219 | 3.062509% |
| D | 7151 | 744 | 10.404139% |
Noise dominated data is calculated using 1-second bins in cleaned event files. If a bin has >2000 counts, and if more than 50% of those come from <1% of pixels, then it is considered to be noise-dominated and hence unusable.
| Quadrant | # 1 sec bins | Bins with >0 counts | Bins with >2000 counts | High rate bins dominated by noise | Noise dominated (total time) | Noise dominated (detector-on time) | Marked lightcurve |
|---|---|---|---|---|---|---|---|
| A | 7220 | 7152 | 6 | 6 | 0.08% | 0.08% | 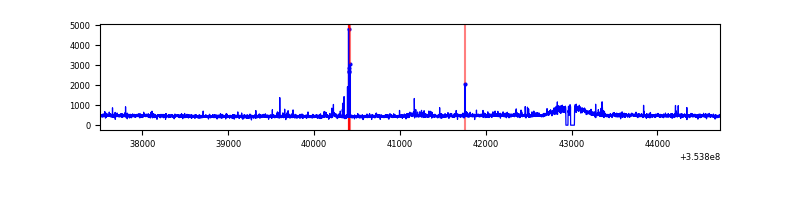 |
| B | 7220 | 7152 | 12 | 12 | 0.17% | 0.17% | 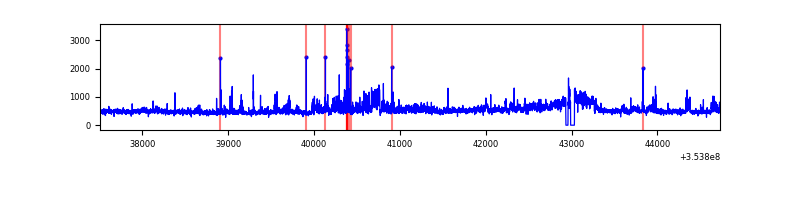 |
| C | 7221 | 7153 | 3 | 3 | 0.04% | 0.04% | 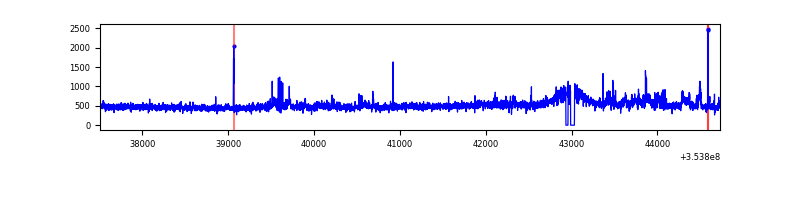 |
| D | 7221 | 7153 | 403 | 403 | 5.58% | 5.63% | 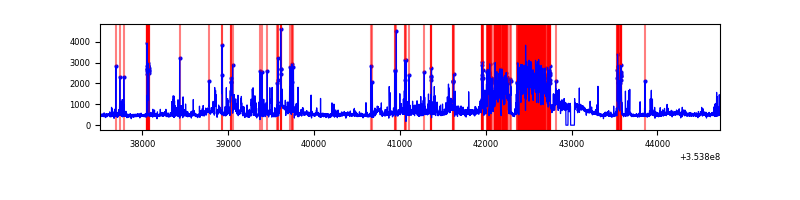 |
Top three noisy pixels from each quadrant. If the there are fewer than three noisy pixels in the level2.evt file, extra rows are filled as -1
| Pixel properties | Quadrant properties | ||||||
|---|---|---|---|---|---|---|---|
| Quadrant | DetID | PixID | Counts | Sigma | Mean | Median | Sigma |
| A | 0 | 13 | 120753 | 671.28 | 877 | 857 | 178.6 |
| A | 13 | 254 | 13787 | 72.39 | 877 | 857 | 178.6 |
| A | 3 | 137 | 8806 | 44.51 | 877 | 857 | 178.6 |
| B | 0 | 189 | 470659 | 2790.75 | 868 | 843 | 168.3 |
| B | 0 | 190 | 29684 | 171.32 | 868 | 843 | 168.3 |
| B | 0 | 229 | 28994 | 167.22 | 868 | 843 | 168.3 |
| C | 3 | 233 | 261639 | 1331.35 | 833 | 837 | 195.9 |
| C | 14 | 238 | 141090 | 715.97 | 833 | 837 | 195.9 |
| C | 15 | 208 | 21273 | 104.32 | 833 | 837 | 195.9 |
| D | 13 | 104 | 1105852 | 5587.96 | 821 | 797 | 197.8 |
| D | 8 | 195 | 456379 | 2303.75 | 821 | 797 | 197.8 |
| D | 13 | 153 | 238919 | 1204.12 | 821 | 797 | 197.8 |
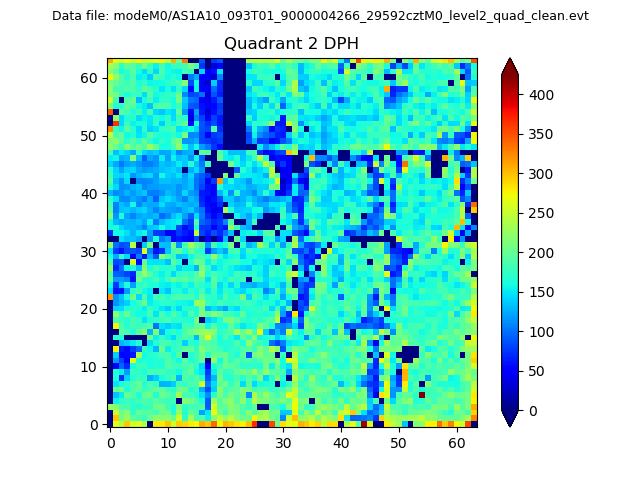
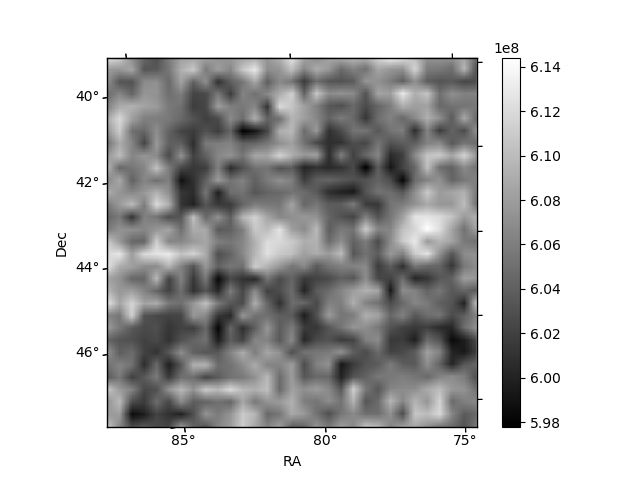
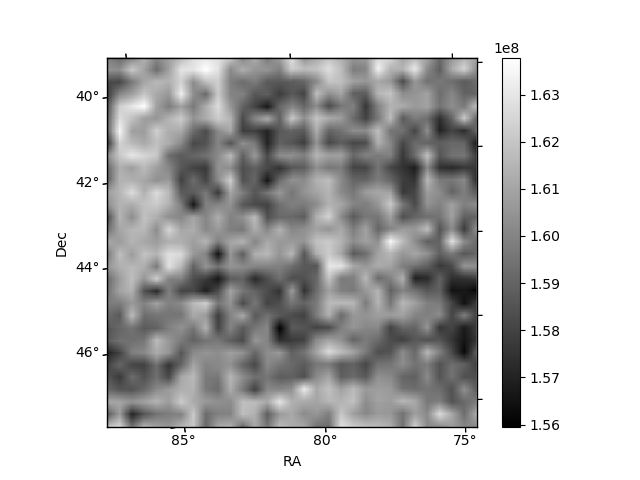
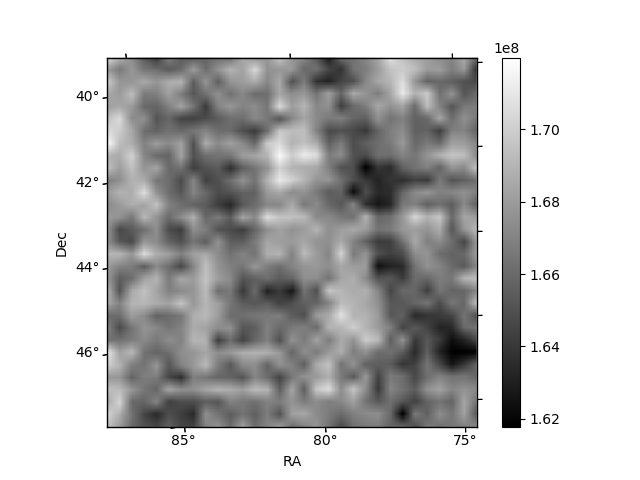
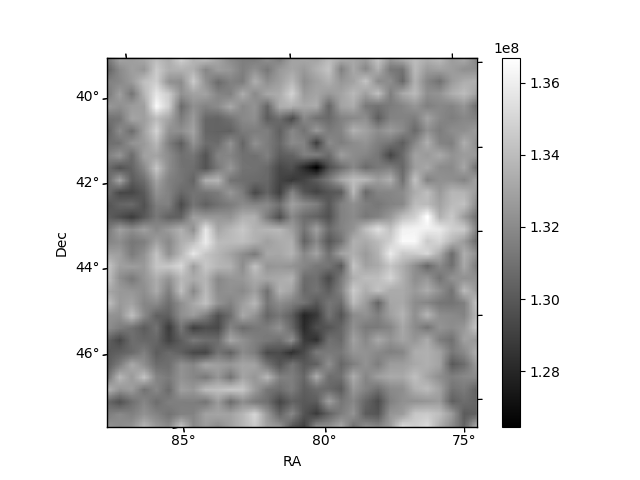
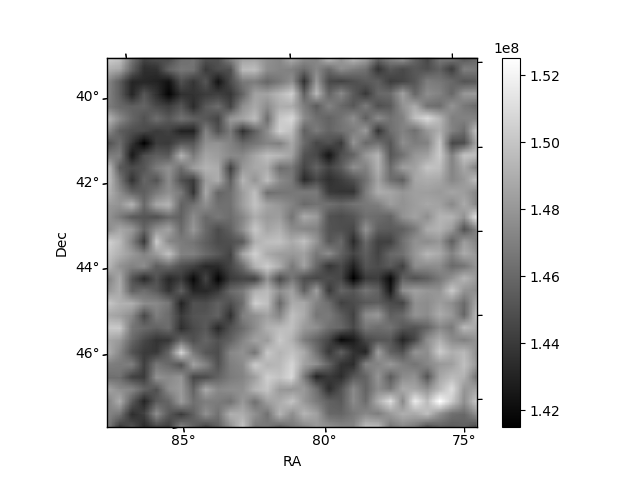
Histogram calculated using DETX and DETY for each event in the final _common_clean file
| Quadrant A | 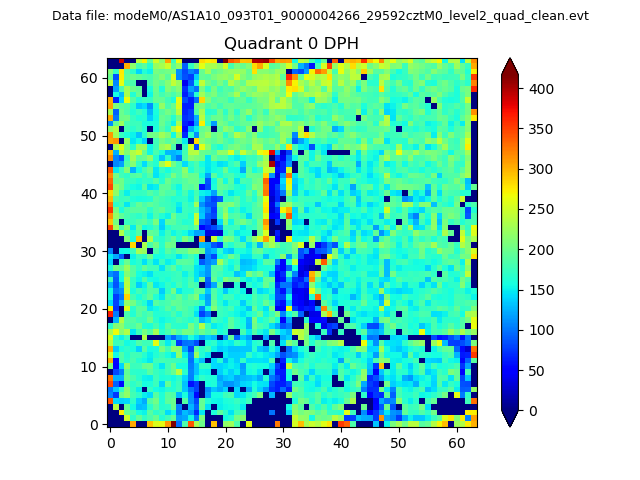 |
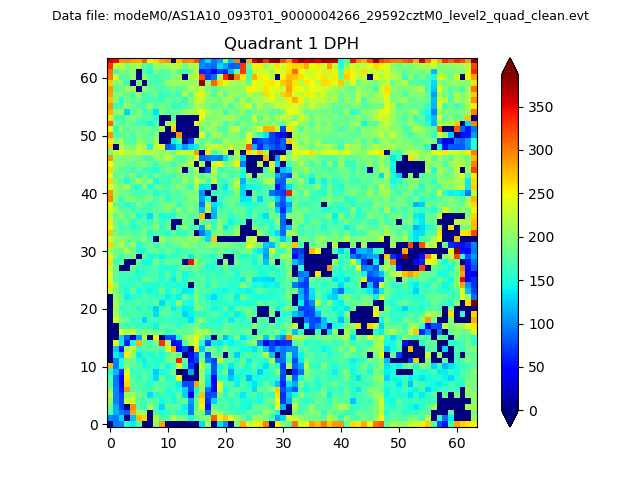 |
Quadrant B |
|---|---|---|---|
| Quadrant D | 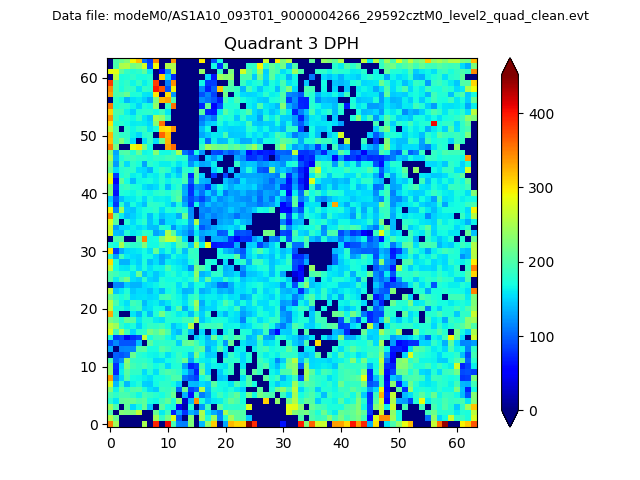 |
 |
Quadrant C |
| Plot type | Count rate plots | Images |
|---|---|---|
| Comparison with Poisson distribution Blue bars denote a histogram of data divided into 1 sec bins. Red curve is a Poisson curve with rate = median count rate of data. |
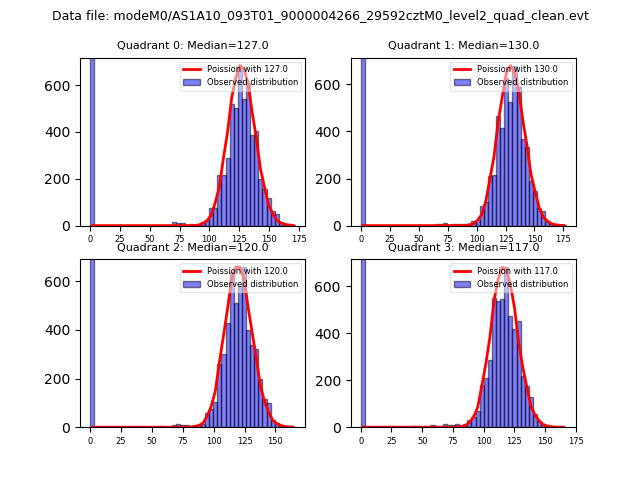 |
 |
| Quadrant-wise count rates Data is divided into 100 sec bins |
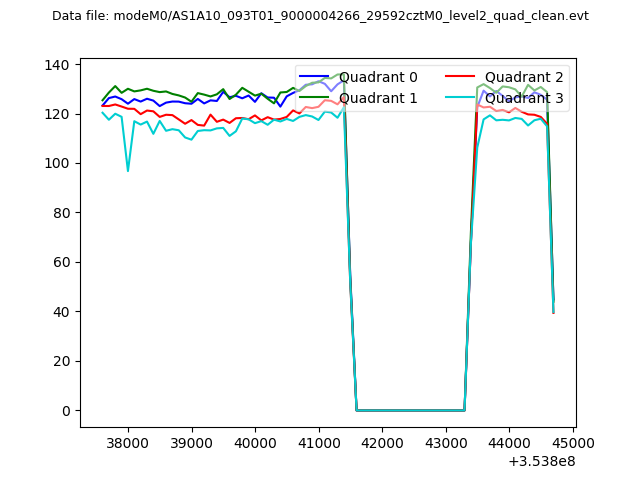 |
|
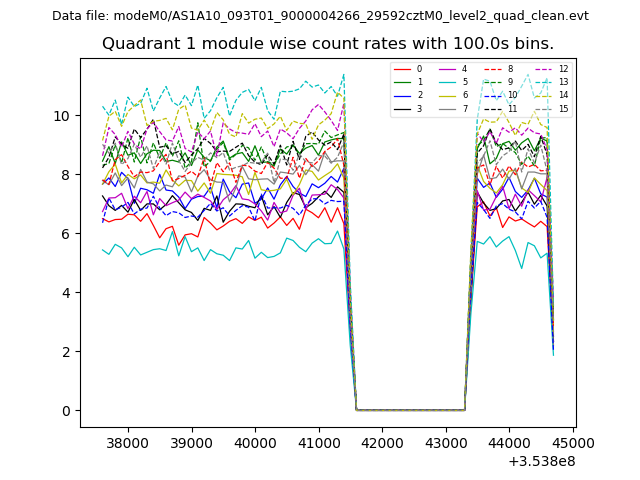
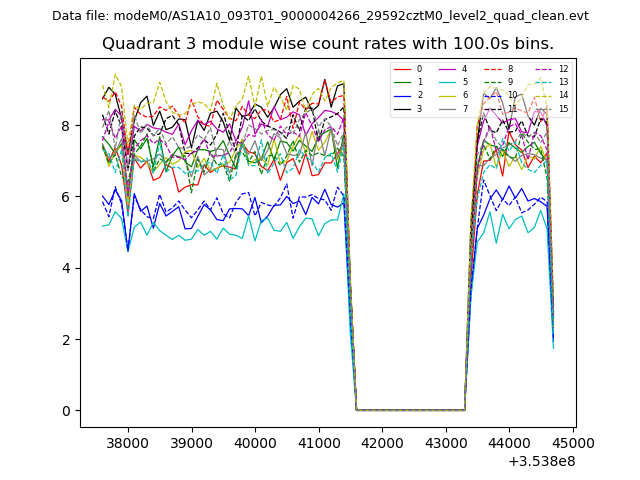
| Module-wise count rates for Quadrant A Data is divided into 100 sec bins |
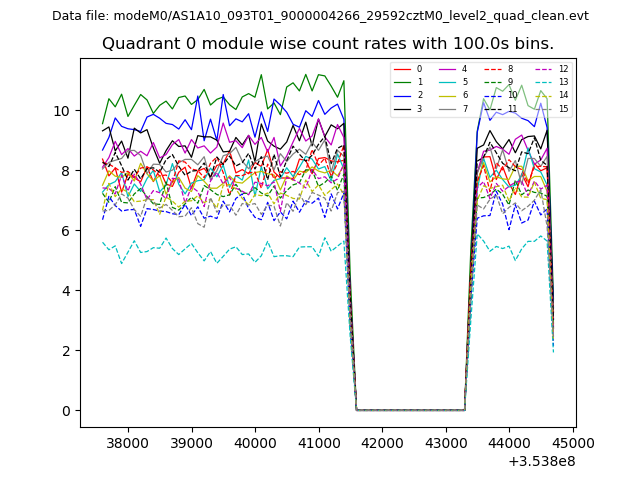 |
 |
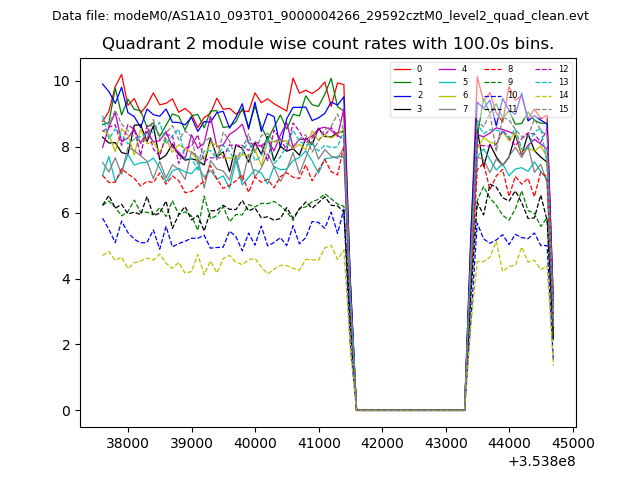
| Module-wise count rates for Quadrant B Data is divided into 100 sec bins |
 |
 |
| Module-wise count rates for Quadrant C Data is divided into 100 sec bins |
 |
 |
| Module-wise count rates for Quadrant D Data is divided into 100 sec bins |
 |
 |
| Parameter | Plot |
|---|---|
| CZT HV Monitor | 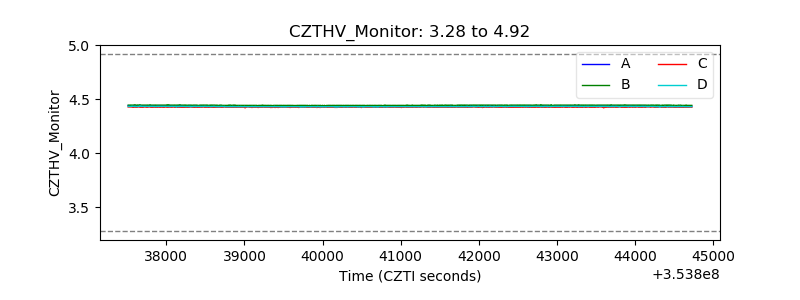 |
| D_VDD | 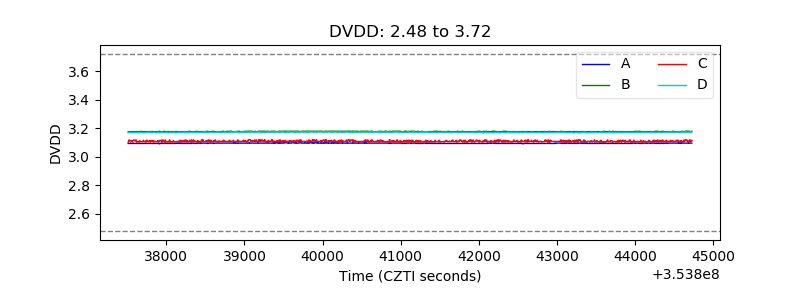 |
| Temperature 1 | 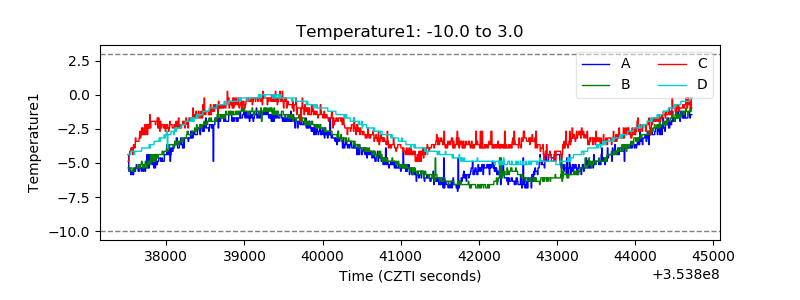 |
| Veto HV Monitor | 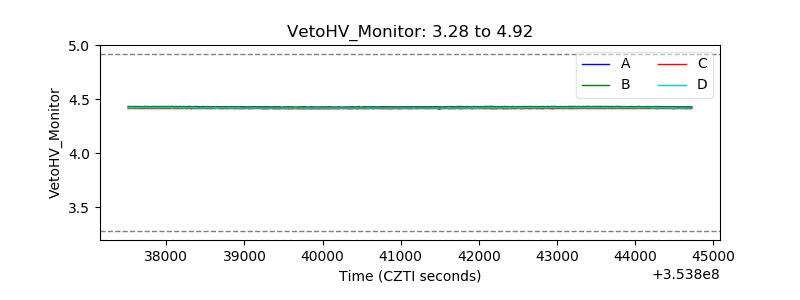 |
| Veto LLD | 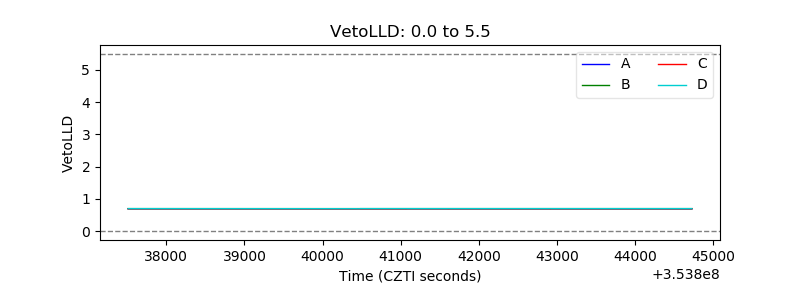 |
| Alpha Counter | 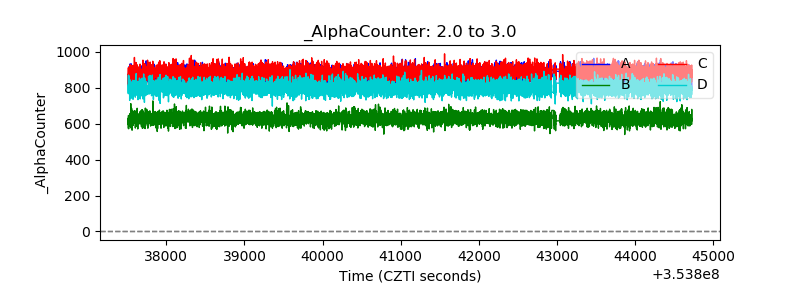 |
| _CPM_Rate | 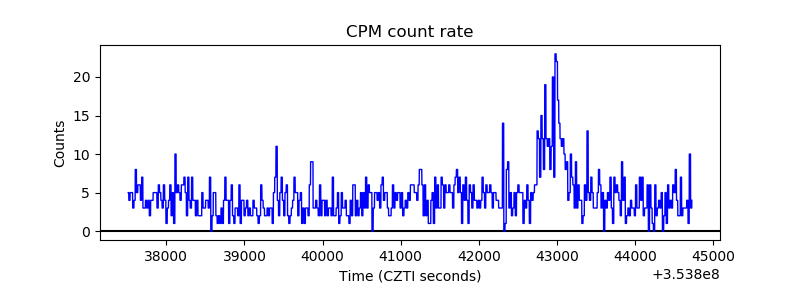 |
| CZT Counter | 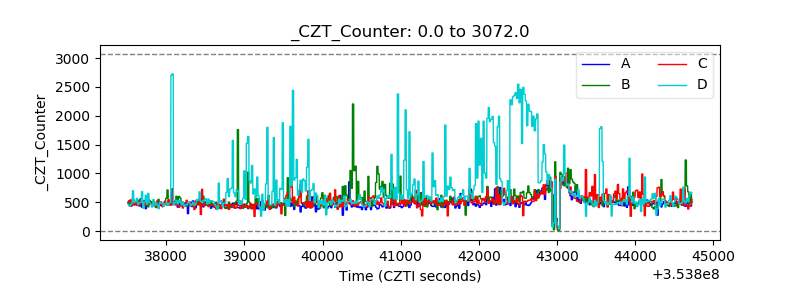 |
| +2.5 Volts monitor | 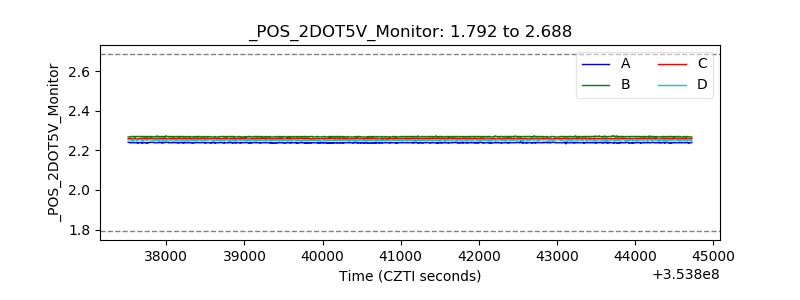 |
| +5 Volts monitor |  |
| _ROLL_ROT | 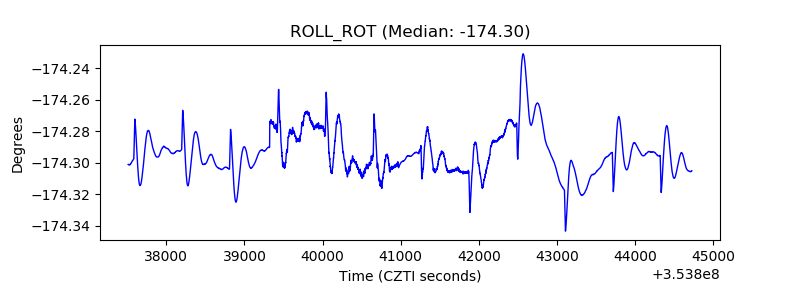 |
| _Roll_DEC | 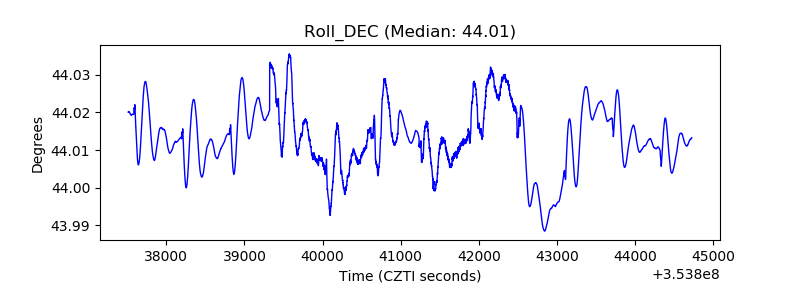 |
| _Roll_RA | 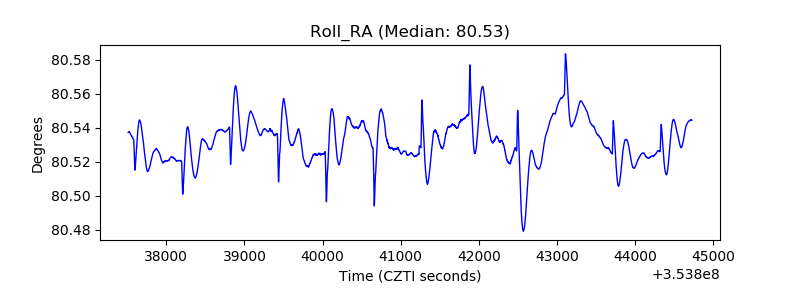 |
| Veto Counter | 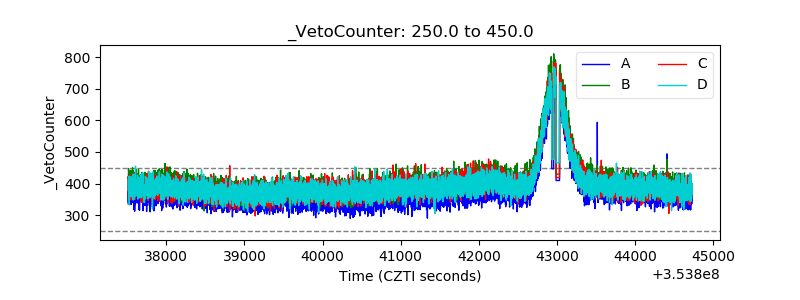 |