| Param | Original file | Final file |
|---|---|---|
| Filename | modeM0/AS1T03_286T01_9000004268cztM0_level2.fits | modeM0/AS1T03_286T01_9000004268cztM0_level2_quad_clean.evt |
| Size (bytes) | 2,581,557,120 | 2,532,363,840 |
| Size | 2.4 GB | 2.4 GB |
| Events in quadrant A | 15,834,906 | 15,317,224 |
| Events in quadrant B | 15,366,682 | 15,463,071 |
| Events in quadrant C | 15,594,252 | 14,725,353 |
| Events in quadrant D | 13,190,270 | 13,001,353 |
| Mode M9 | |||
|---|---|---|---|
| Quadrant | BADHDUFLAG | Total packets | Discarded packets |
| A | 0 | 419 | 0 |
| B | 0 | 419 | 0 |
| C | 0 | 419 | 0 |
| D | 0 | 419 | 0 |
| Mode SS | |||
|---|---|---|---|
| Quadrant | BADHDUFLAG | Total packets | Discarded packets |
| A | 0 | 5410 | 0 |
| B | 0 | 5410 | 0 |
| C | 0 | 5410 | 0 |
| D | 0 | 5410 | 0 |
| Mode M0 | |||
|---|---|---|---|
| Quadrant | BADHDUFLAG | Total packets | Discarded packets |
| A | 0 | 549257 | 0 |
| B | 0 | 555652 | 0 |
| C | 0 | 565966 | 0 |
| D | 0 | 778694 | 0 |
| Quadrant | Total seconds | Saturated seconds | Saturation percentage |
|---|---|---|---|
| A | 265572 | 2908 | 1.094995% |
| B | 265572 | 3944 | 1.485096% |
| C | 265572 | 7957 | 2.996174% |
| D | 265572 | 17427 | 6.562062% |
Noise dominated data is calculated using 1-second bins in cleaned event files. If a bin has >2000 counts, and if more than 50% of those come from <1% of pixels, then it is considered to be noise-dominated and hence unusable.
| Quadrant | # 1 sec bins | Bins with >0 counts | Bins with >2000 counts | High rate bins dominated by noise | Noise dominated (total time) | Noise dominated (detector-on time) | Marked lightcurve |
|---|---|---|---|---|---|---|---|
| A | 307508 | 265549 | 0 | 0 | 0.00% | 0.00% |  |
| B | 307508 | 265534 | 0 | 0 | 0.00% | 0.00% |  |
| C | 307508 | 265499 | 0 | 0 | 0.00% | 0.00% |  |
| D | 307508 | 265293 | 0 | 0 | 0.00% | 0.00% |  |
Top three noisy pixels from each quadrant. If the there are fewer than three noisy pixels in the level2.evt file, extra rows are filled as -1
| Pixel properties | Quadrant properties | ||||||
|---|---|---|---|---|---|---|---|
| Quadrant | DetID | PixID | Counts | Sigma | Mean | Median | Sigma |
| A | 0 | 29 | 13461 | 9.63 | 4121 | 3884 | 994.5 |
| A | 7 | 110 | 12467 | 8.63 | 4121 | 3884 | 994.5 |
| A | 9 | 19 | 11830 | 7.99 | 4121 | 3884 | 994.5 |
| B | 2 | 9 | 12269 | 10.69 | 4065 | 3885 | 784.5 |
| B | 2 | 8 | 10231 | 8.09 | 4065 | 3885 | 784.5 |
| B | 5 | 128 | 10175 | 8.02 | 4065 | 3885 | 784.5 |
| C | 1 | 81 | 12404 | 8.24 | 4117 | 3872 | 1035.7 |
| C | 1 | 80 | 12380 | 8.21 | 4117 | 3872 | 1035.7 |
| C | 12 | 241 | 11113 | 6.99 | 4117 | 3872 | 1035.7 |
| D | 15 | 46 | 10134 | 6.7 | 3767 | 3436 | 1000.1 |
| D | 10 | 189 | 9423 | 5.99 | 3767 | 3436 | 1000.1 |
| D | 6 | 231 | 9221 | 5.78 | 3767 | 3436 | 1000.1 |
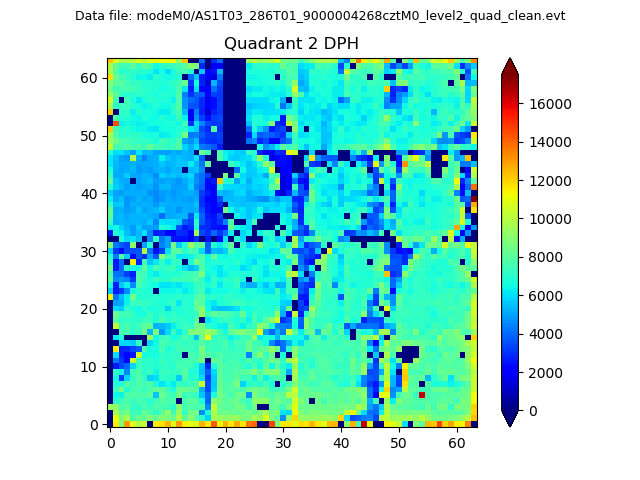
Histogram calculated using DETX and DETY for each event in the final _common_clean file
| Quadrant A |  |
 |
Quadrant B |
|---|---|---|---|
| Quadrant D | 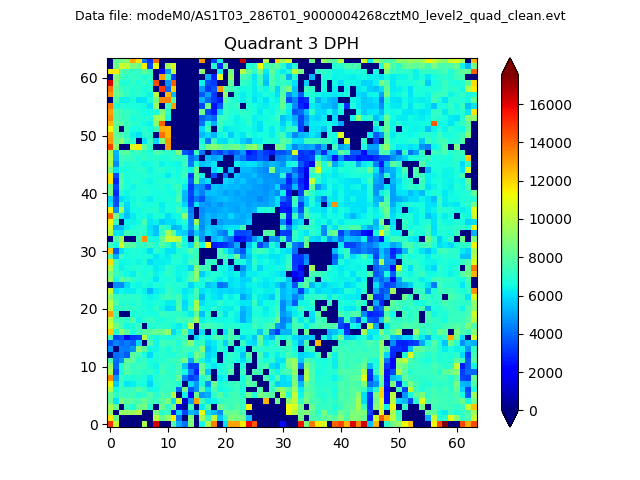 |
 |
Quadrant C |
| Plot type | Count rate plots | Images |
|---|---|---|
| Comparison with Poisson distribution Blue bars denote a histogram of data divided into 1 sec bins. Red curve is a Poisson curve with rate = median count rate of data. |
 |
 |
| Quadrant-wise count rates Data is divided into 100 sec bins |
 |
|
| Module-wise count rates for Quadrant A Data is divided into 100 sec bins |
 |
 |
| Module-wise count rates for Quadrant B Data is divided into 100 sec bins |
 |
 |
| Module-wise count rates for Quadrant C Data is divided into 100 sec bins |
 |
 |
| Module-wise count rates for Quadrant D Data is divided into 100 sec bins |
 |
 |
| Parameter | Plot |
|---|---|
| CZT HV Monitor |  |
| D_VDD |  |
| Temperature 1 |  |
| Veto HV Monitor |  |
| Veto LLD |  |
| Alpha Counter |  |
| _CPM_Rate |  |
| CZT Counter |  |
| +2.5 Volts monitor |  |
| +5 Volts monitor |  |
| _ROLL_ROT |  |
| _Roll_DEC |  |
| _Roll_RA |  |
| Veto Counter |  |