| Param | Original file | Final file |
|---|---|---|
| Filename | modeM0/AS1T03_286T01_9000004268_29598cztM0_level2.evt | modeM0/AS1T03_286T01_9000004268_29598cztM0_level2_quad_clean.evt |
| Size (bytes) | 472,032,000 | 111,309,120 |
| Size | 450.2 MB | 106.2 MB |
| Events in quadrant A | 2,949,578 | 747,305 |
| Events in quadrant B | 3,048,787 | 766,354 |
| Events in quadrant C | 3,145,475 | 726,706 |
| Events in quadrant D | 4,727,013 | 694,492 |
| Mode M9 | |||
|---|---|---|---|
| Quadrant | BADHDUFLAG | Total packets | Discarded packets |
| A | 0 | 10 | 0 |
| B | 0 | 10 | 0 |
| C | 0 | 10 | 0 |
| D | 0 | 10 | 0 |
| Mode SS | |||
|---|---|---|---|
| Quadrant | BADHDUFLAG | Total packets | Discarded packets |
| A | 0 | 128 | 0 |
| B | 0 | 128 | 0 |
| C | 0 | 128 | 0 |
| D | 0 | 128 | 0 |
| Mode M0 | |||
|---|---|---|---|
| Quadrant | BADHDUFLAG | Total packets | Discarded packets |
| A | 0 | 12998 | 1 |
| B | 0 | 13284 | 1 |
| C | 0 | 13480 | 1 |
| D | 0 | 18419 | 1 |
| Quadrant | Total seconds | Saturated seconds | Saturation percentage |
|---|---|---|---|
| A | 6246 | 38 | 0.608389% |
| B | 6247 | 50 | 0.800384% |
| C | 6247 | 243 | 3.889867% |
| D | 6247 | 356 | 5.698735% |
Noise dominated data is calculated using 1-second bins in cleaned event files. If a bin has >2000 counts, and if more than 50% of those come from <1% of pixels, then it is considered to be noise-dominated and hence unusable.
| Quadrant | # 1 sec bins | Bins with >0 counts | Bins with >2000 counts | High rate bins dominated by noise | Noise dominated (total time) | Noise dominated (detector-on time) | Marked lightcurve |
|---|---|---|---|---|---|---|---|
| A | 7316 | 6246 | 0 | 0 | 0.00% | 0.00% | 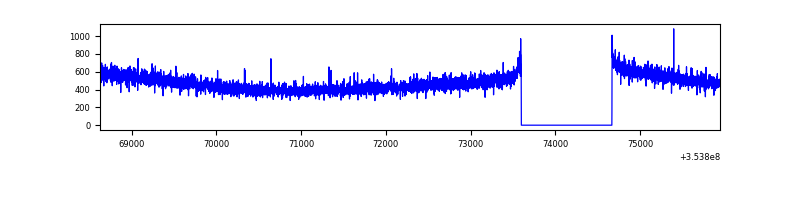 |
| B | 7317 | 6247 | 4 | 4 | 0.05% | 0.06% | 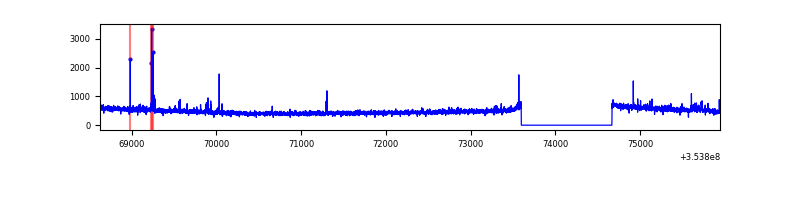 |
| C | 7317 | 6247 | 0 | 0 | 0.00% | 0.00% | 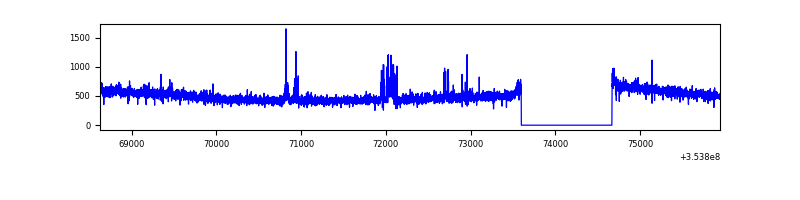 |
| D | 7317 | 6247 | 271 | 271 | 3.70% | 4.34% | 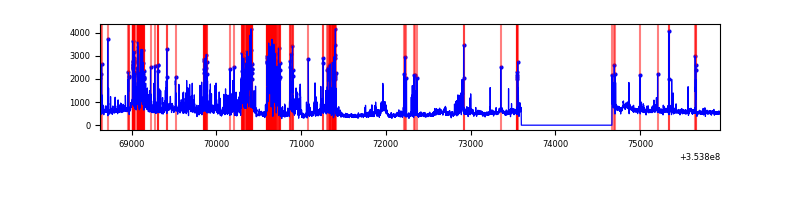 |
Top three noisy pixels from each quadrant. If the there are fewer than three noisy pixels in the level2.evt file, extra rows are filled as -1
| Pixel properties | Quadrant properties | ||||||
|---|---|---|---|---|---|---|---|
| Quadrant | DetID | PixID | Counts | Sigma | Mean | Median | Sigma |
| A | 13 | 254 | 11898 | 73.35 | 762 | 747 | 152.0 |
| A | 3 | 137 | 7317 | 43.22 | 762 | 747 | 152.0 |
| A | 0 | 226 | 6426 | 37.36 | 762 | 747 | 152.0 |
| B | 0 | 190 | 52412 | 358.27 | 762 | 742 | 144.2 |
| B | 12 | 111 | 17667 | 117.35 | 762 | 742 | 144.2 |
| B | 11 | 111 | 15904 | 105.13 | 762 | 742 | 144.2 |
| C | 14 | 238 | 159498 | 927.81 | 734 | 737 | 171.1 |
| C | 14 | 254 | 60021 | 346.46 | 734 | 737 | 171.1 |
| C | 3 | 233 | 27159 | 154.41 | 734 | 737 | 171.1 |
| D | 7 | 80 | 742007 | 4228.07 | 733 | 714 | 175.3 |
| D | 7 | 238 | 549744 | 3131.47 | 733 | 714 | 175.3 |
| D | 8 | 195 | 399153 | 2272.56 | 733 | 714 | 175.3 |
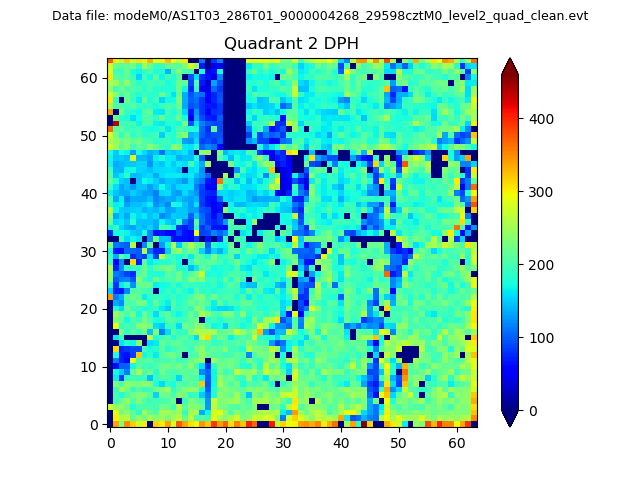
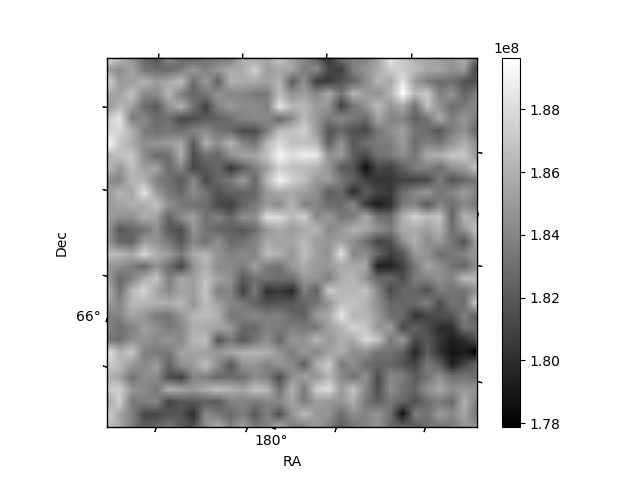
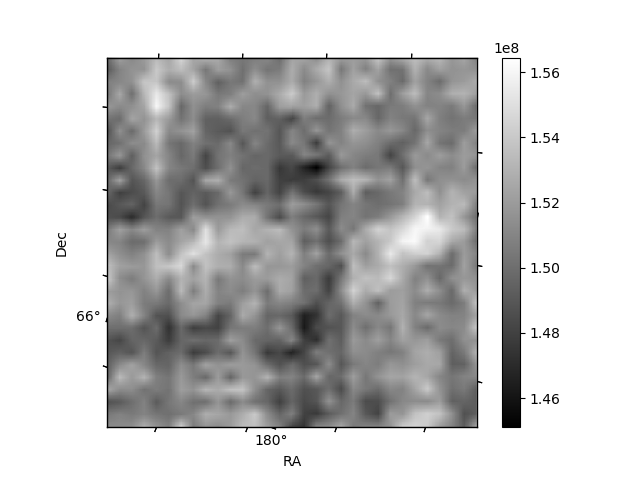
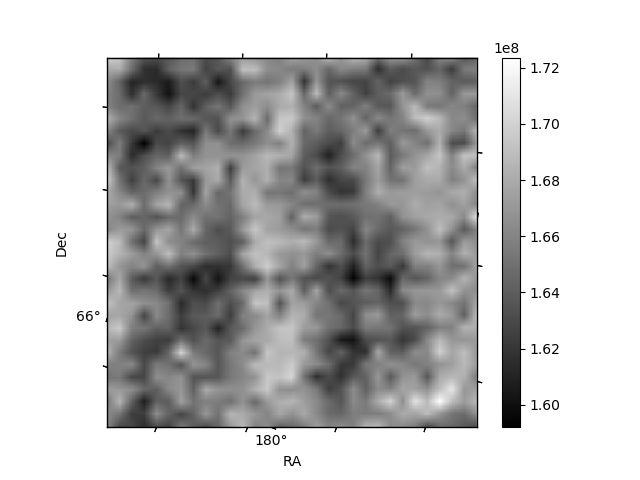
Histogram calculated using DETX and DETY for each event in the final _common_clean file
| Quadrant A | 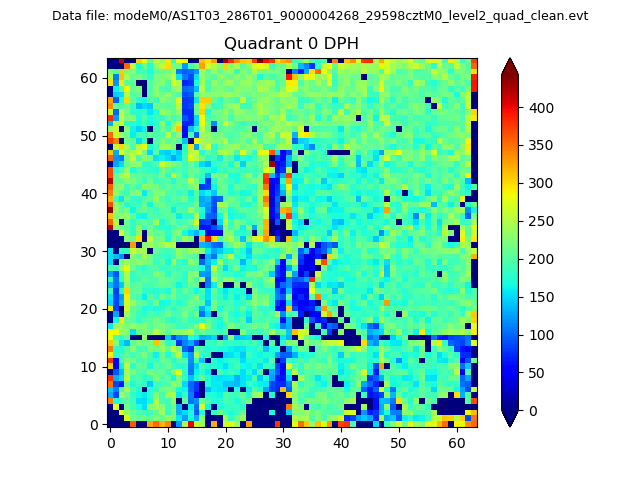 |
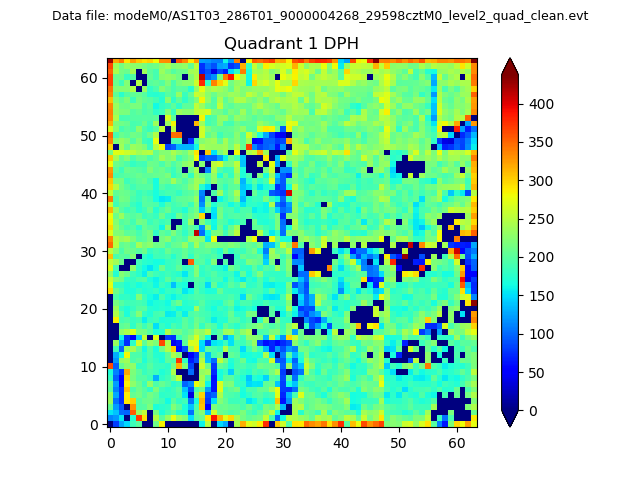 |
Quadrant B |
|---|---|---|---|
| Quadrant D | 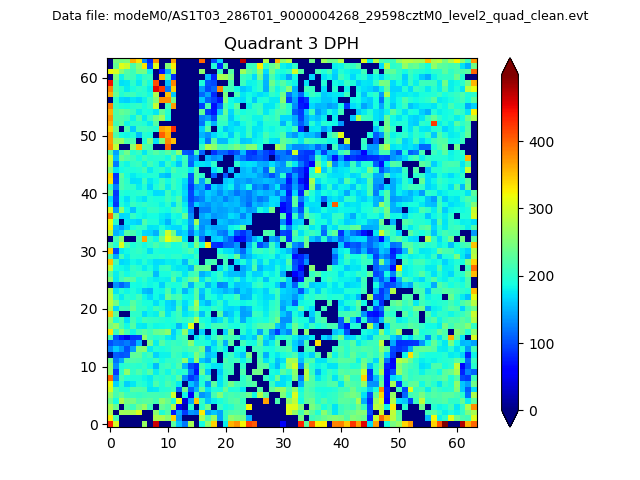 |
 |
Quadrant C |
| Plot type | Count rate plots | Images |
|---|---|---|
| Comparison with Poisson distribution Blue bars denote a histogram of data divided into 1 sec bins. Red curve is a Poisson curve with rate = median count rate of data. |
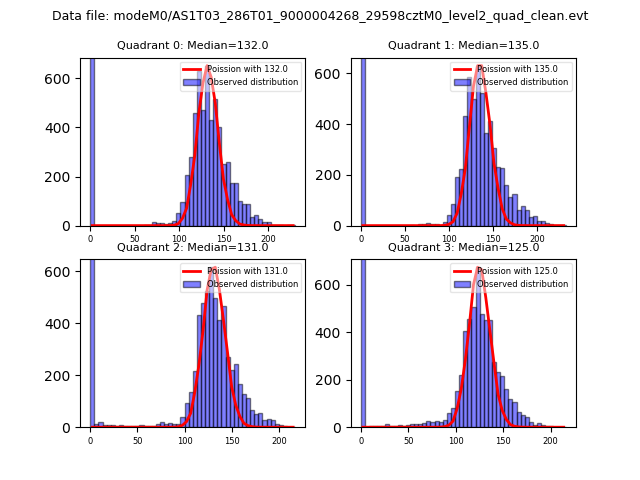 |
 |
| Quadrant-wise count rates Data is divided into 100 sec bins |
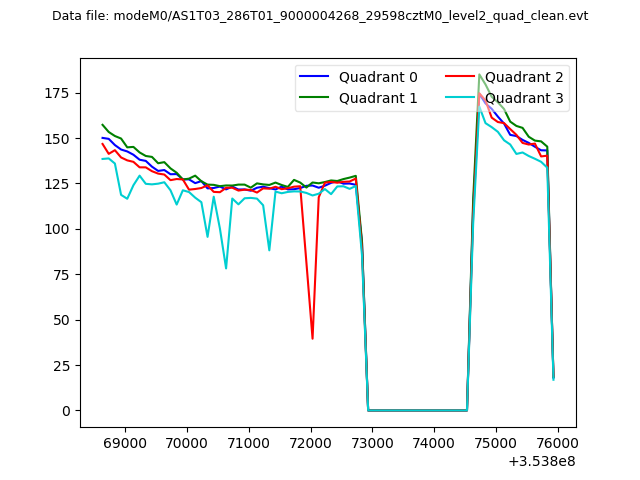 |
|
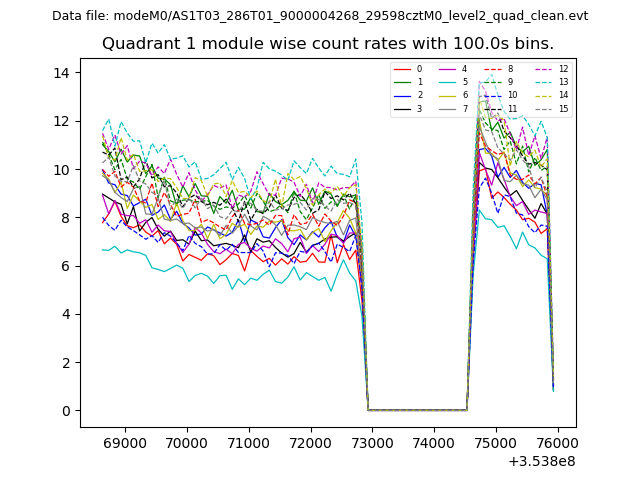
| Module-wise count rates for Quadrant A Data is divided into 100 sec bins |
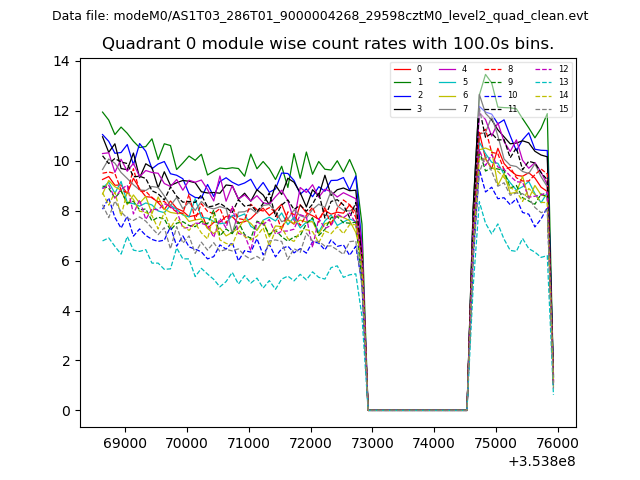 |
 |
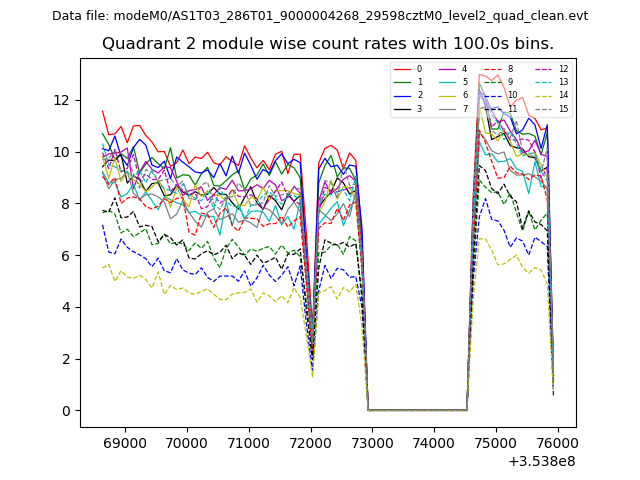
| Module-wise count rates for Quadrant B Data is divided into 100 sec bins |
 |
 |
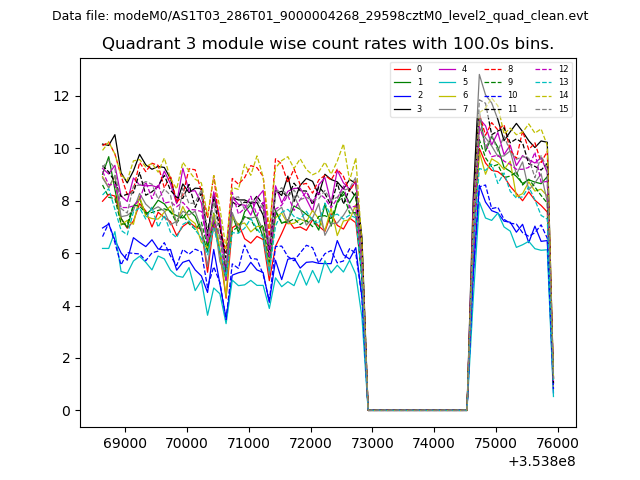
| Module-wise count rates for Quadrant C Data is divided into 100 sec bins |
 |
 |
| Module-wise count rates for Quadrant D Data is divided into 100 sec bins |
 |
 |
| Parameter | Plot |
|---|---|
| CZT HV Monitor | 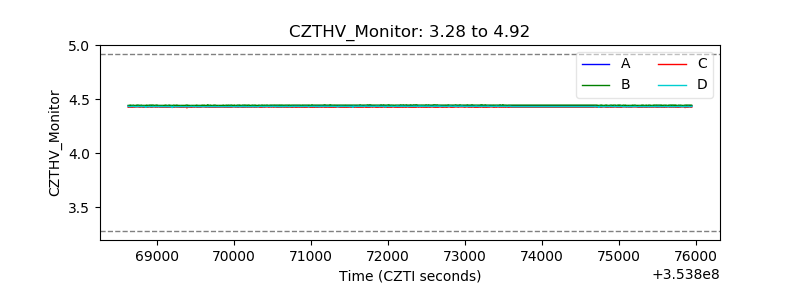 |
| D_VDD | 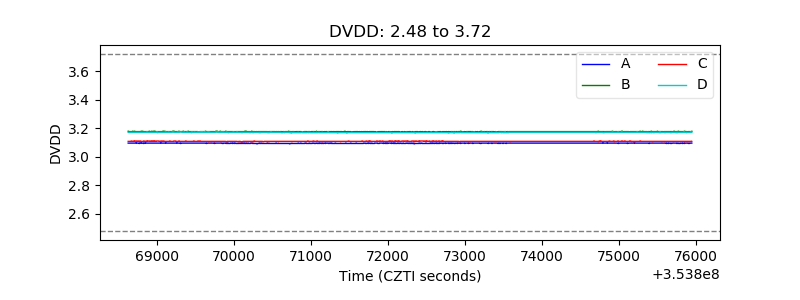 |
| Temperature 1 |  |
| Veto HV Monitor | 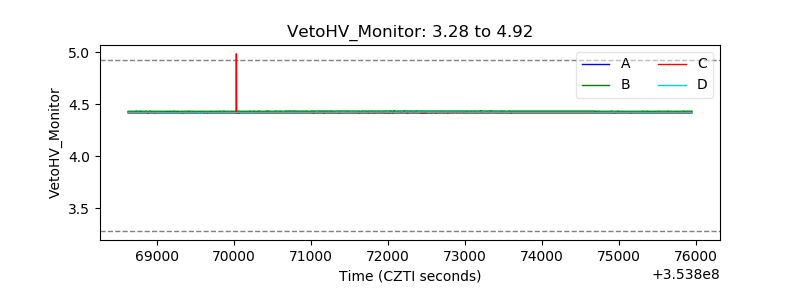 |
| Veto LLD | 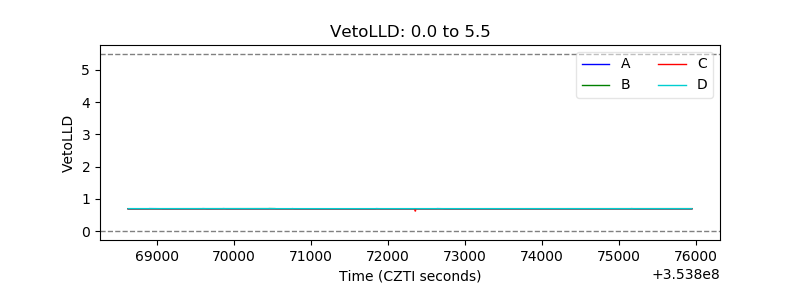 |
| Alpha Counter |  |
| _CPM_Rate | 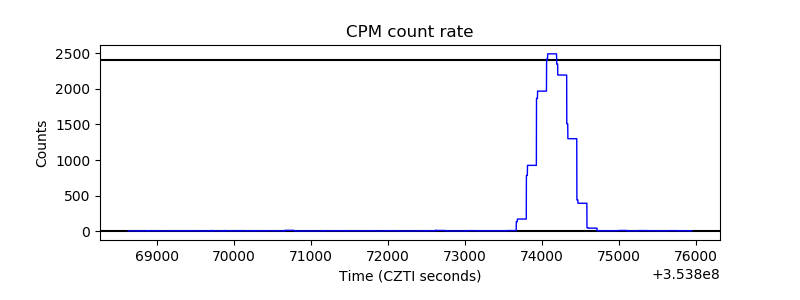 |
| CZT Counter |  |
| +2.5 Volts monitor |  |
| +5 Volts monitor |  |
| _ROLL_ROT | 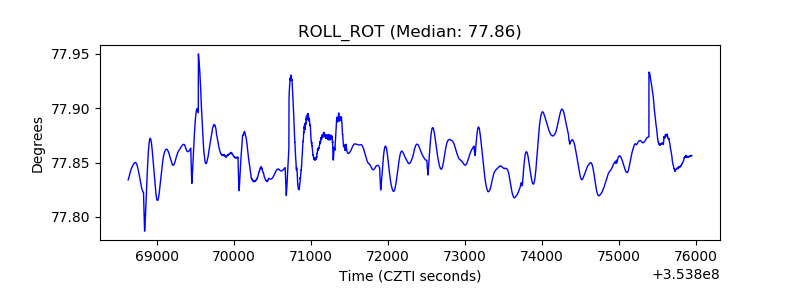 |
| _Roll_DEC | 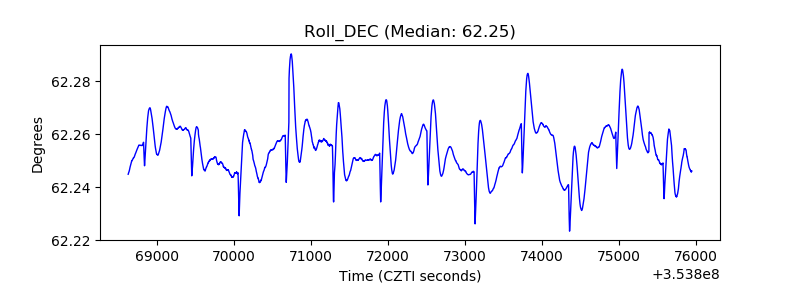 |
| _Roll_RA |  |
| Veto Counter | 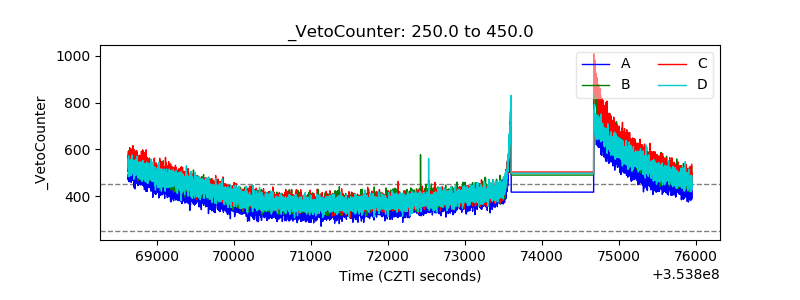 |