| Param | Original file | Final file |
|---|---|---|
| Filename | modeM0/AS1T03_286T01_9000004268_29600cztM0_level2.evt | modeM0/AS1T03_286T01_9000004268_29600cztM0_level2_quad_clean.evt |
| Size (bytes) | 481,610,880 | 110,833,920 |
| Size | 459.3 MB | 105.7 MB |
| Events in quadrant A | 3,035,213 | 727,806 |
| Events in quadrant B | 3,139,099 | 767,628 |
| Events in quadrant C | 3,200,672 | 739,437 |
| Events in quadrant D | 4,794,591 | 693,912 |
| Mode M9 | |||
|---|---|---|---|
| Quadrant | BADHDUFLAG | Total packets | Discarded packets |
| A | 0 | 15 | 0 |
| B | 0 | 16 | 0 |
| C | 0 | 16 | 0 |
| D | 0 | 16 | 0 |
| Mode SS | |||
|---|---|---|---|
| Quadrant | BADHDUFLAG | Total packets | Discarded packets |
| A | 0 | 124 | 0 |
| B | 0 | 124 | 0 |
| C | 0 | 124 | 0 |
| D | 0 | 124 | 0 |
| Mode M0 | |||
|---|---|---|---|
| Quadrant | BADHDUFLAG | Total packets | Discarded packets |
| A | 0 | 13064 | 2 |
| B | 0 | 13353 | 2 |
| C | 0 | 13535 | 2 |
| D | 0 | 18597 | 3 |
| Quadrant | Total seconds | Saturated seconds | Saturation percentage |
|---|---|---|---|
| A | 6134 | 19 | 0.309749% |
| B | 6134 | 43 | 0.701011% |
| C | 6134 | 98 | 1.597652% |
| D | 6133 | 285 | 4.646992% |
Noise dominated data is calculated using 1-second bins in cleaned event files. If a bin has >2000 counts, and if more than 50% of those come from <1% of pixels, then it is considered to be noise-dominated and hence unusable.
| Quadrant | # 1 sec bins | Bins with >0 counts | Bins with >2000 counts | High rate bins dominated by noise | Noise dominated (total time) | Noise dominated (detector-on time) | Marked lightcurve |
|---|---|---|---|---|---|---|---|
| A | 7419 | 6135 | 0 | 0 | 0.00% | 0.00% | 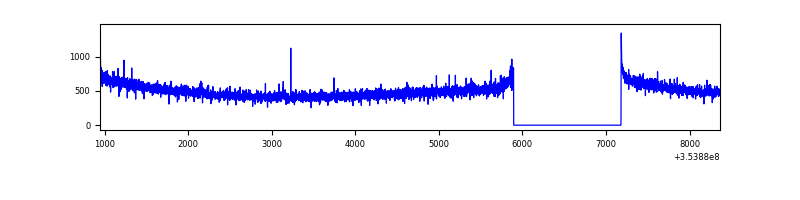 |
| B | 7419 | 6134 | 1 | 1 | 0.01% | 0.02% | 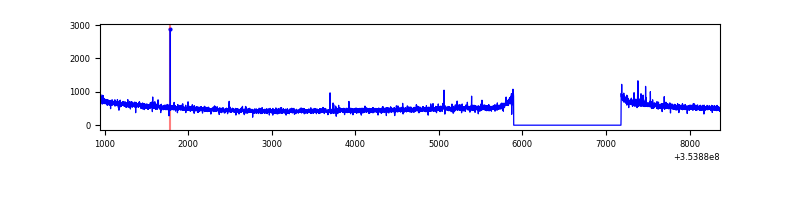 |
| C | 7419 | 6135 | 0 | 0 | 0.00% | 0.00% |  |
| D | 7418 | 6134 | 199 | 199 | 2.68% | 3.24% | 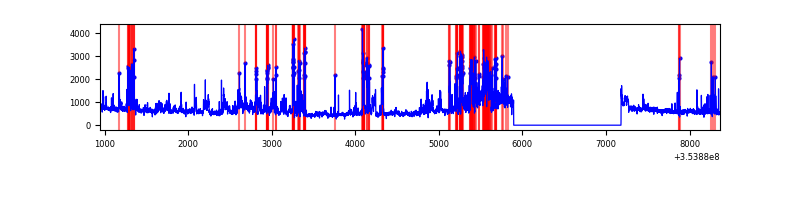 |
Top three noisy pixels from each quadrant. If the there are fewer than three noisy pixels in the level2.evt file, extra rows are filled as -1
| Pixel properties | Quadrant properties | ||||||
|---|---|---|---|---|---|---|---|
| Quadrant | DetID | PixID | Counts | Sigma | Mean | Median | Sigma |
| A | 13 | 254 | 11537 | 69.88 | 783 | 768 | 154.1 |
| A | 3 | 137 | 7061 | 40.83 | 783 | 768 | 154.1 |
| A | 0 | 226 | 6496 | 37.17 | 783 | 768 | 154.1 |
| B | 0 | 190 | 17925 | 116.54 | 794 | 776 | 147.2 |
| B | 12 | 111 | 17470 | 113.44 | 794 | 776 | 147.2 |
| B | 11 | 111 | 15623 | 100.89 | 794 | 776 | 147.2 |
| C | 14 | 238 | 127852 | 707.2 | 778 | 785 | 179.7 |
| C | 2 | 114 | 14364 | 75.57 | 778 | 785 | 179.7 |
| C | 3 | 233 | 12015 | 62.5 | 778 | 785 | 179.7 |
| D | 7 | 238 | 785411 | 4386.19 | 758 | 739 | 178.9 |
| D | 12 | 227 | 558444 | 3117.48 | 758 | 739 | 178.9 |
| D | 8 | 195 | 349061 | 1947.06 | 758 | 739 | 178.9 |
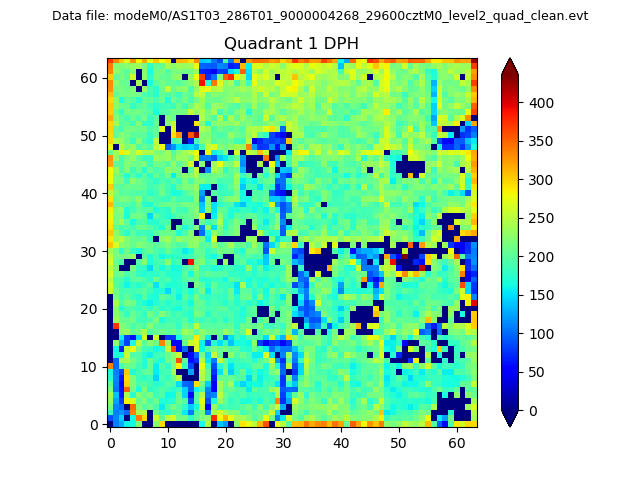
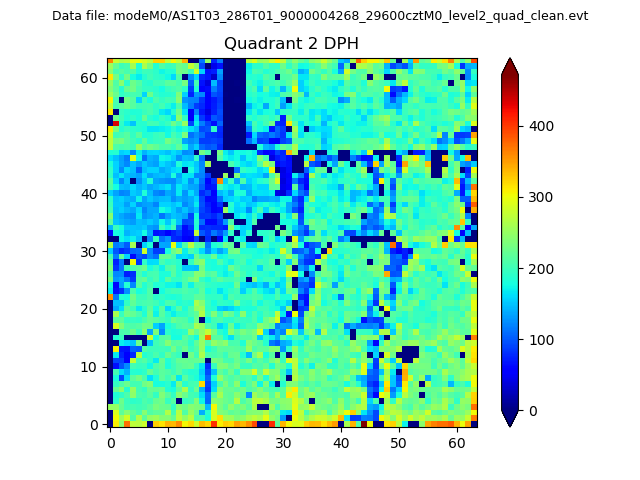
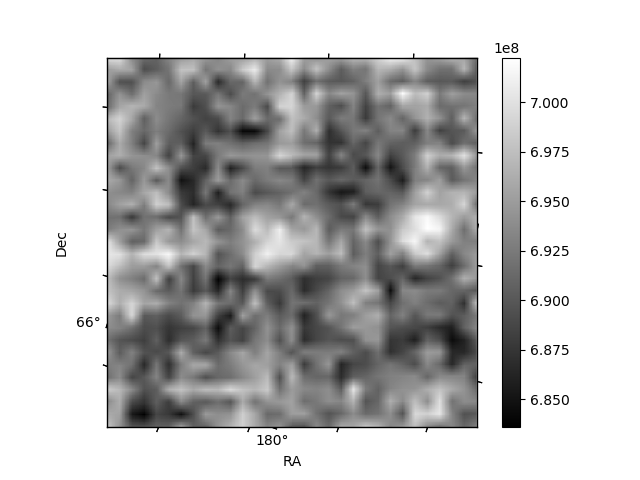
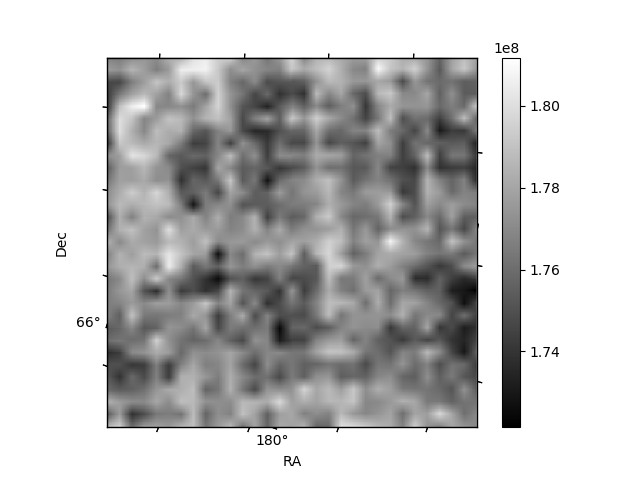
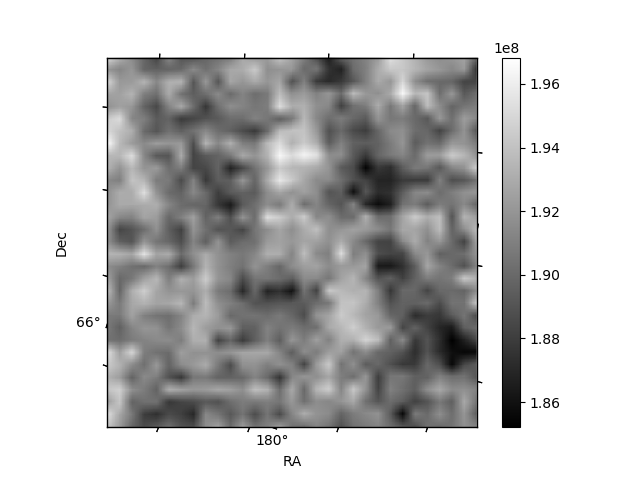
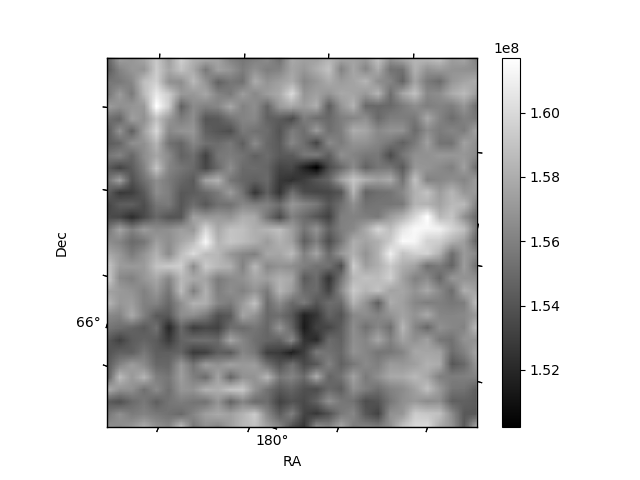
Histogram calculated using DETX and DETY for each event in the final _common_clean file
| Quadrant A | 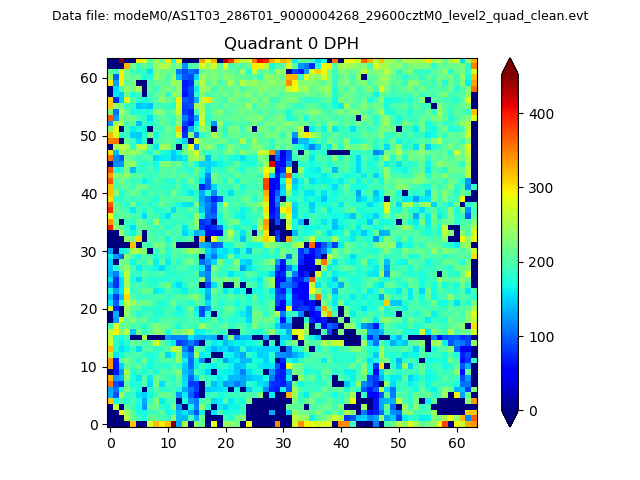 |
 |
Quadrant B |
|---|---|---|---|
| Quadrant D | 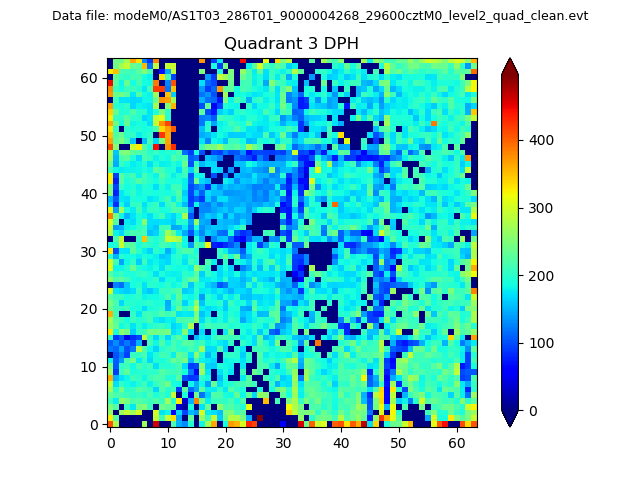 |
 |
Quadrant C |
| Plot type | Count rate plots | Images |
|---|---|---|
| Comparison with Poisson distribution Blue bars denote a histogram of data divided into 1 sec bins. Red curve is a Poisson curve with rate = median count rate of data. |
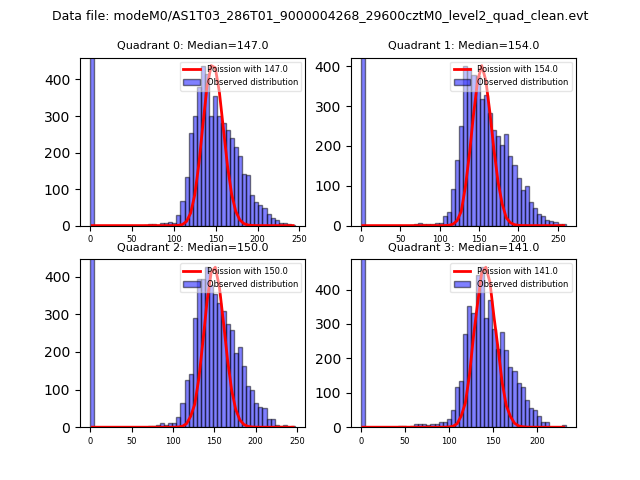 |
 |
| Quadrant-wise count rates Data is divided into 100 sec bins |
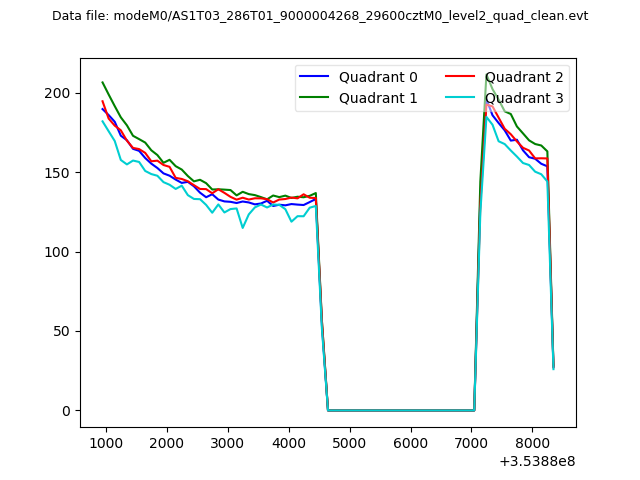 |
|
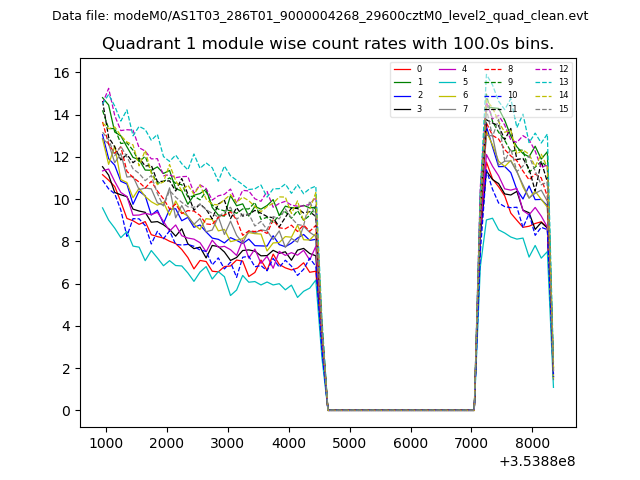
| Module-wise count rates for Quadrant A Data is divided into 100 sec bins |
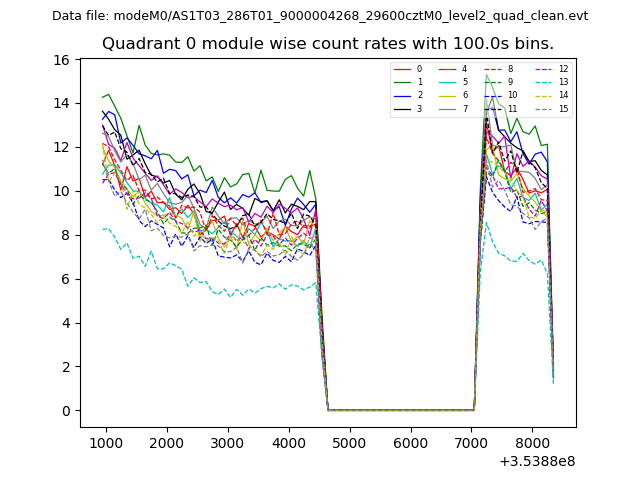 |
 |
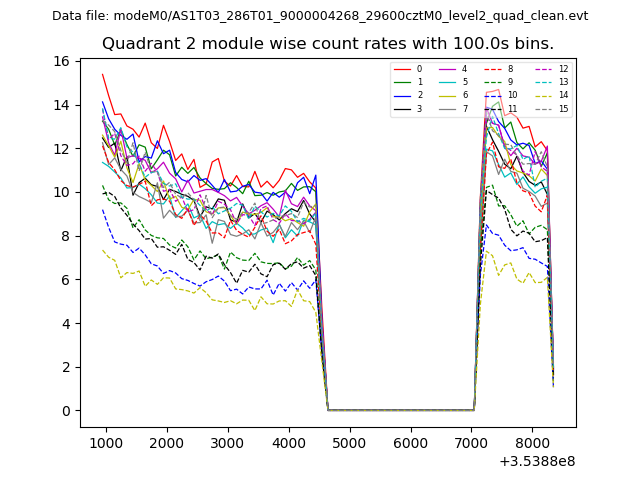
| Module-wise count rates for Quadrant B Data is divided into 100 sec bins |
 |
 |
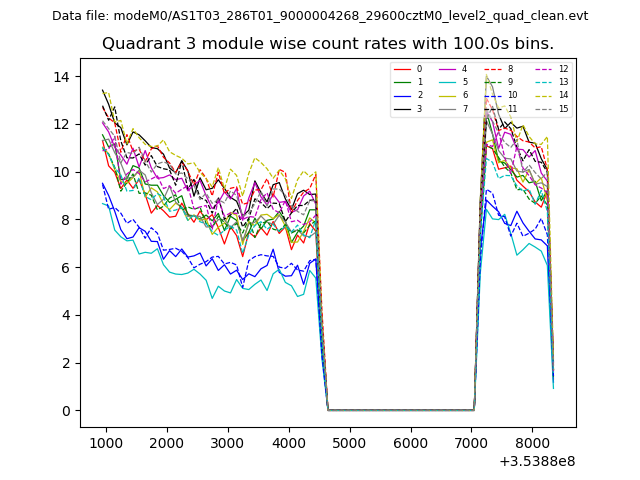
| Module-wise count rates for Quadrant C Data is divided into 100 sec bins |
 |
 |
| Module-wise count rates for Quadrant D Data is divided into 100 sec bins |
 |
 |
| Parameter | Plot |
|---|---|
| CZT HV Monitor | 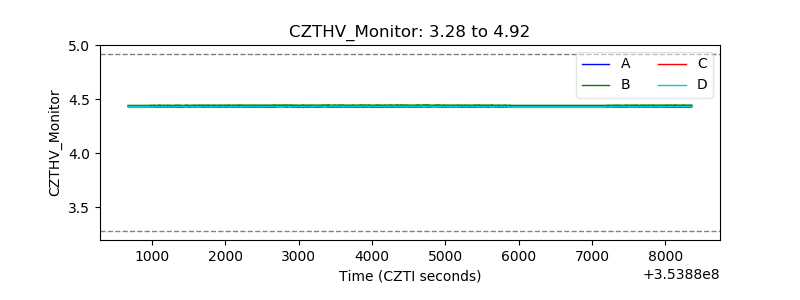 |
| D_VDD | 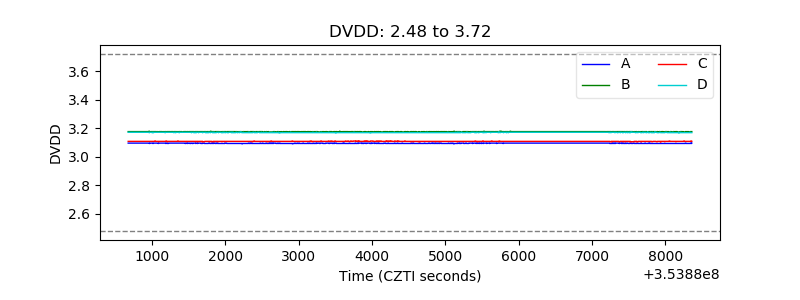 |
| Temperature 1 | 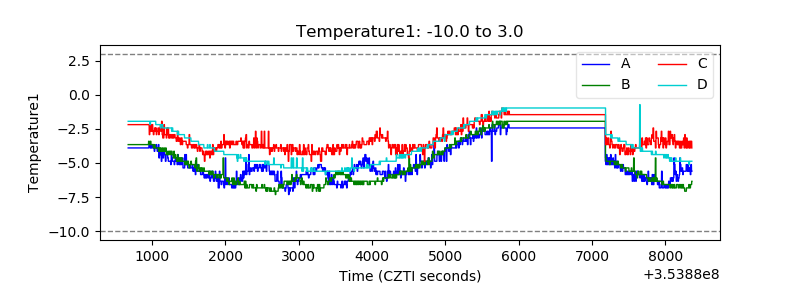 |
| Veto HV Monitor | 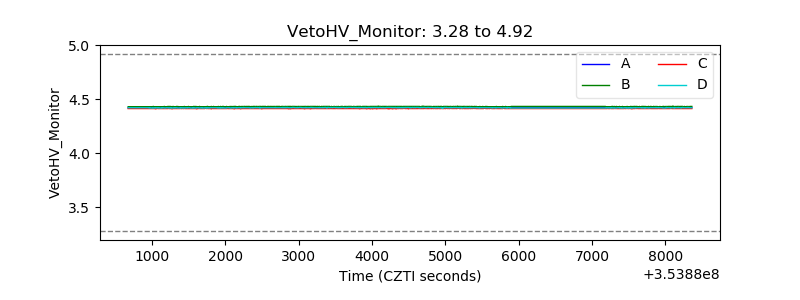 |
| Veto LLD | 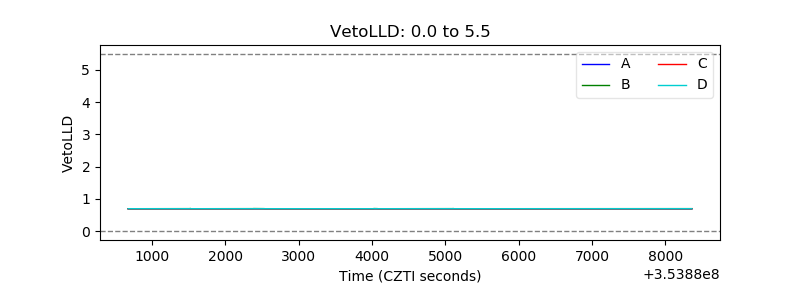 |
| Alpha Counter | 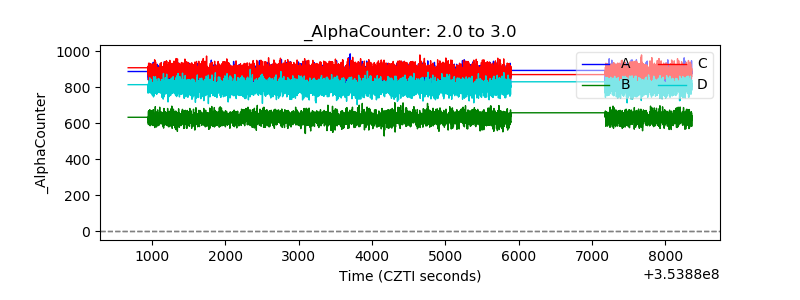 |
| _CPM_Rate | 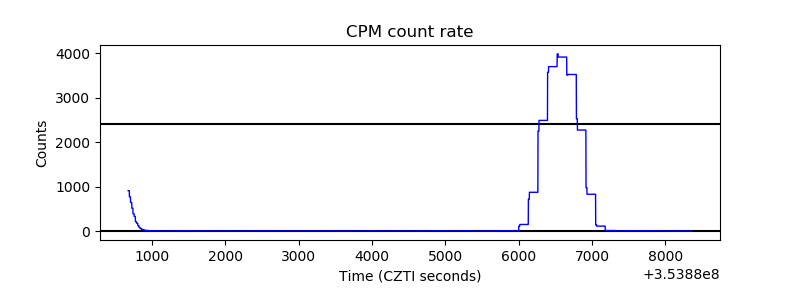 |
| CZT Counter | 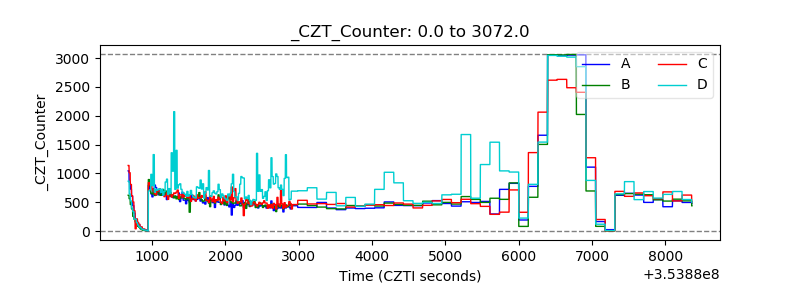 |
| +2.5 Volts monitor |  |
| +5 Volts monitor |  |
| _ROLL_ROT | 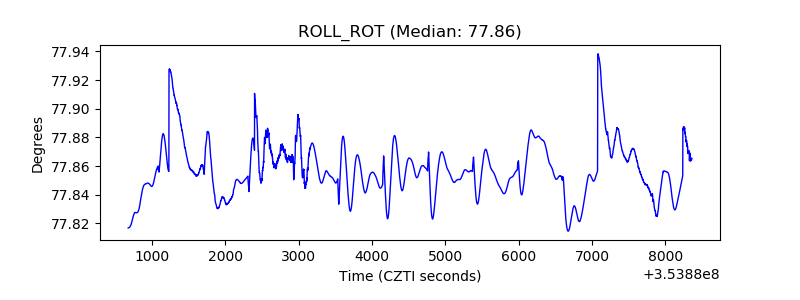 |
| _Roll_DEC | 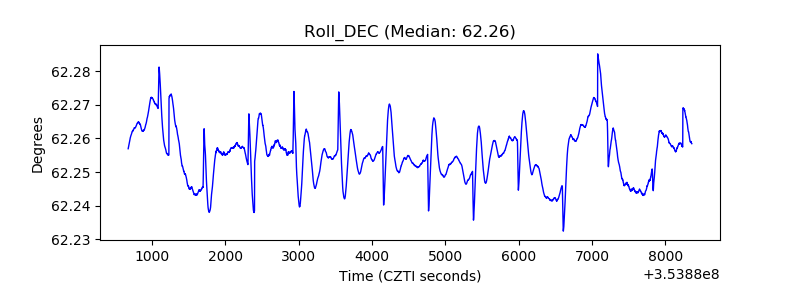 |
| _Roll_RA | 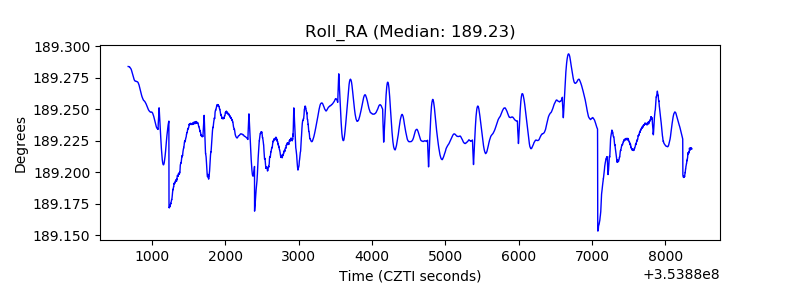 |
| Veto Counter | 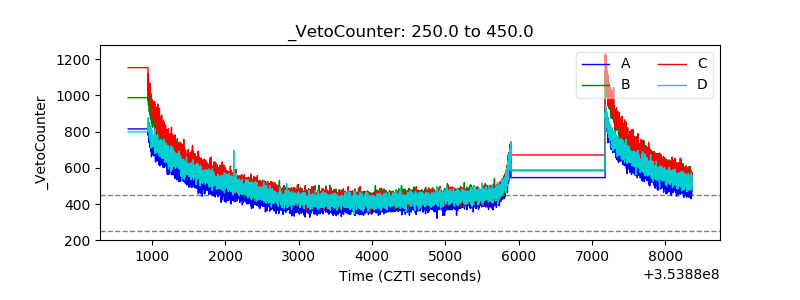 |