| Param | Original file | Final file |
|---|---|---|
| Filename | modeM0/AS1T03_286T01_9000004268_29601cztM0_level2.evt | modeM0/AS1T03_286T01_9000004268_29601cztM0_level2_quad_clean.evt |
| Size (bytes) | 516,493,440 | 106,188,480 |
| Size | 492.6 MB | 101.3 MB |
| Events in quadrant A | 3,062,201 | 702,370 |
| Events in quadrant B | 3,166,461 | 743,184 |
| Events in quadrant C | 3,201,417 | 709,686 |
| Events in quadrant D | 5,799,958 | 636,575 |
| Mode M9 | |||
|---|---|---|---|
| Quadrant | BADHDUFLAG | Total packets | Discarded packets |
| A | 0 | 18 | 0 |
| B | 0 | 19 | 0 |
| C | 0 | 19 | 0 |
| D | 0 | 19 | 0 |
| Mode SS | |||
|---|---|---|---|
| Quadrant | BADHDUFLAG | Total packets | Discarded packets |
| A | 0 | 124 | 0 |
| B | 0 | 124 | 0 |
| C | 0 | 124 | 0 |
| D | 0 | 124 | 0 |
| Mode M0 | |||
|---|---|---|---|
| Quadrant | BADHDUFLAG | Total packets | Discarded packets |
| A | 0 | 12980 | 3 |
| B | 0 | 13224 | 2 |
| C | 0 | 13350 | 2 |
| D | 0 | 21341 | 2 |
| Quadrant | Total seconds | Saturated seconds | Saturation percentage |
|---|---|---|---|
| A | 6072 | 31 | 0.510540% |
| B | 6072 | 49 | 0.806983% |
| C | 6072 | 126 | 2.075099% |
| D | 6072 | 782 | 12.878788% |
Noise dominated data is calculated using 1-second bins in cleaned event files. If a bin has >2000 counts, and if more than 50% of those come from <1% of pixels, then it is considered to be noise-dominated and hence unusable.
| Quadrant | # 1 sec bins | Bins with >0 counts | Bins with >2000 counts | High rate bins dominated by noise | Noise dominated (total time) | Noise dominated (detector-on time) | Marked lightcurve |
|---|---|---|---|---|---|---|---|
| A | 7417 | 6073 | 0 | 0 | 0.00% | 0.00% | 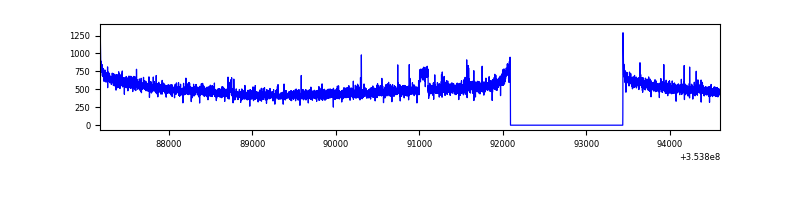 |
| B | 7417 | 6073 | 5 | 5 | 0.07% | 0.08% | 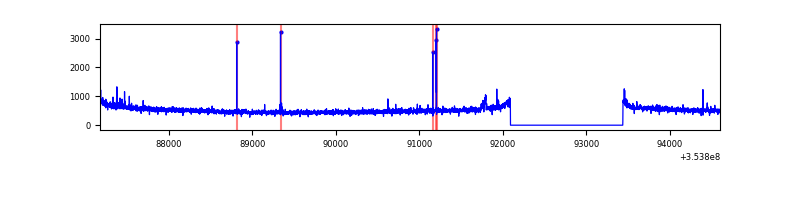 |
| C | 7417 | 6073 | 0 | 0 | 0.00% | 0.00% | 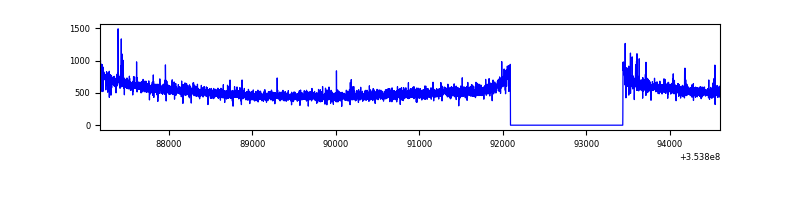 |
| D | 7417 | 6073 | 670 | 670 | 9.03% | 11.03% | 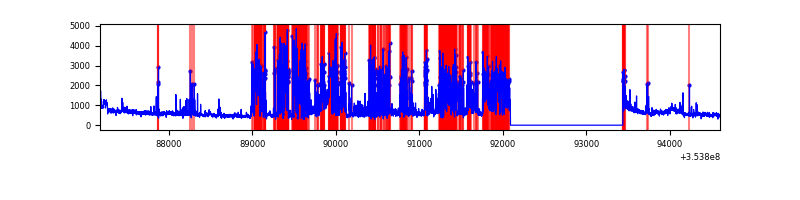 |
Top three noisy pixels from each quadrant. If the there are fewer than three noisy pixels in the level2.evt file, extra rows are filled as -1
| Pixel properties | Quadrant properties | ||||||
|---|---|---|---|---|---|---|---|
| Quadrant | DetID | PixID | Counts | Sigma | Mean | Median | Sigma |
| A | 15 | 174 | 27640 | 174.85 | 781 | 766 | 153.7 |
| A | 13 | 254 | 10891 | 65.88 | 781 | 766 | 153.7 |
| A | 3 | 137 | 7113 | 41.3 | 781 | 766 | 153.7 |
| B | 0 | 190 | 23638 | 158.2 | 794 | 776 | 144.5 |
| B | 12 | 111 | 17145 | 113.27 | 794 | 776 | 144.5 |
| B | 15 | 33 | 17123 | 113.12 | 794 | 776 | 144.5 |
| C | 14 | 238 | 134713 | 754.41 | 773 | 781 | 177.5 |
| C | 3 | 233 | 17130 | 92.09 | 773 | 781 | 177.5 |
| C | 2 | 114 | 14097 | 75.01 | 773 | 781 | 177.5 |
| D | 7 | 80 | 2094758 | 12284.95 | 720 | 702 | 170.5 |
| D | 8 | 195 | 408810 | 2394.2 | 720 | 702 | 170.5 |
| D | 7 | 238 | 407499 | 2386.51 | 720 | 702 | 170.5 |
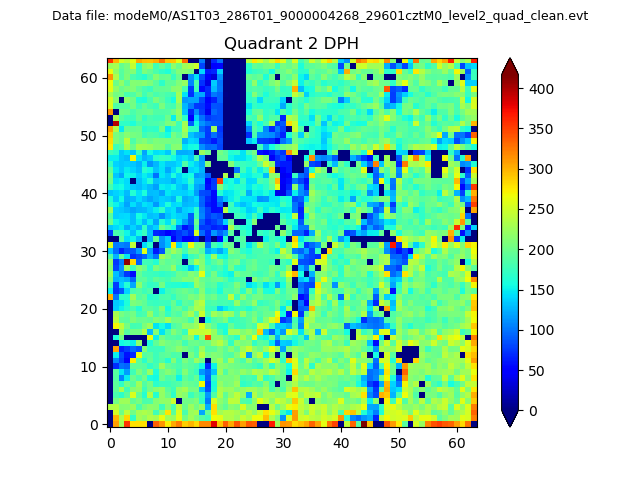
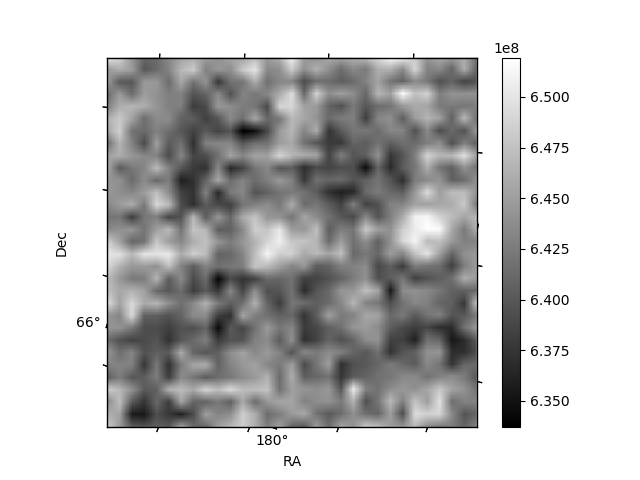
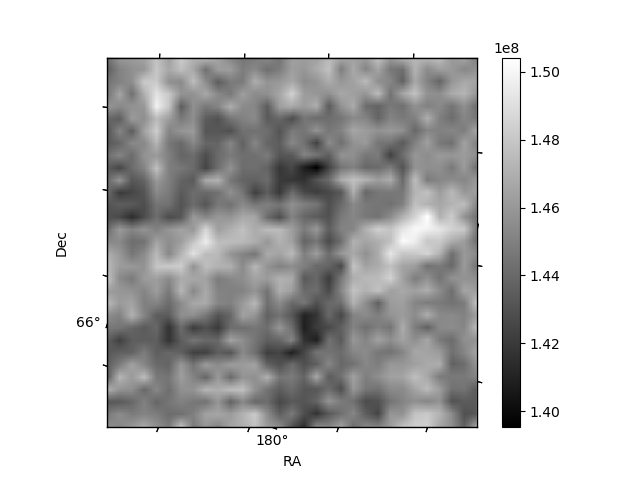
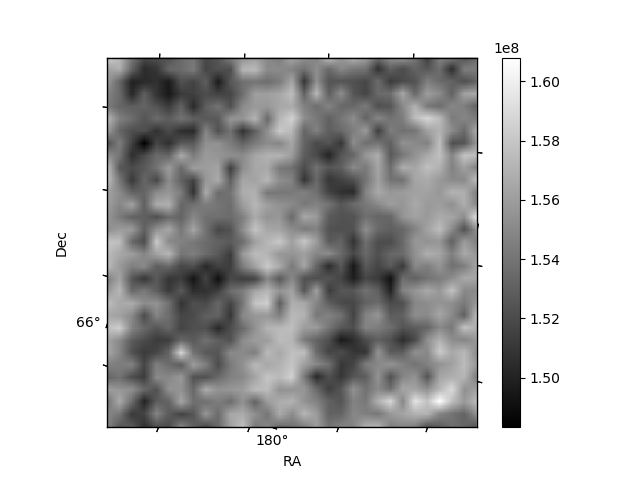
Histogram calculated using DETX and DETY for each event in the final _common_clean file
| Quadrant A | 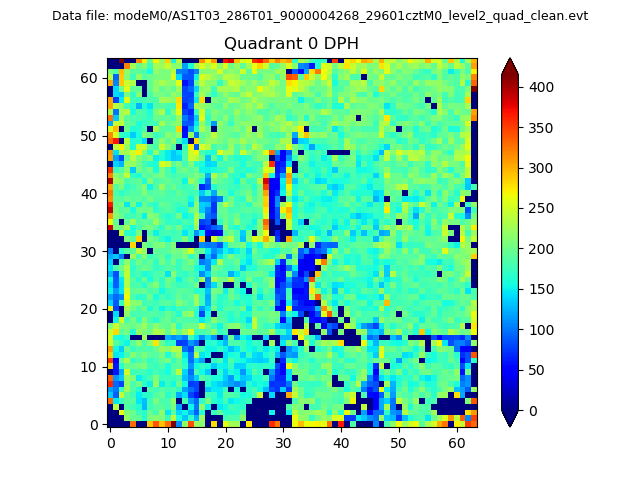 |
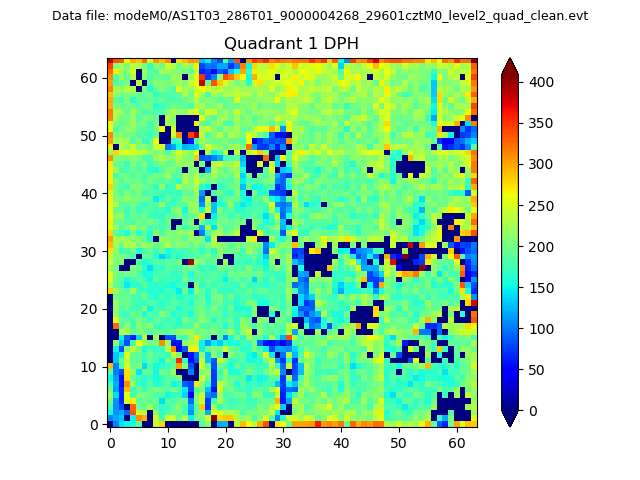 |
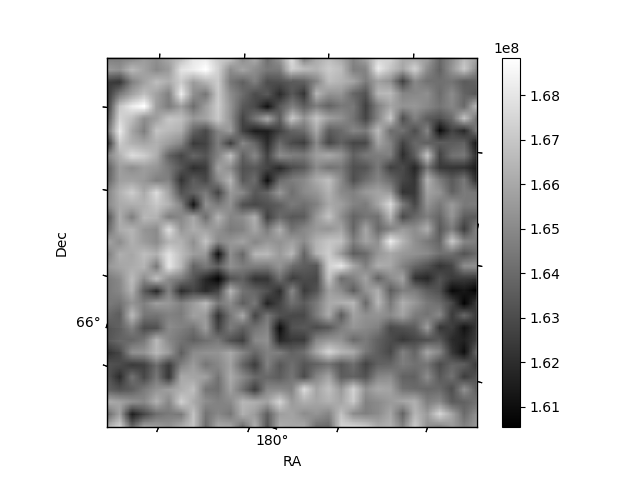
Quadrant B |
|---|---|---|---|
| Quadrant D | 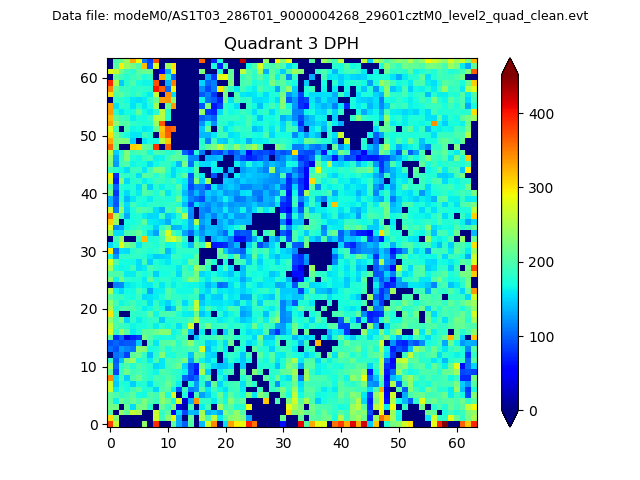 |
 |
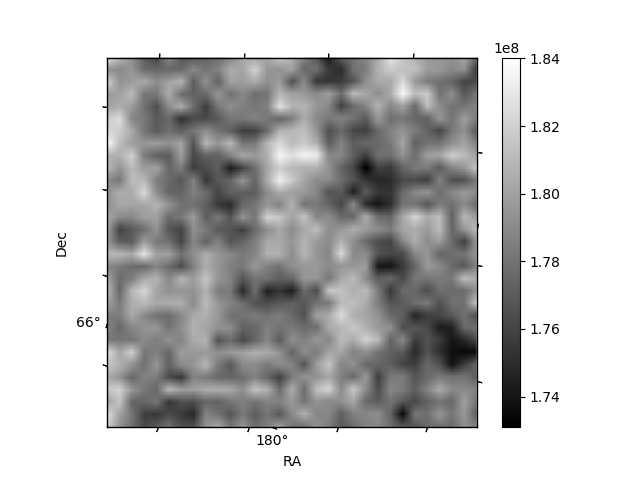
Quadrant C |
| Plot type | Count rate plots | Images |
|---|---|---|
| Comparison with Poisson distribution Blue bars denote a histogram of data divided into 1 sec bins. Red curve is a Poisson curve with rate = median count rate of data. |
 |
 |
| Quadrant-wise count rates Data is divided into 100 sec bins |
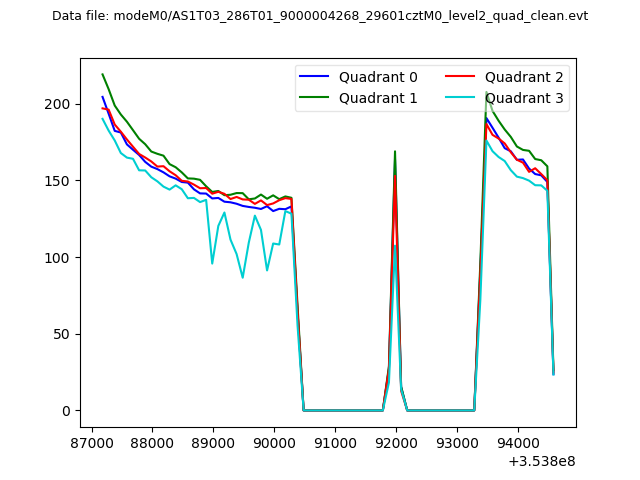 |
|
| Module-wise count rates for Quadrant A Data is divided into 100 sec bins |
 |
 |
| Module-wise count rates for Quadrant B Data is divided into 100 sec bins |
 |
 |
| Module-wise count rates for Quadrant C Data is divided into 100 sec bins |
 |
 |
| Module-wise count rates for Quadrant D Data is divided into 100 sec bins |
 |
 |
| Parameter | Plot |
|---|---|
| CZT HV Monitor |  |
| D_VDD |  |
| Temperature 1 | 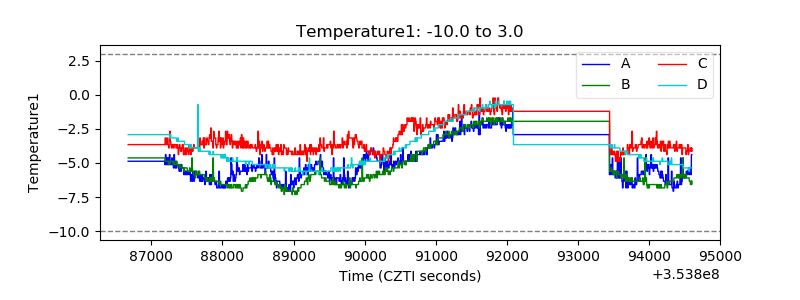 |
| Veto HV Monitor | 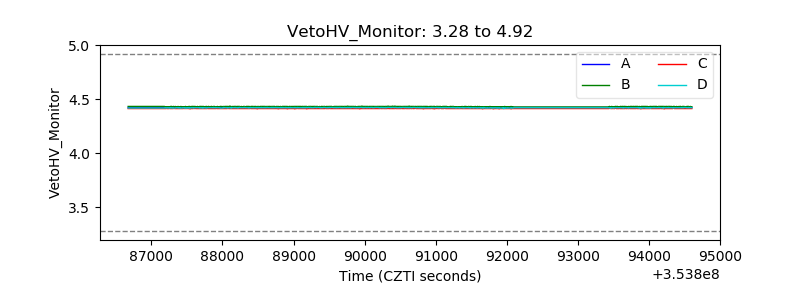 |
| Veto LLD |  |
| Alpha Counter | 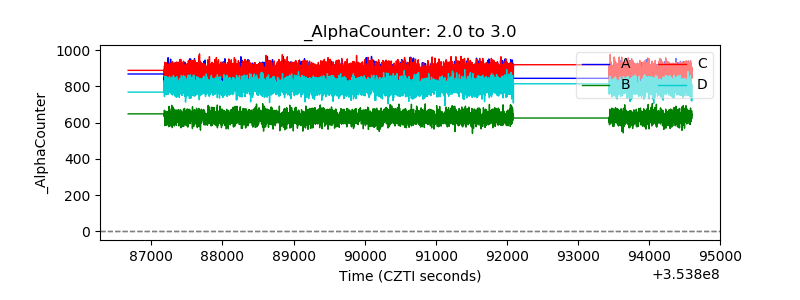 |
| _CPM_Rate | 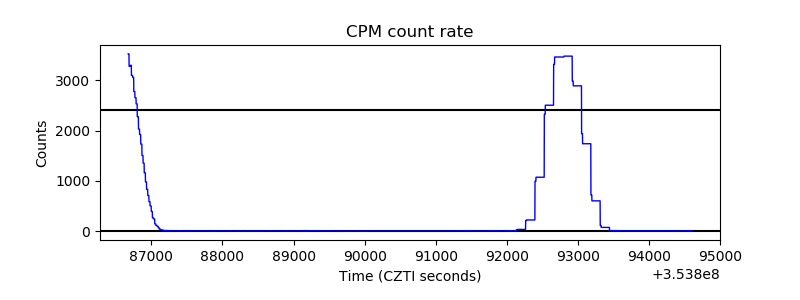 |
| CZT Counter | 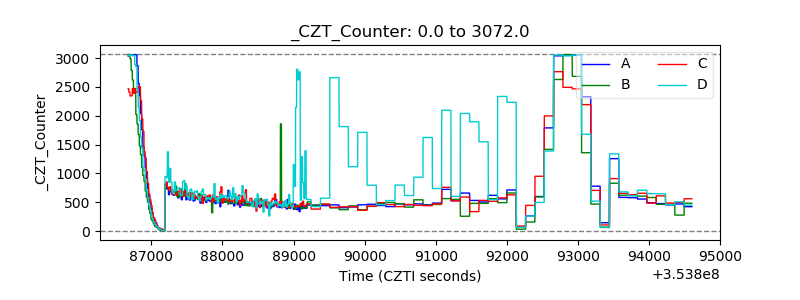 |
| +2.5 Volts monitor |  |
| +5 Volts monitor | 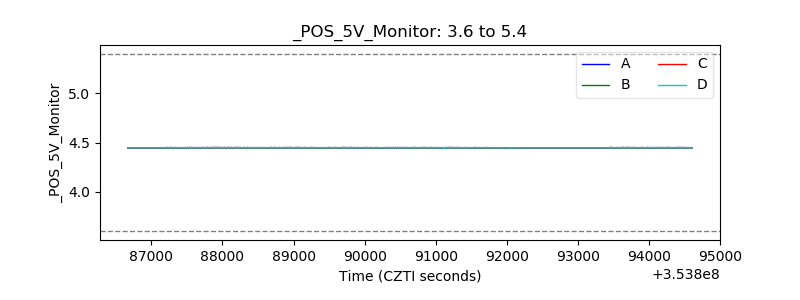 |
| _ROLL_ROT |  |
| _Roll_DEC | 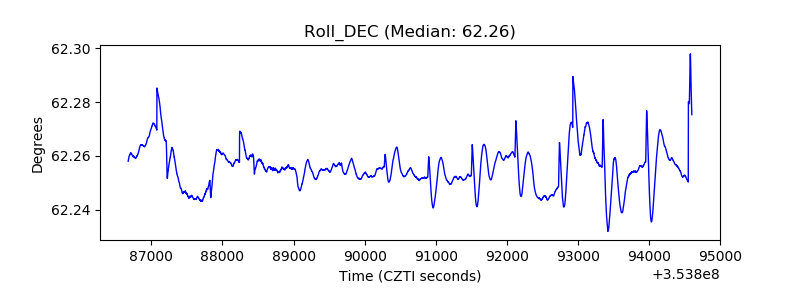 |
| _Roll_RA | 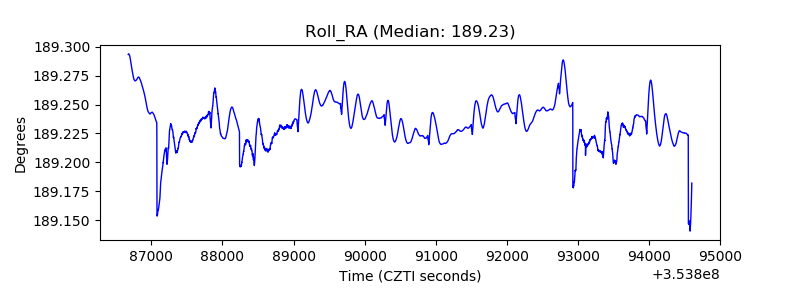 |
| Veto Counter |  |