| Param | Original file | Final file |
|---|---|---|
| Filename | modeM0/AS1T03_286T01_9000004268_29603cztM0_level2.evt | modeM0/AS1T03_286T01_9000004268_29603cztM0_level2_quad_clean.evt |
| Size (bytes) | 503,009,280 | 109,687,680 |
| Size | 479.7 MB | 104.6 MB |
| Events in quadrant A | 3,138,553 | 723,964 |
| Events in quadrant B | 3,252,413 | 752,157 |
| Events in quadrant C | 3,246,234 | 716,641 |
| Events in quadrant D | 5,145,924 | 666,381 |
| Mode M9 | |||
|---|---|---|---|
| Quadrant | BADHDUFLAG | Total packets | Discarded packets |
| A | 0 | 18 | 0 |
| B | 0 | 19 | 0 |
| C | 0 | 19 | 0 |
| D | 0 | 19 | 0 |
| Mode SS | |||
|---|---|---|---|
| Quadrant | BADHDUFLAG | Total packets | Discarded packets |
| A | 0 | 136 | 0 |
| B | 0 | 136 | 0 |
| C | 0 | 136 | 0 |
| D | 0 | 136 | 0 |
| Mode M0 | |||
|---|---|---|---|
| Quadrant | BADHDUFLAG | Total packets | Discarded packets |
| A | 0 | 13654 | 2 |
| B | 0 | 13797 | 2 |
| C | 0 | 13982 | 2 |
| D | 0 | 19734 | 2 |
| Quadrant | Total seconds | Saturated seconds | Saturation percentage |
|---|---|---|---|
| A | 6635 | 21 | 0.316503% |
| B | 6635 | 34 | 0.512434% |
| C | 6635 | 77 | 1.160512% |
| D | 6635 | 295 | 4.446119% |
Noise dominated data is calculated using 1-second bins in cleaned event files. If a bin has >2000 counts, and if more than 50% of those come from <1% of pixels, then it is considered to be noise-dominated and hence unusable.
| Quadrant | # 1 sec bins | Bins with >0 counts | Bins with >2000 counts | High rate bins dominated by noise | Noise dominated (total time) | Noise dominated (detector-on time) | Marked lightcurve |
|---|---|---|---|---|---|---|---|
| A | 7850 | 6636 | 0 | 0 | 0.00% | 0.00% |  |
| B | 7850 | 6636 | 3 | 3 | 0.04% | 0.05% | 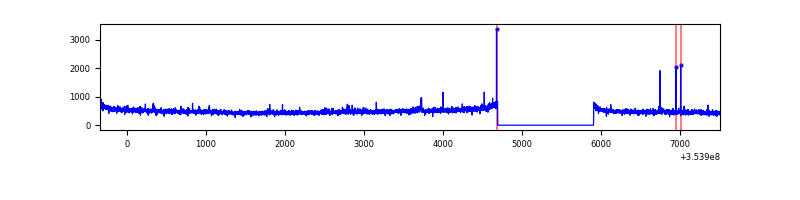 |
| C | 7850 | 6636 | 0 | 0 | 0.00% | 0.00% | 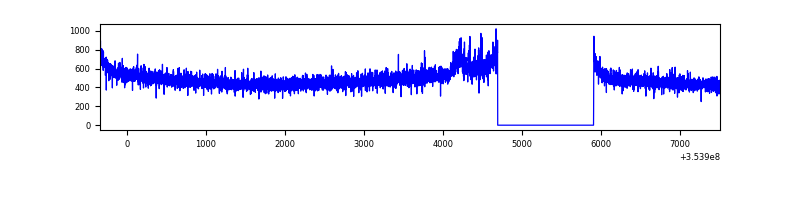 |
| D | 7850 | 6636 | 253 | 253 | 3.22% | 3.81% | 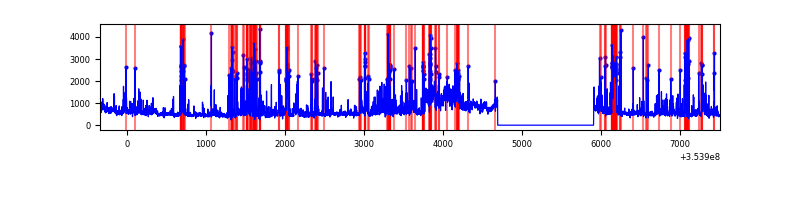 |
Top three noisy pixels from each quadrant. If the there are fewer than three noisy pixels in the level2.evt file, extra rows are filled as -1
| Pixel properties | Quadrant properties | ||||||
|---|---|---|---|---|---|---|---|
| Quadrant | DetID | PixID | Counts | Sigma | Mean | Median | Sigma |
| A | 13 | 254 | 11829 | 68.37 | 810 | 795 | 161.4 |
| A | 0 | 13 | 9839 | 56.04 | 810 | 795 | 161.4 |
| A | 3 | 137 | 7717 | 42.89 | 810 | 795 | 161.4 |
| B | 0 | 189 | 18640 | 116.5 | 817 | 797 | 153.2 |
| B | 12 | 111 | 18244 | 113.91 | 817 | 797 | 153.2 |
| B | 11 | 111 | 16249 | 100.88 | 817 | 797 | 153.2 |
| C | 14 | 238 | 131208 | 715.18 | 784 | 789 | 182.4 |
| C | 3 | 233 | 49527 | 267.27 | 784 | 789 | 182.4 |
| C | 2 | 114 | 15114 | 78.55 | 784 | 789 | 182.4 |
| D | 7 | 80 | 1191479 | 6641.65 | 763 | 742 | 179.3 |
| D | 8 | 195 | 394401 | 2195.74 | 763 | 742 | 179.3 |
| D | 7 | 238 | 354584 | 1973.65 | 763 | 742 | 179.3 |
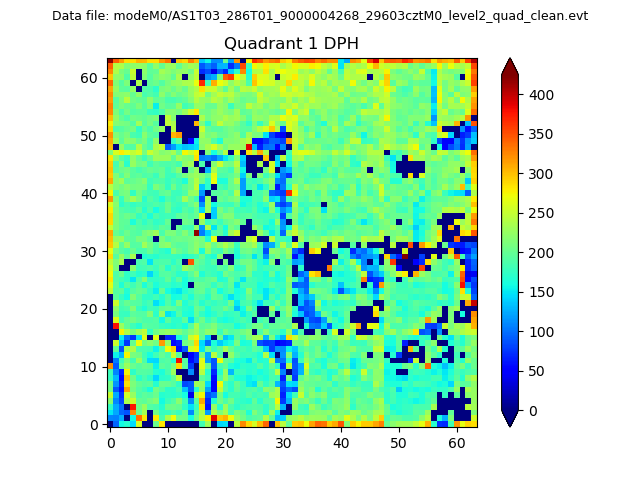
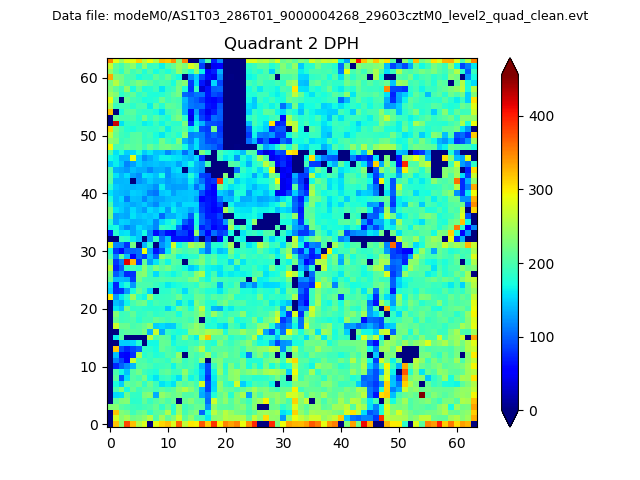
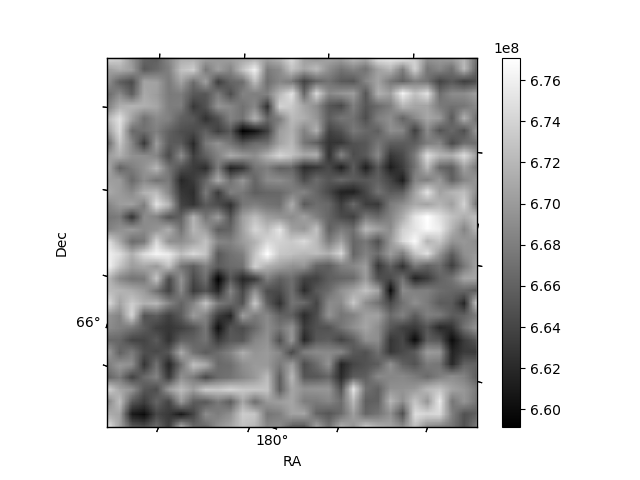
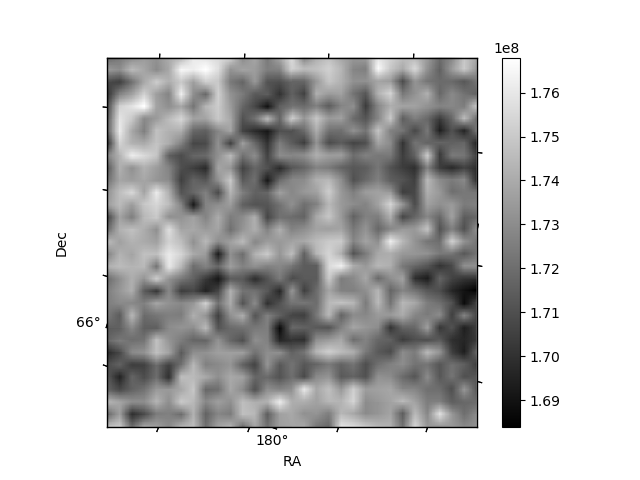
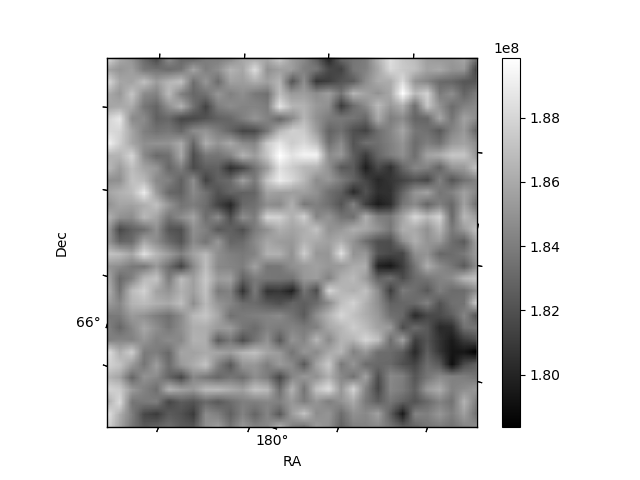
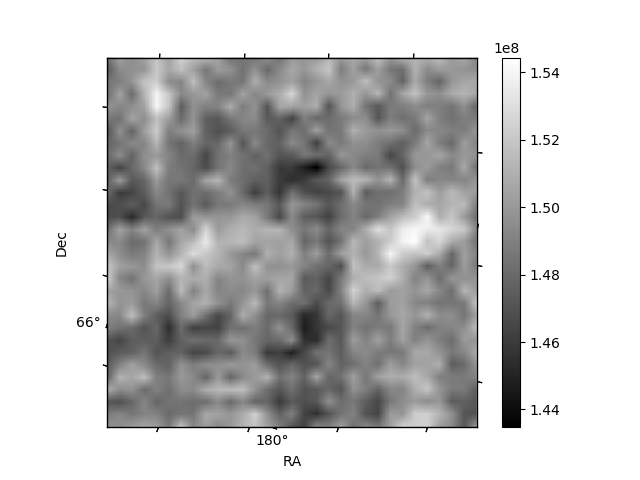
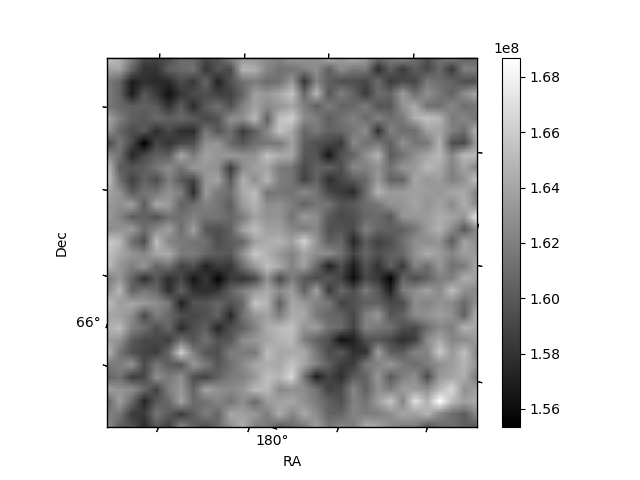
Histogram calculated using DETX and DETY for each event in the final _common_clean file
| Quadrant A | 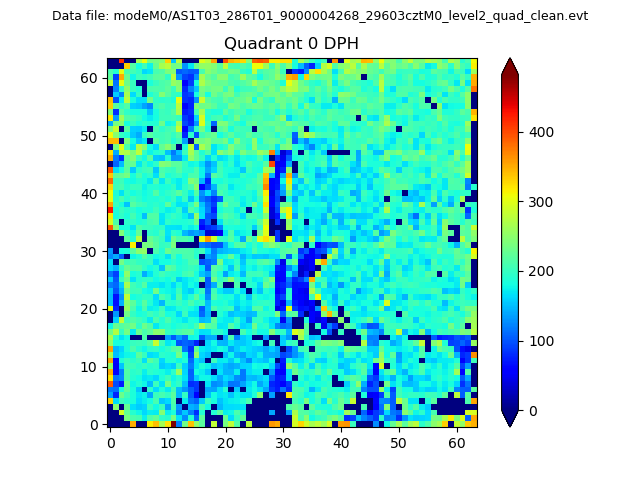 |
 |
Quadrant B |
|---|---|---|---|
| Quadrant D | 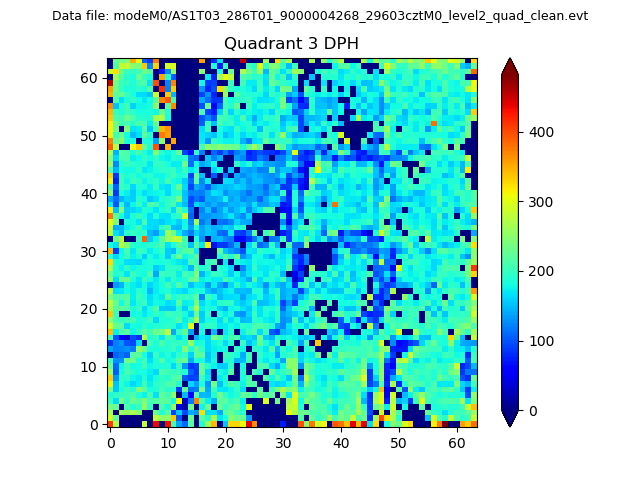 |
 |
Quadrant C |
| Plot type | Count rate plots | Images |
|---|---|---|
| Comparison with Poisson distribution Blue bars denote a histogram of data divided into 1 sec bins. Red curve is a Poisson curve with rate = median count rate of data. |
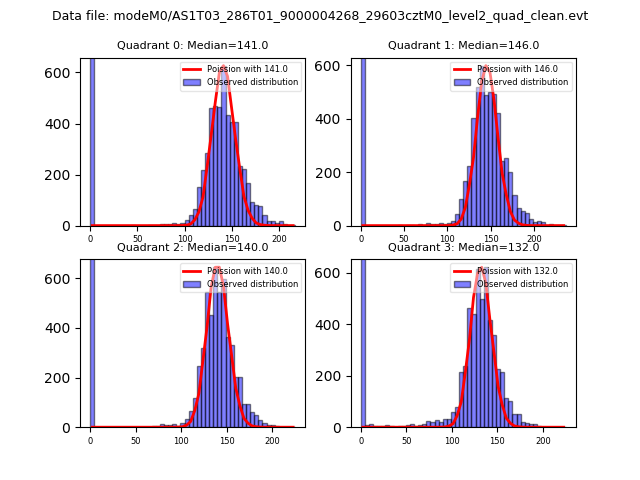 |
 |
| Quadrant-wise count rates Data is divided into 100 sec bins |
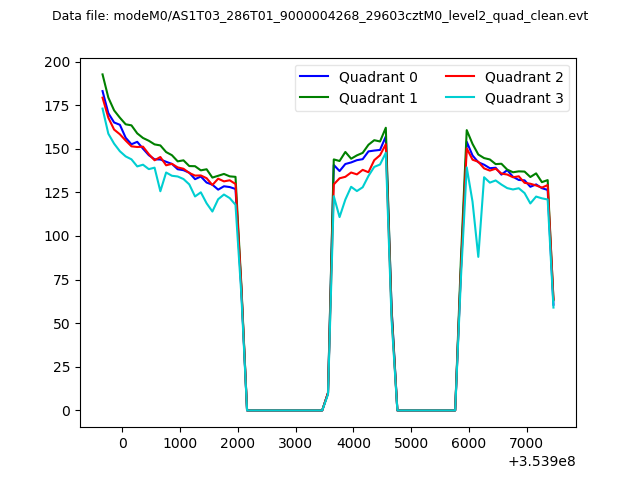 |
|
| Module-wise count rates for Quadrant A Data is divided into 100 sec bins |
 |
 |
| Module-wise count rates for Quadrant B Data is divided into 100 sec bins |
 |
 |
| Module-wise count rates for Quadrant C Data is divided into 100 sec bins |
 |
 |
| Module-wise count rates for Quadrant D Data is divided into 100 sec bins |
 |
 |
| Parameter | Plot |
|---|---|
| CZT HV Monitor |  |
| D_VDD | 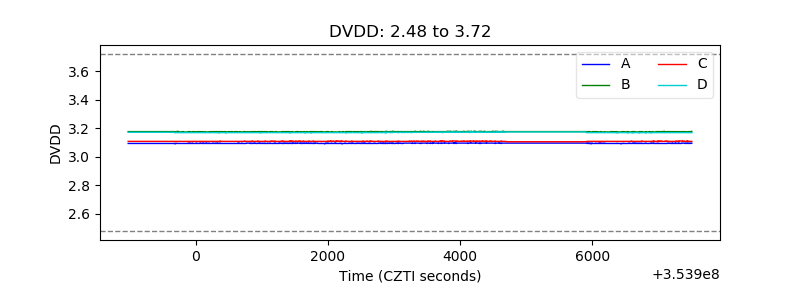 |
| Temperature 1 | 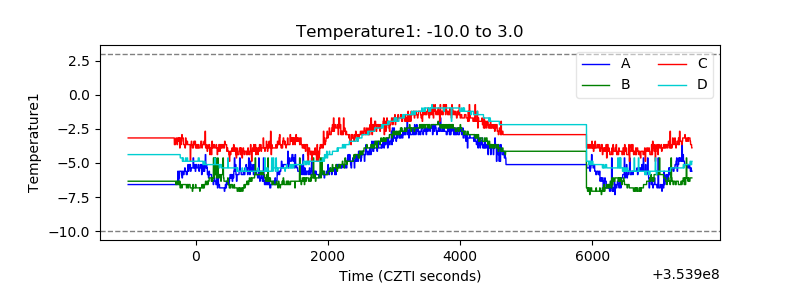 |
| Veto HV Monitor | 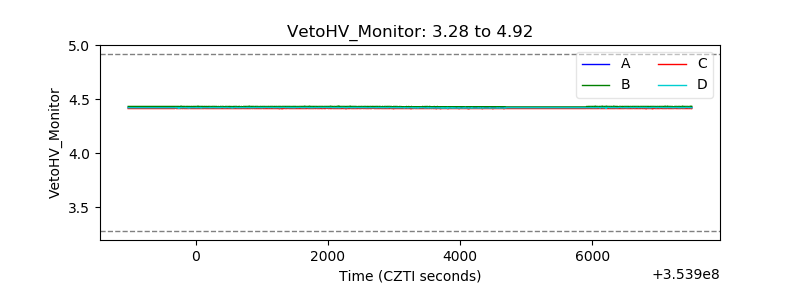 |
| Veto LLD | 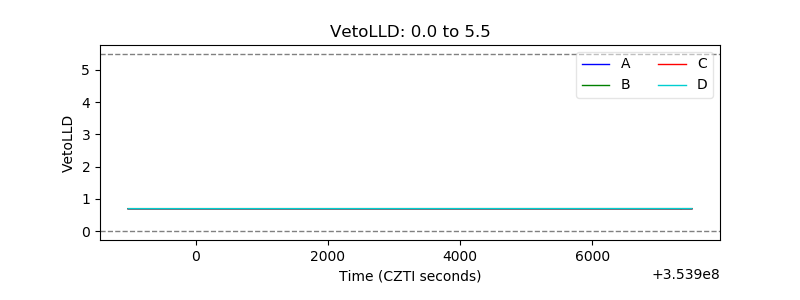 |
| Alpha Counter | 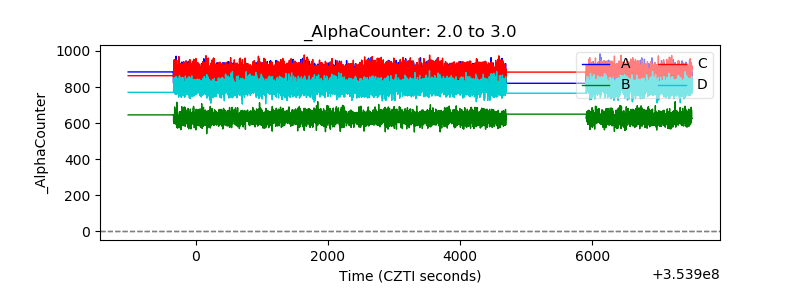 |
| _CPM_Rate | 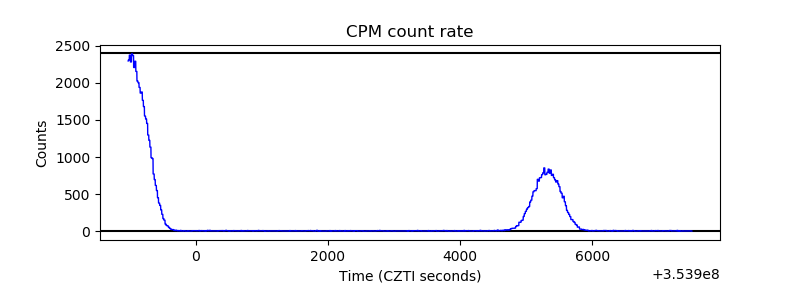 |
| CZT Counter | 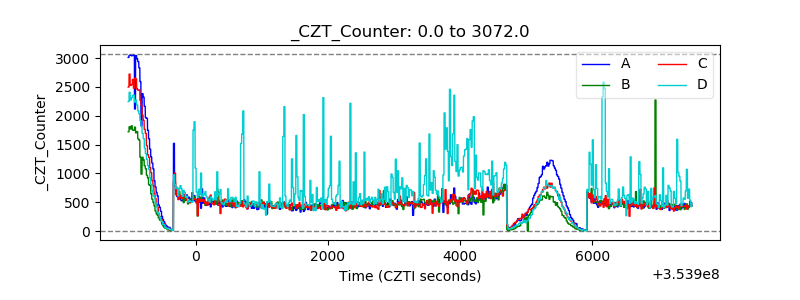 |
| +2.5 Volts monitor | 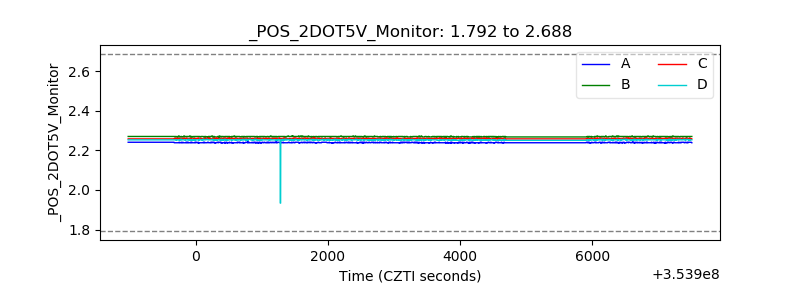 |
| +5 Volts monitor |  |
| _ROLL_ROT | 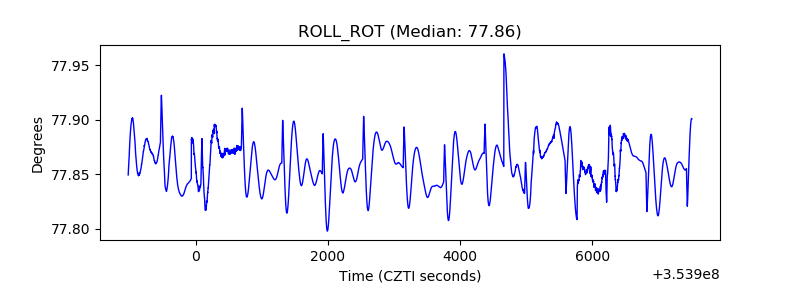 |
| _Roll_DEC | 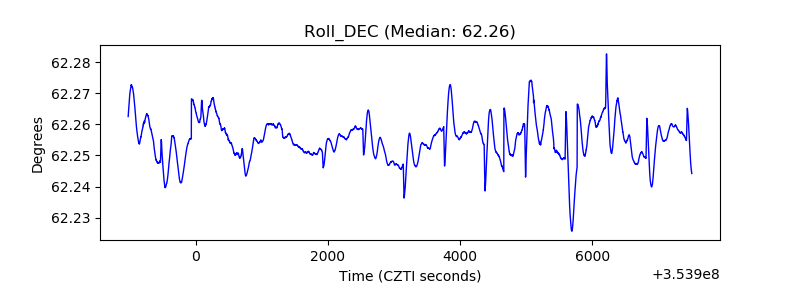 |
| _Roll_RA | 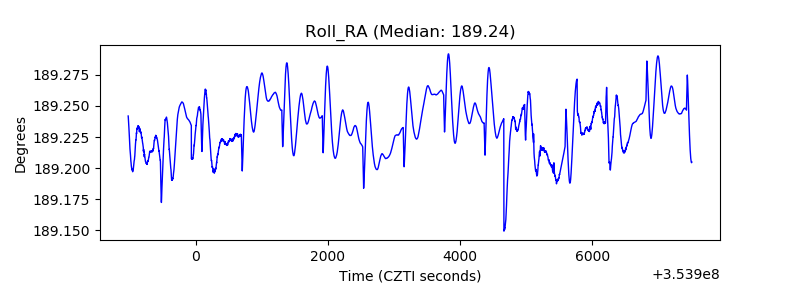 |
| Veto Counter |  |