| Param | Original file | Final file |
|---|---|---|
| Filename | modeM0/AS1T03_286T01_9000004268_29605cztM0_level2.evt | modeM0/AS1T03_286T01_9000004268_29605cztM0_level2_quad_clean.evt |
| Size (bytes) | 510,419,520 | 97,856,640 |
| Size | 486.8 MB | 93.3 MB |
| Events in quadrant A | 3,042,365 | 634,849 |
| Events in quadrant B | 3,130,233 | 648,250 |
| Events in quadrant C | 3,574,501 | 618,927 |
| Events in quadrant D | 5,256,411 | 594,516 |
| Mode M9 | |||
|---|---|---|---|
| Quadrant | BADHDUFLAG | Total packets | Discarded packets |
| A | 0 | 4 | 0 |
| B | 0 | 4 | 0 |
| C | 0 | 4 | 0 |
| D | 0 | 4 | 0 |
| Mode SS | |||
|---|---|---|---|
| Quadrant | BADHDUFLAG | Total packets | Discarded packets |
| A | 0 | 136 | 0 |
| B | 0 | 136 | 0 |
| C | 0 | 136 | 0 |
| D | 0 | 136 | 0 |
| Mode M0 | |||
|---|---|---|---|
| Quadrant | BADHDUFLAG | Total packets | Discarded packets |
| A | 0 | 13617 | 1 |
| B | 0 | 13730 | 1 |
| C | 0 | 14829 | 1 |
| D | 0 | 20177 | 1 |
| Quadrant | Total seconds | Saturated seconds | Saturation percentage |
|---|---|---|---|
| A | 6696 | 95 | 1.418757% |
| B | 6697 | 109 | 1.627594% |
| C | 6697 | 206 | 3.076004% |
| D | 6697 | 409 | 6.107212% |
Noise dominated data is calculated using 1-second bins in cleaned event files. If a bin has >2000 counts, and if more than 50% of those come from <1% of pixels, then it is considered to be noise-dominated and hence unusable.
| Quadrant | # 1 sec bins | Bins with >0 counts | Bins with >2000 counts | High rate bins dominated by noise | Noise dominated (total time) | Noise dominated (detector-on time) | Marked lightcurve |
|---|---|---|---|---|---|---|---|
| A | 7096 | 6696 | 0 | 0 | 0.00% | 0.00% | 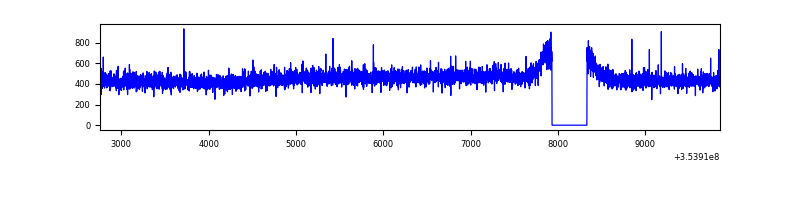 |
| B | 7097 | 6697 | 1 | 1 | 0.01% | 0.01% | 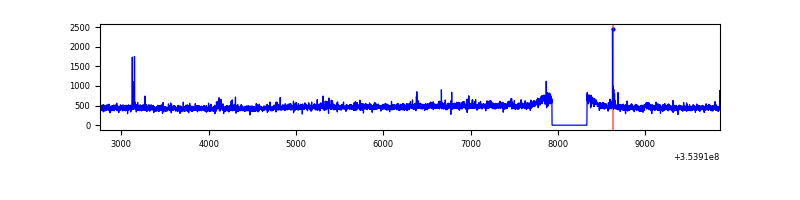 |
| C | 7097 | 6698 | 0 | 0 | 0.00% | 0.00% | 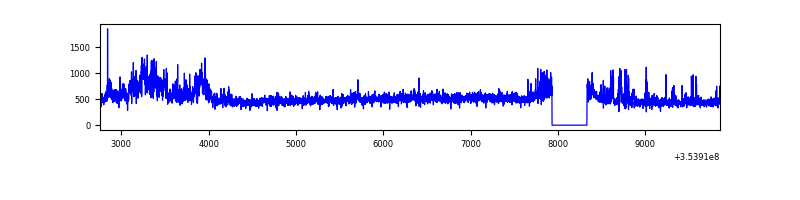 |
| D | 7097 | 6698 | 296 | 296 | 4.17% | 4.42% | 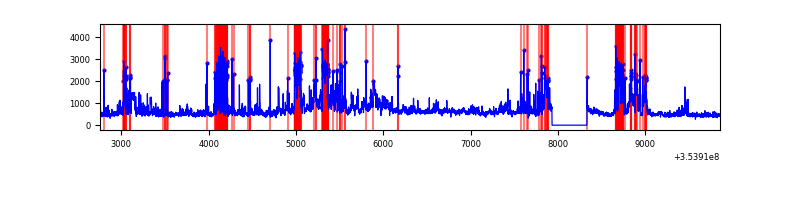 |
Top three noisy pixels from each quadrant. If the there are fewer than three noisy pixels in the level2.evt file, extra rows are filled as -1
| Pixel properties | Quadrant properties | ||||||
|---|---|---|---|---|---|---|---|
| Quadrant | DetID | PixID | Counts | Sigma | Mean | Median | Sigma |
| A | 13 | 254 | 12441 | 73.43 | 787 | 771 | 158.9 |
| A | 3 | 137 | 8147 | 46.41 | 787 | 771 | 158.9 |
| A | 0 | 226 | 6630 | 36.87 | 787 | 771 | 158.9 |
| B | 12 | 111 | 18790 | 119.93 | 787 | 765 | 150.3 |
| B | 0 | 230 | 17715 | 112.78 | 787 | 765 | 150.3 |
| B | 11 | 111 | 16822 | 106.83 | 787 | 765 | 150.3 |
| C | 3 | 233 | 409534 | 2332.86 | 753 | 757 | 175.2 |
| C | 14 | 238 | 154619 | 878.08 | 753 | 757 | 175.2 |
| C | 14 | 254 | 46666 | 262.0 | 753 | 757 | 175.2 |
| D | 7 | 238 | 1256776 | 7229.67 | 740 | 721 | 173.7 |
| D | 12 | 227 | 579484 | 3331.27 | 740 | 721 | 173.7 |
| D | 8 | 195 | 438048 | 2517.19 | 740 | 721 | 173.7 |
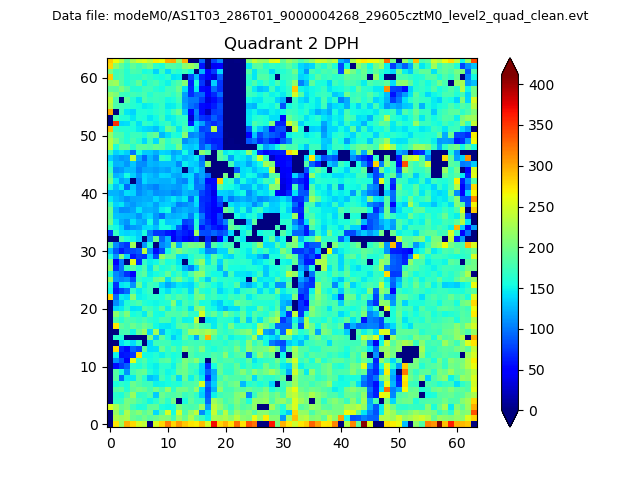
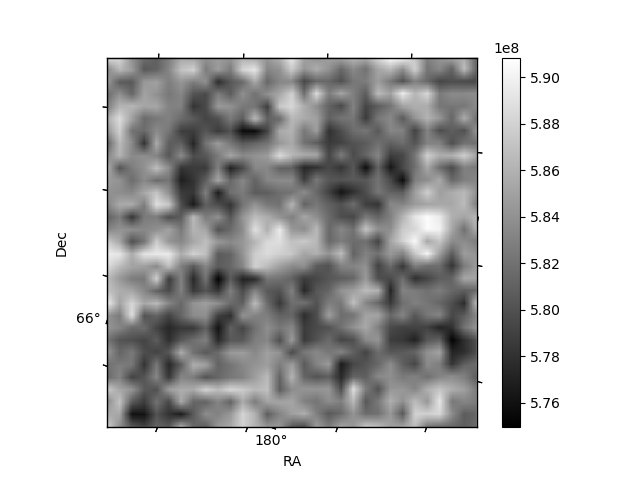
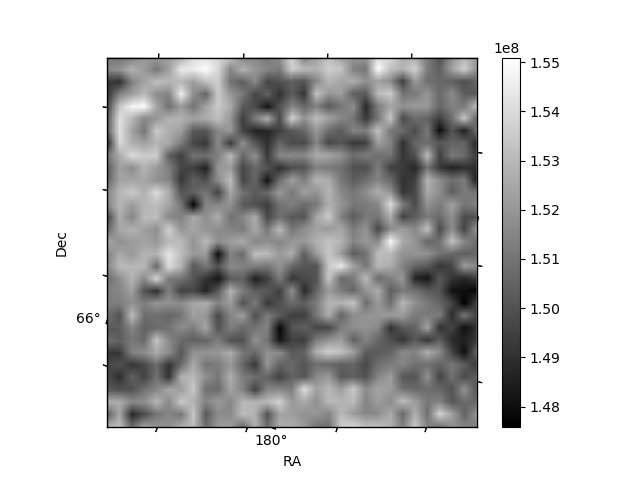
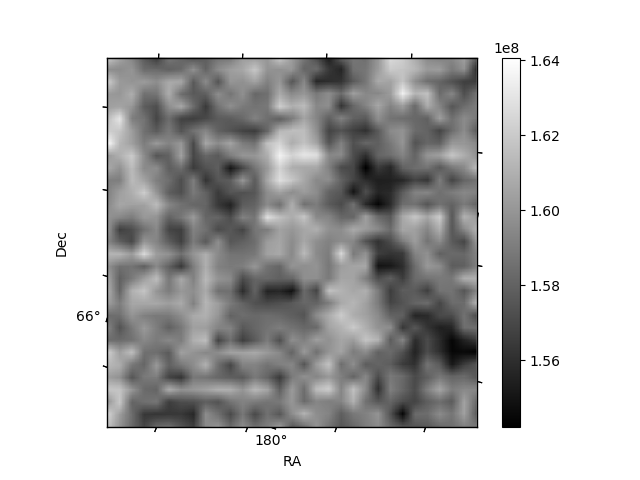
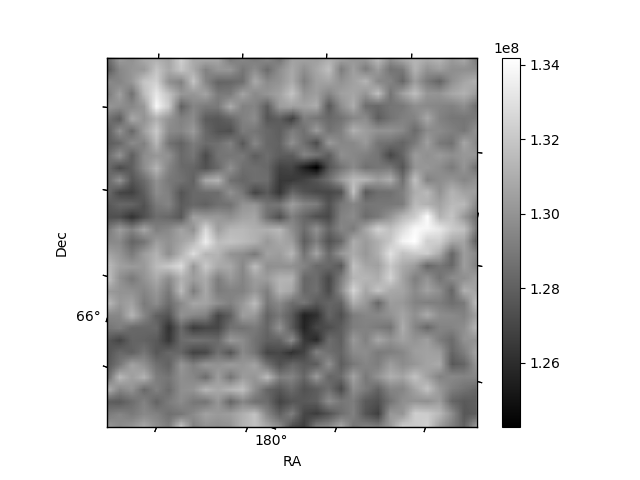
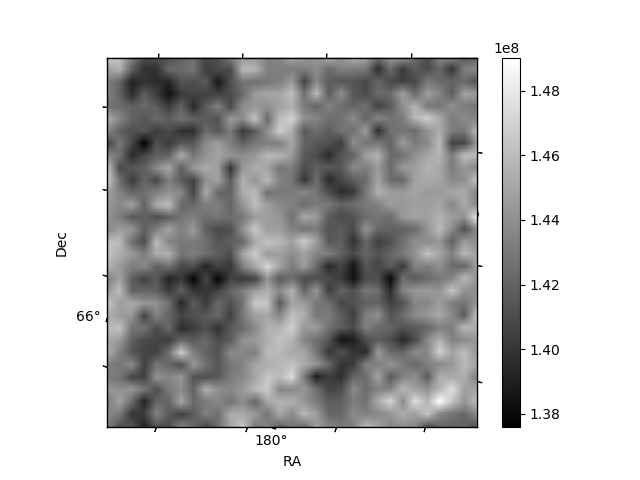
Histogram calculated using DETX and DETY for each event in the final _common_clean file
| Quadrant A | 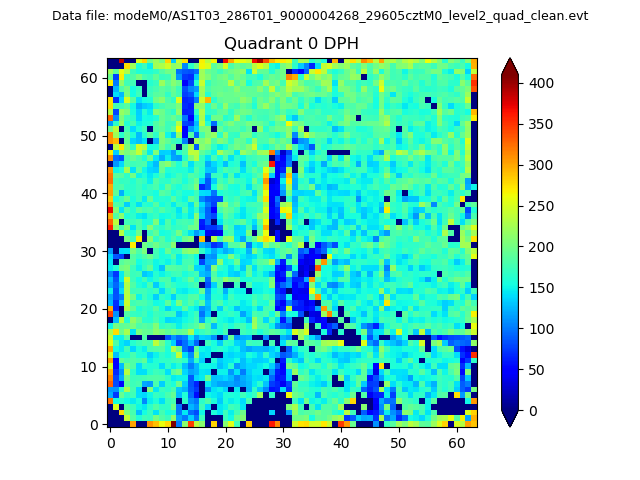 |
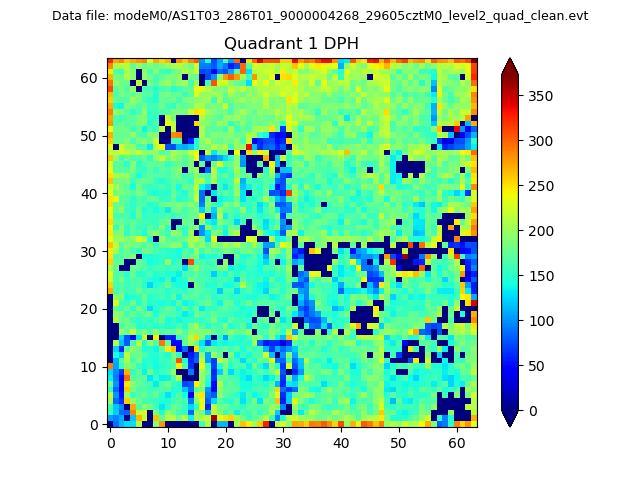 |
Quadrant B |
|---|---|---|---|
| Quadrant D | 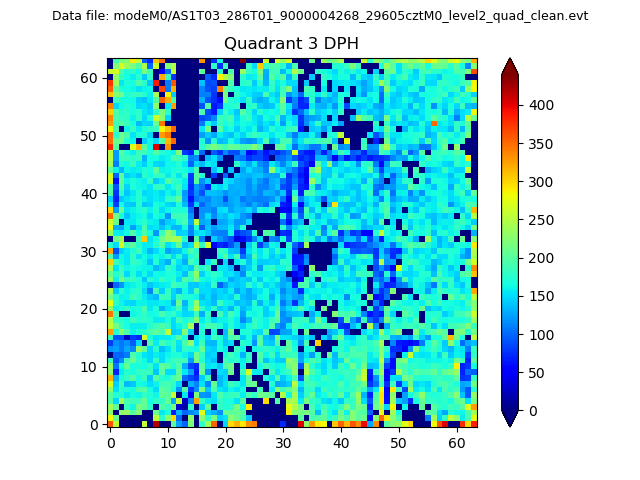 |
 |
Quadrant C |
| Plot type | Count rate plots | Images |
|---|---|---|
| Comparison with Poisson distribution Blue bars denote a histogram of data divided into 1 sec bins. Red curve is a Poisson curve with rate = median count rate of data. |
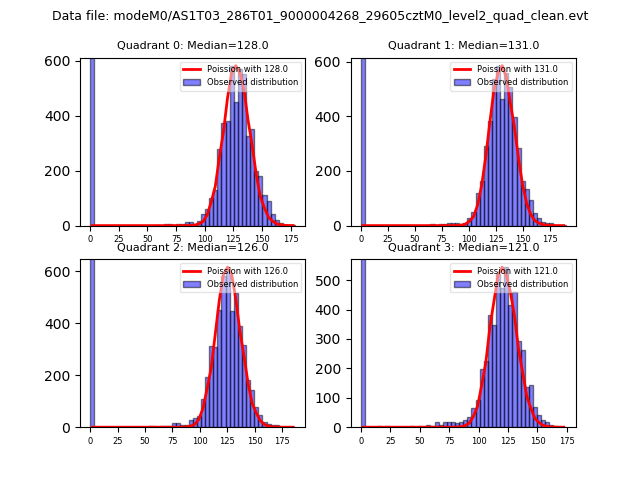 |
 |
| Quadrant-wise count rates Data is divided into 100 sec bins |
 |
|
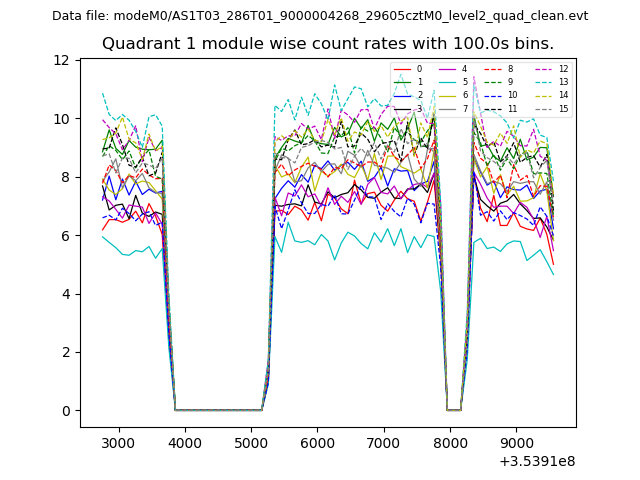
| Module-wise count rates for Quadrant A Data is divided into 100 sec bins |
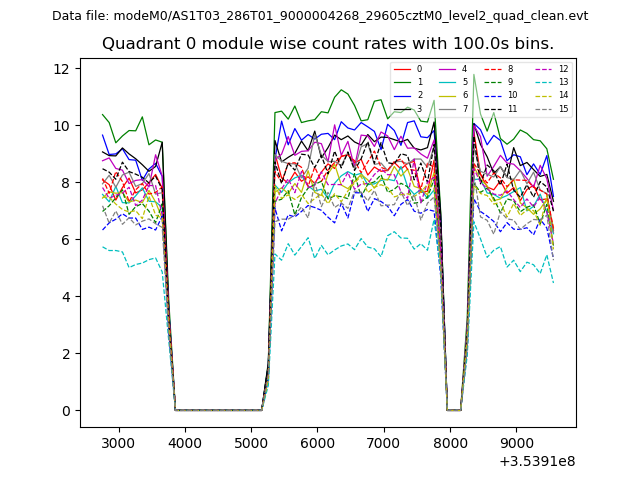 |
 |
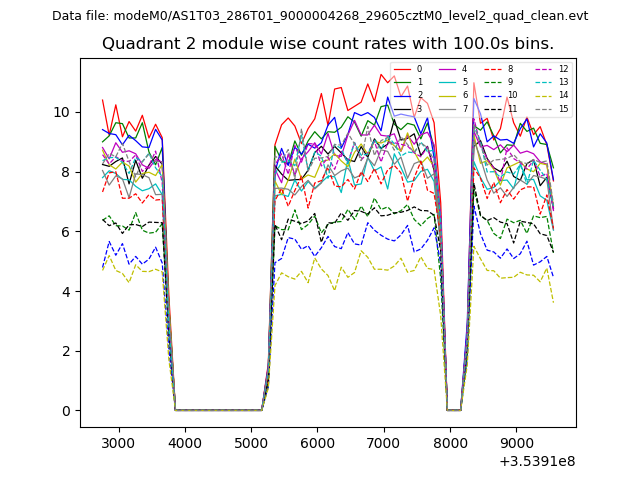
| Module-wise count rates for Quadrant B Data is divided into 100 sec bins |
 |
 |
| Module-wise count rates for Quadrant C Data is divided into 100 sec bins |
 |
 |
| Module-wise count rates for Quadrant D Data is divided into 100 sec bins |
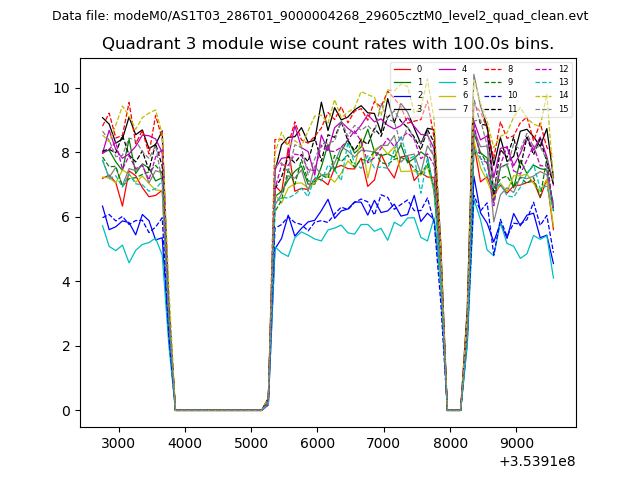 |
 |
| Parameter | Plot |
|---|---|
| CZT HV Monitor | 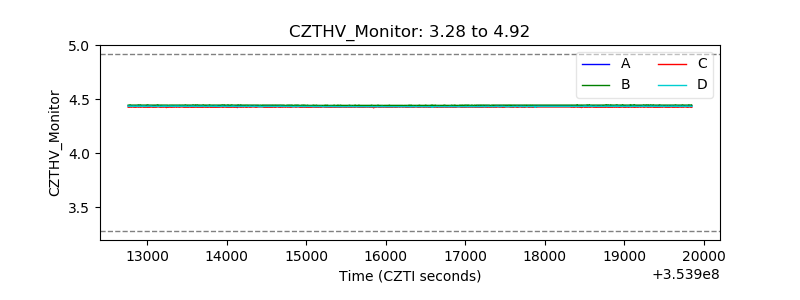 |
| D_VDD | 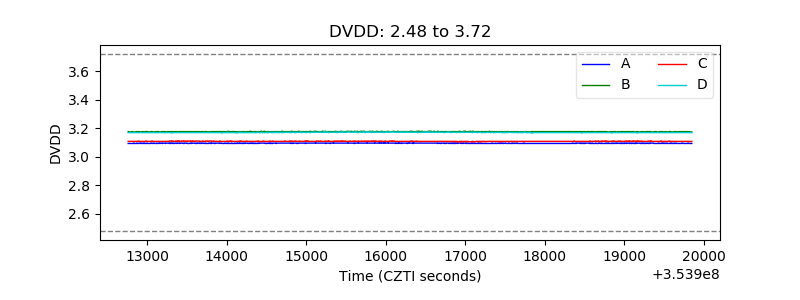 |
| Temperature 1 | 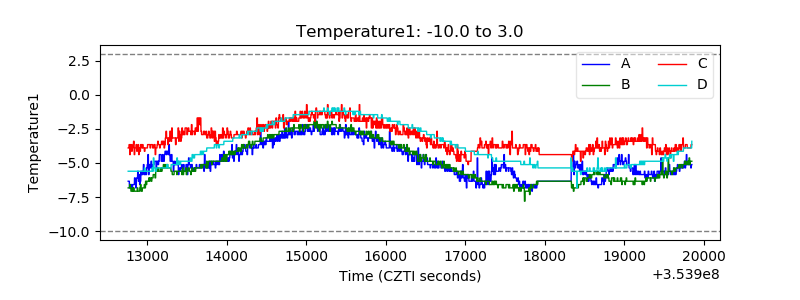 |
| Veto HV Monitor | 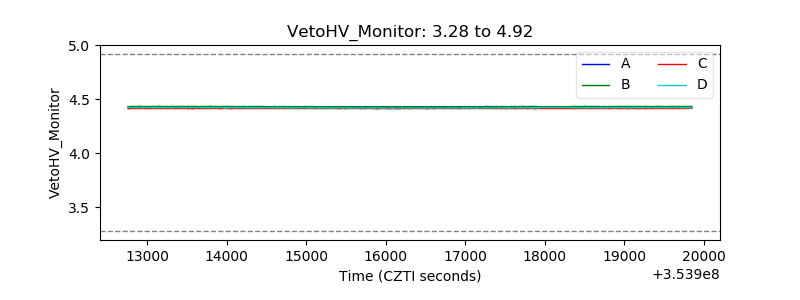 |
| Veto LLD |  |
| Alpha Counter |  |
| _CPM_Rate | 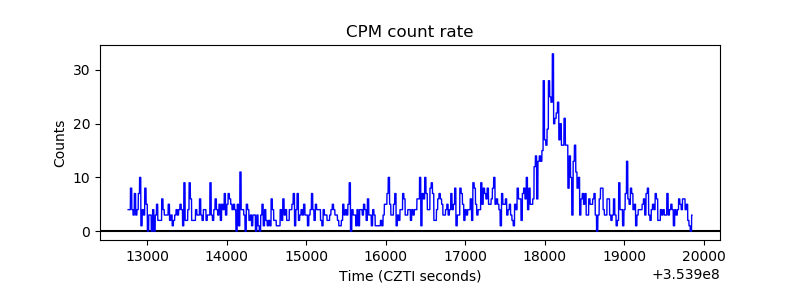 |
| CZT Counter | 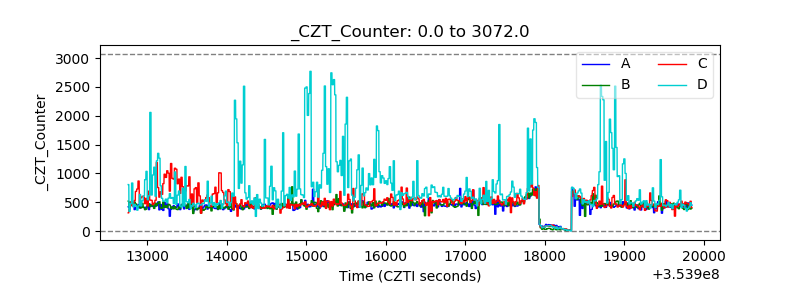 |
| +2.5 Volts monitor | 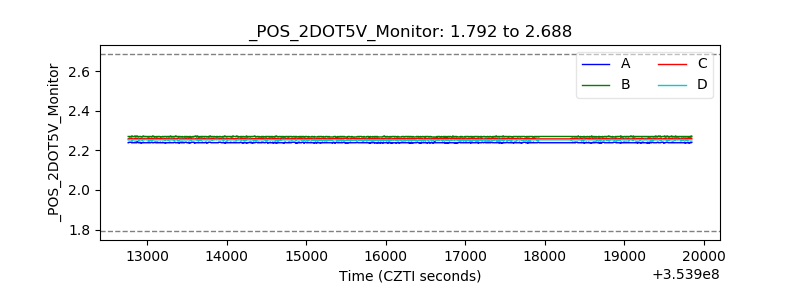 |
| +5 Volts monitor |  |
| _ROLL_ROT | 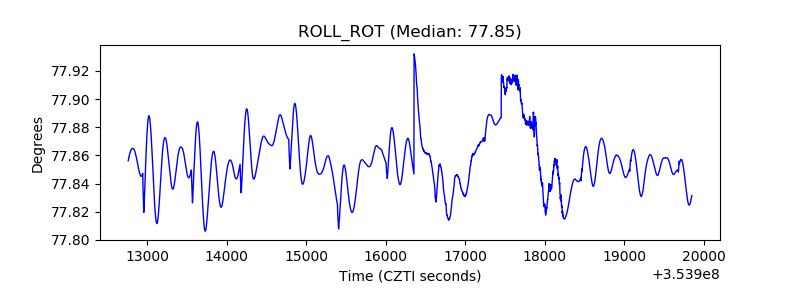 |
| _Roll_DEC |  |
| _Roll_RA | 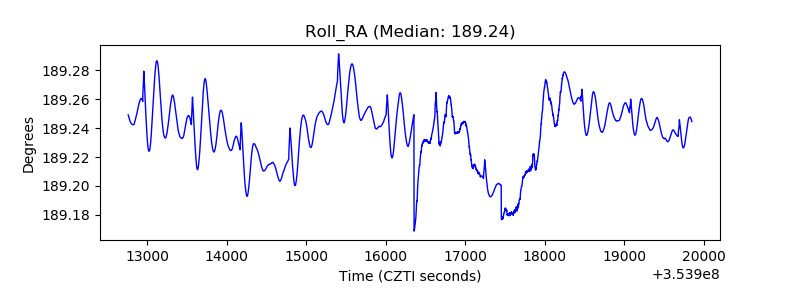 |
| Veto Counter | 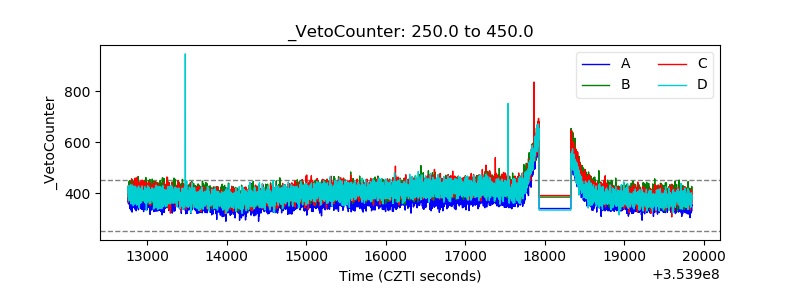 |